Proteostasis modulates gene dosage evolution in antibiotic-resistant bacteria
- Department of Biology, Indian Institute of Science Education and Research, India
Figures
Figure 1 with 3 supplements
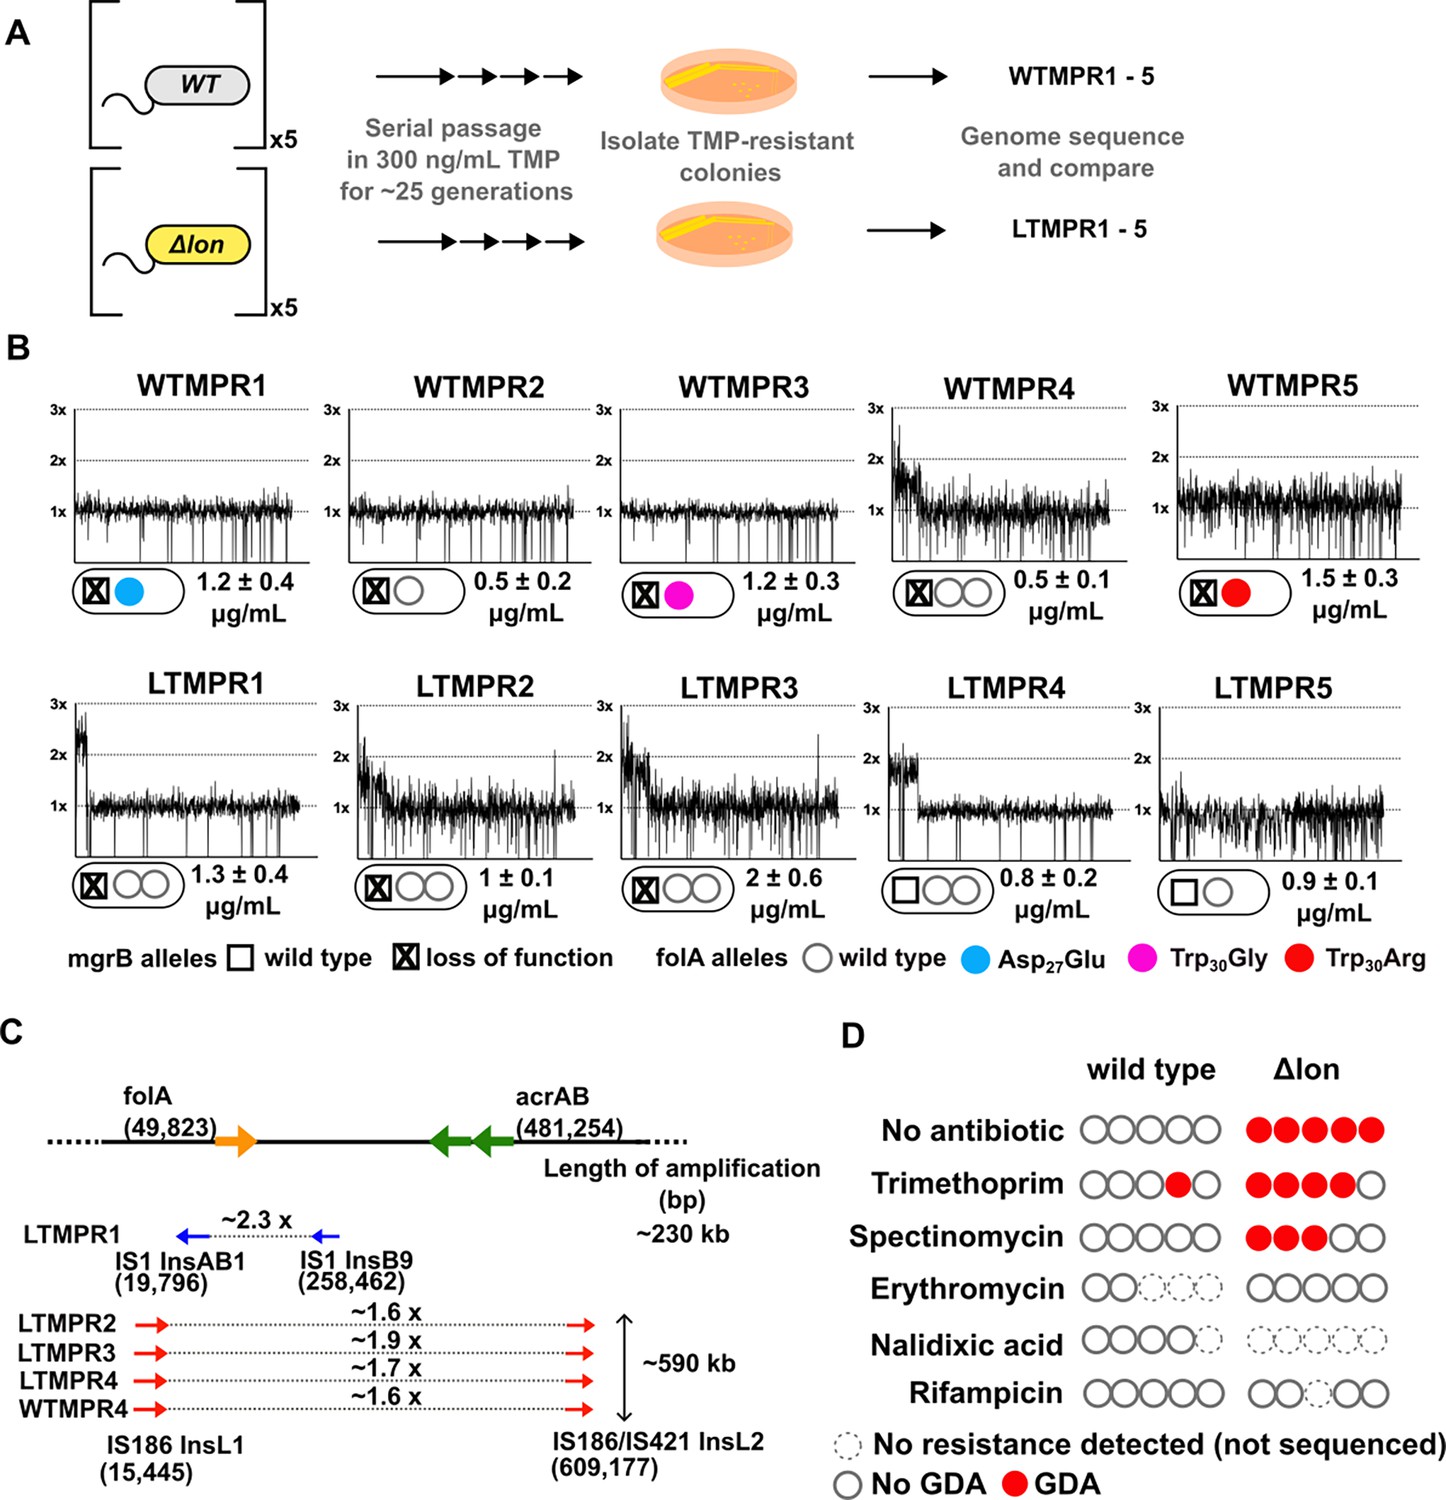
Adaptation to antibiotics by large genomic duplications is favoured in lon-deficient E. coli.
(A) Schematic of the experimental pipeline used to compare the mutation repertoire of adaptation to trimethoprim in wild-type or lon-deficient E. coli. (B) Coverage depth plots and mutations at the folA and mgrB loci of five independently evolved trimethoprim-resistant isolates derived from wild-type (WTMPR1–5) or Δlon E. coli (LTMPR1–5). Coverage depth plots show the number of reads from Illumina short-read sequencing (y-axis) mapped to each genomic coordinate of the reference genome (x-axis). Coverage of 1×, 2×, and 3× are marked by dotted lines for reference. Mutations in mgrB and folA and trimethoprim inhibitory concentration 50 (IC50) values (mean ± SD from three independent measurements) are provided for each isolate below the appropriate coverage depth plot. (C) Cartoon (not to scale) showing the duplicated genomic stretch and flanking IS-elements in trimethoprim-resistant isolates. Blue arrows represent IS1, while red arrows represent IS186. The positions of folA and acrAB genes, implicated in trimethoprim resistance in earlier studies, relative to the duplicated stretch are shown. Fold increase in the number of reads corresponding to the folA gene are indicated for each isolate. (D) Summary of the prevalence of gene duplication and amplification (GDA) mutations detected in wild-type or E. coli Δlon after ~25 generations of evolution in control media (no antibiotic) or in media supplemented with sub-MIC antibiotics. Each circle represents one of the five replicates in the evolution experiment. Empty circles represent replicates in which no resistance was detected (dotted perimeter) or where the whole population or resistant isolates were sequenced but no GDA mutation was detected (solid perimeter). Red filled circles indicate that a GDA mutation was identified.
Figure 1—figure supplement 1
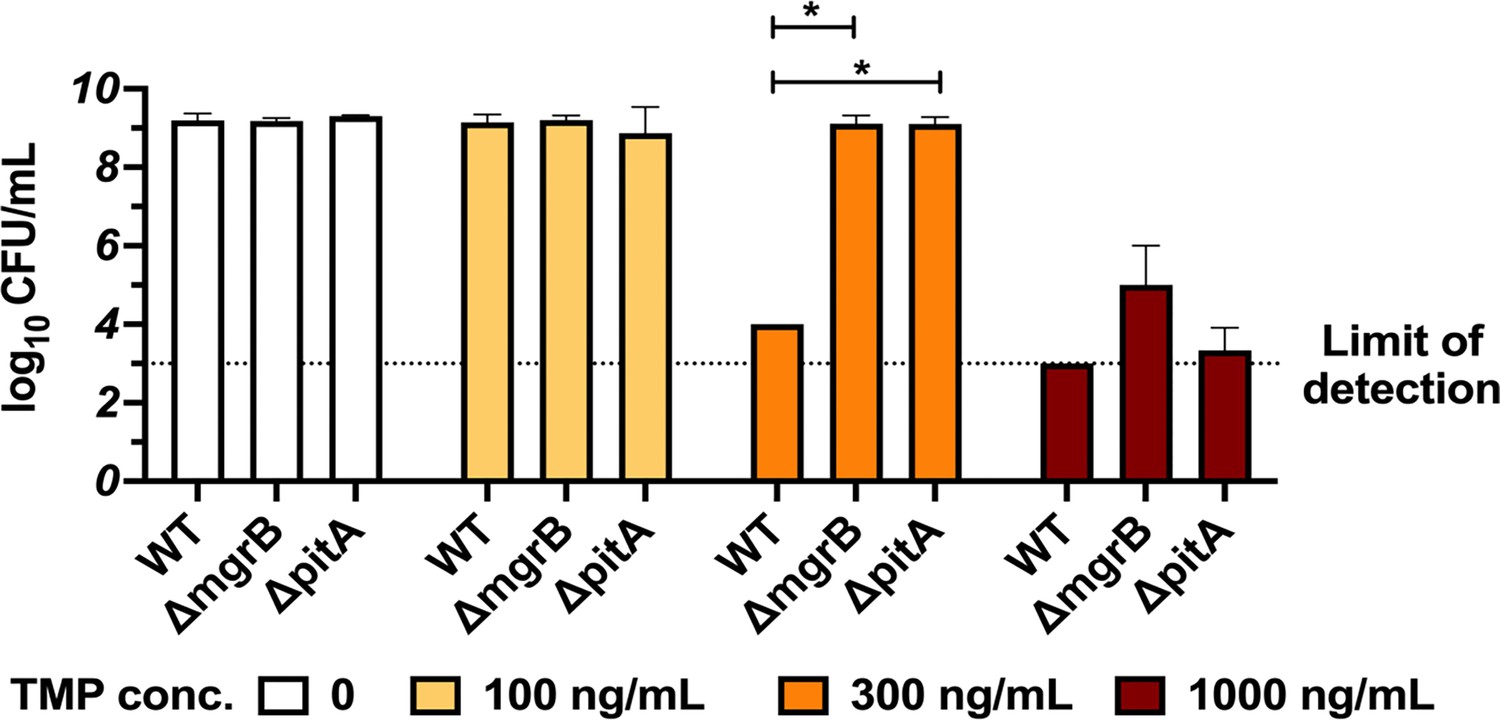
Loss of mgrB or pitA genes is beneficial in trimethoprim.
Colony formation of E. coli wild-type, ΔmgrB and ΔpitA on media supplemented with trimethoprim at the indicated concentrations. Mean ± SD from three independent replicates are plotted. Statistical significance was tested using a t-test and p-value<0.05 is indicated with an asterisk (*).
Figure 1—figure supplement 2
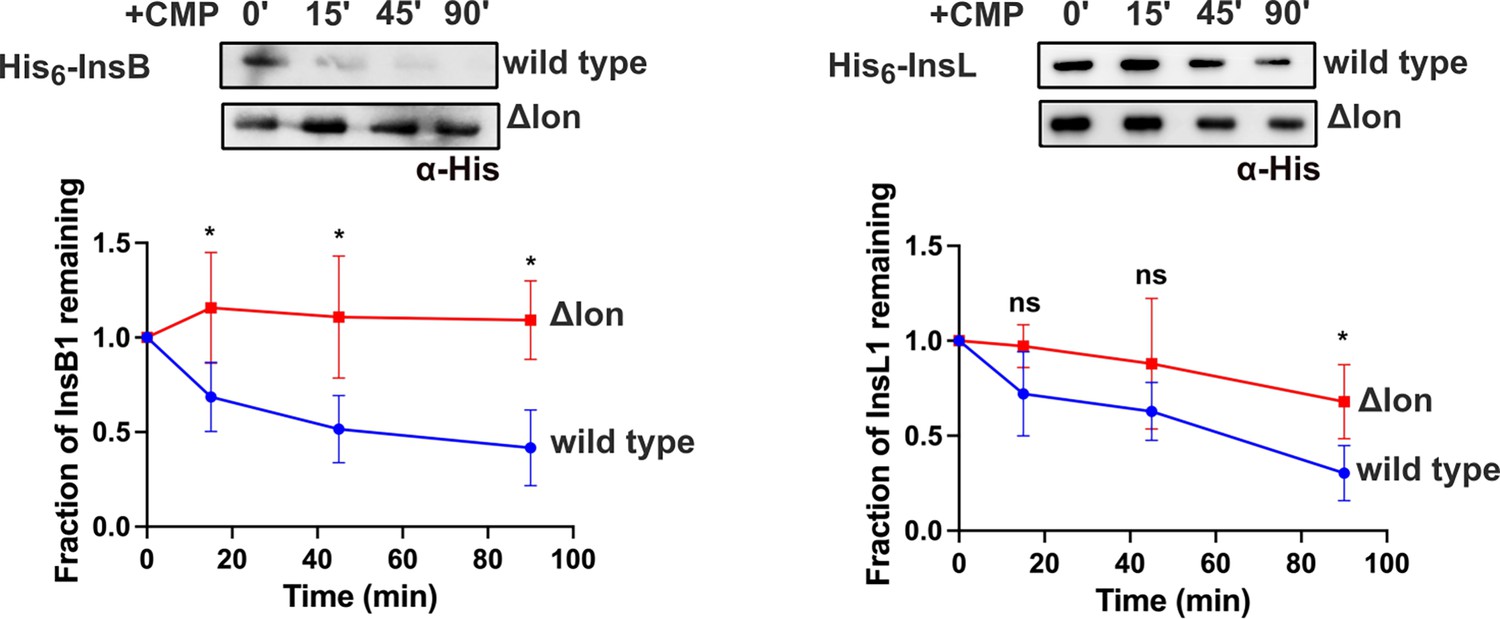
Stability of heterologously expressed InsB and InsL transposases in wild-type or Δlon E. coli measured using a chloramphenicol (CMP) chase assay.
Levels of the plasmid-expressed transposase were measured using immunoblotting with an anti-His monoclonal/polyclonal antibody in lysates prepared from cells at indicated time points following treatment with 50 μg/mL of CMP. A representative image from three independent experiments is shown. Band intensities were quantitated by image analyses and normalised to 0 (set to 1). The fraction of protein remaining is plotted in blue for wild-type and red for E. coli Δlon. Values from three independent experiments are plotted as mean ± SD. Statistical significance was tested using an unpaired t-test. A p-value of <0.05 was considered statistically significant (*). A p-value>0.05 was considered not statistically significant (ns).
-
Figure 1—figure supplement 2—source data 1
Annotated image files for western blots in Figure 1—figure supplement 2.
- https://cdn.elifesciences.org/articles/99785/elife-99785-fig1-figsupp2-data1-v1.zip
-
Figure 1—figure supplement 2—source data 2
Raw image file for western blots in Figure 1—figure supplement 2.
- https://cdn.elifesciences.org/articles/99785/elife-99785-fig1-figsupp2-data2-v1.zip
Figure 1—figure supplement 3
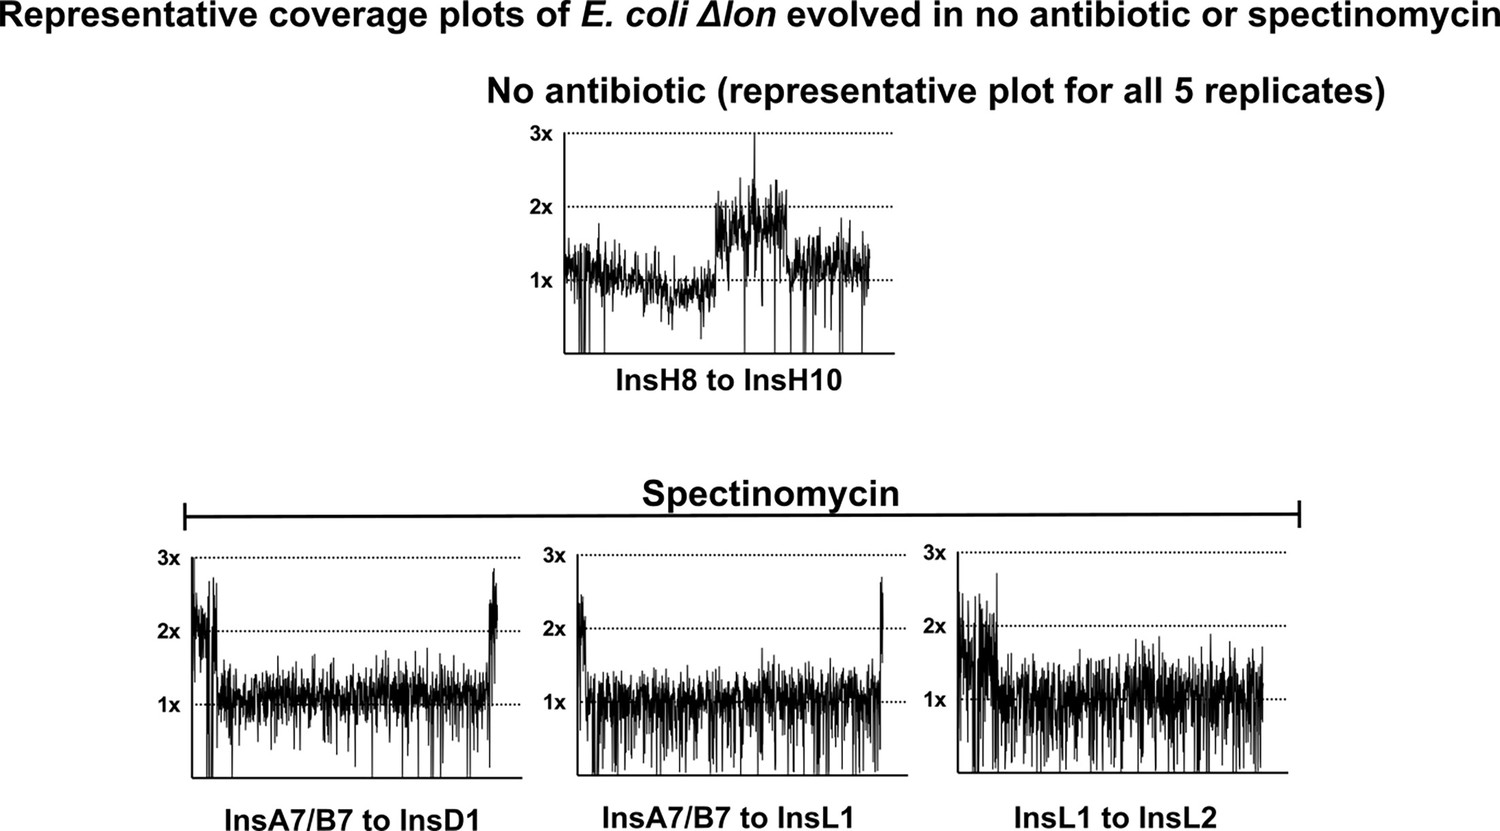
Coverage plots and flanking IS-elements for E. coli Δlon populations evolving in no antibiotic or spectinomycin that showed gene duplication and amplification (GDA) mutations.
For no antibiotic, only one of the five replicates is shown as similar coverage plots were obtained for all five replicates.
Figure 2 with 1 supplement
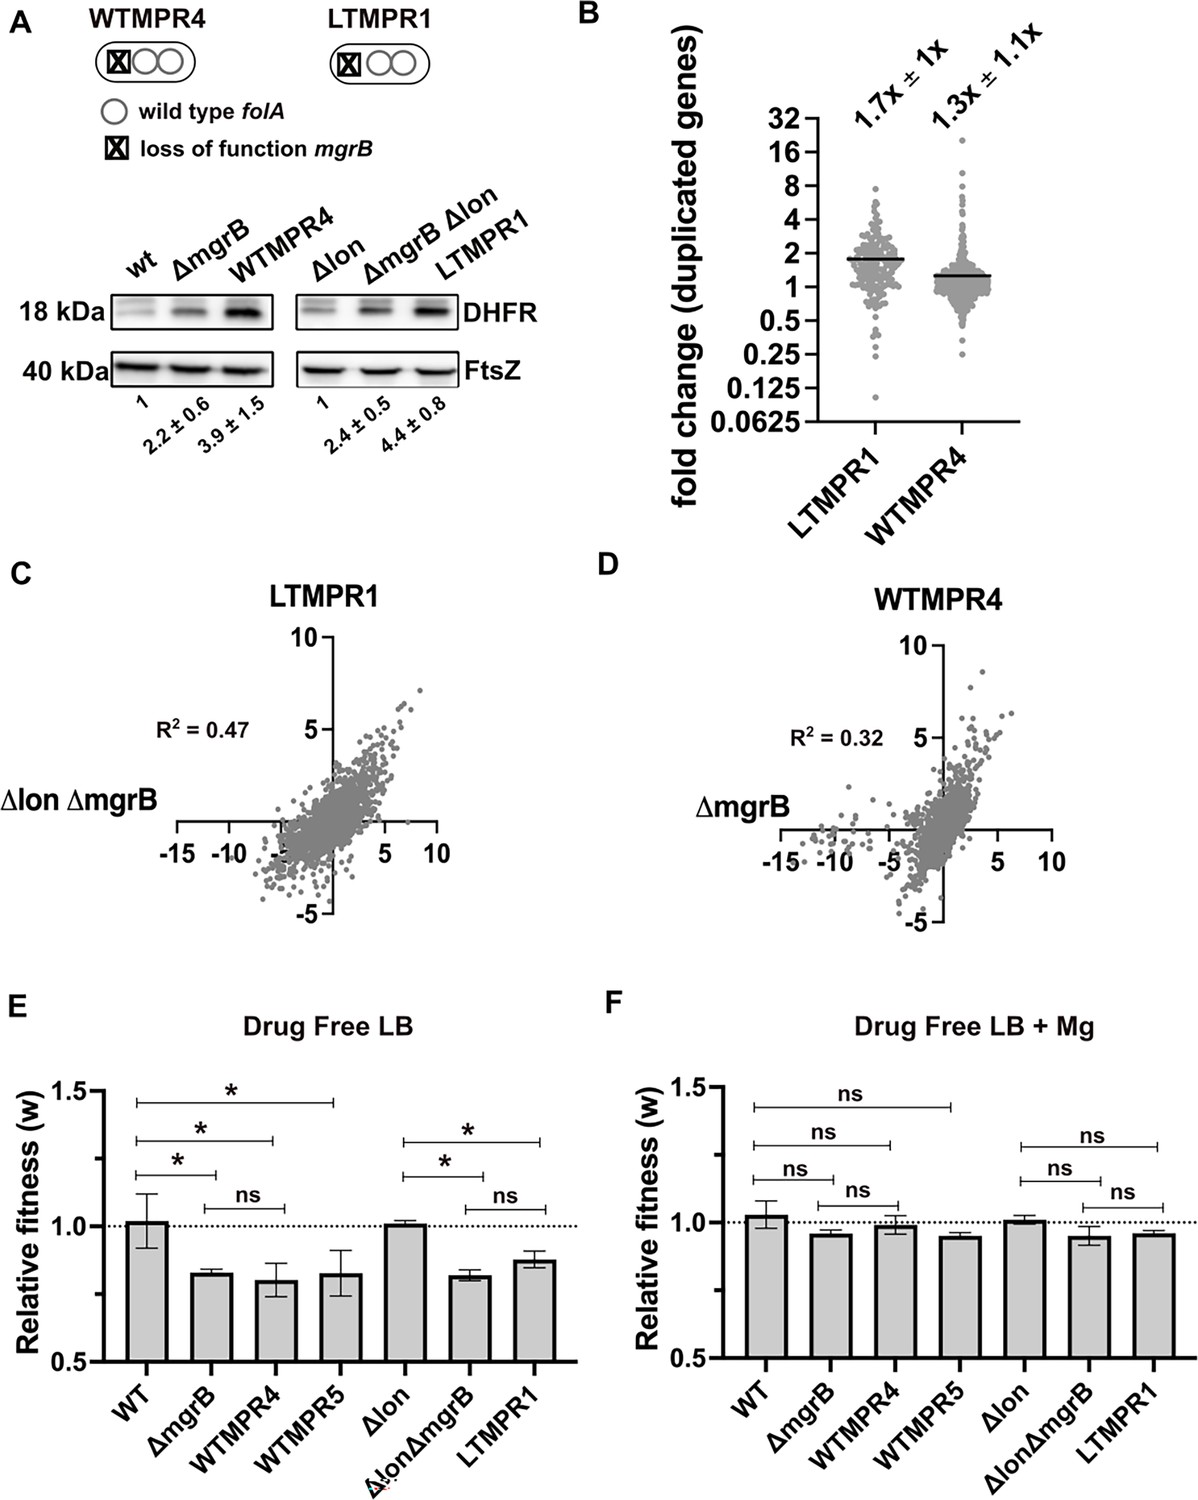
Overexpression of dihydrofolate reductase (DHFR) in trimethoprim-resistant isolates with genomic duplication.
(A) DHFR protein expression in trimethoprim-resistant isolates WTMPR4 and LTMPR1, compared with respective ancestors and mgrB-knockout strains. DHFR protein was detected by immunoblotting using an anti-DHFR polyclonal antibody. FtsZ was used as loading control. A representative immunoblot from three biological replicates is shown. Quantitation was performed by calculating band intensities using image analysis. Fold change values of DHFR levels over controls (wild-type or E. coli Δlon, set to 1) are shown as mean ± SD from triplicate measurements. Alleles of mgrB and folA in WTMPR4 and LTMPR1 are shown diagrammatically. (B) Expression level of duplicated genes in LTMPR1 and WTMPR4, determined by RNA-sequencing, expressed as fold over E. coli ΔlonΔmgrB and E. coli ΔmgrB, respectively. Each point represents fold change value for a single gene. Mean of the scatter is shown as a black line, and its value is provided along with standard deviation above the plot. (C, D) Correlation between expression levels of genes in LTMPR1 (C) and WTMPR4 (D) with E. coli ΔlonΔmgrB and E. coli ΔmgrB, respectively. Gene expression levels were estimated using RNA-sequencing and fold changes were calculated using wild-type E. coli as reference for WTMPR4 and E. coli ΔmgrB, and E. coli Δlon as reference for LTMPR1 and E. coli ΔlonΔmgrB. Each point represents log2(fold change) value for a single gene. The resulting scatter was fit to a simple linear regression and the obtained R2 values are provided. (E, F) Relative fitness (w) of indicated E. coli strains calculated using competition experiments with E. coli ΔlacZ as reference in the absence (E) or presence (F) of 10 mM MgSO4. Presence of high concentration of Mg2+ alleviates the fitness cost of mgrB mutations by inhibiting the PhoQP system (Vinchhi et al., 2023). For strains derived from E. coli Δlon, E. coli ΔlonΔlacZ was used as reference. Neutrality of ΔlacZ was established by competition with the unmarked ancestral strains, i.e., wild-type (WT) and E. coli Δlon. No change in relative fitness compared to the reference strain (w=1) is indicated by a dotted line. Mean ± SD from three independent measurements are plotted. Statistical significance was tested using an unpaired t-test and a p-value of <0.5 was considered statistically significantly different (*). A p-value≥0.5 was considered not significantly different (ns).
-
Figure 2—source data 1
Annotated image files for western blots in Figure 2A.
- https://cdn.elifesciences.org/articles/99785/elife-99785-fig2-data1-v1.zip
-
Figure 2—source data 2
Raw image files for western blots in Figure 2A.
- https://cdn.elifesciences.org/articles/99785/elife-99785-fig2-data2-v1.zip
Figure 2—figure supplement 1
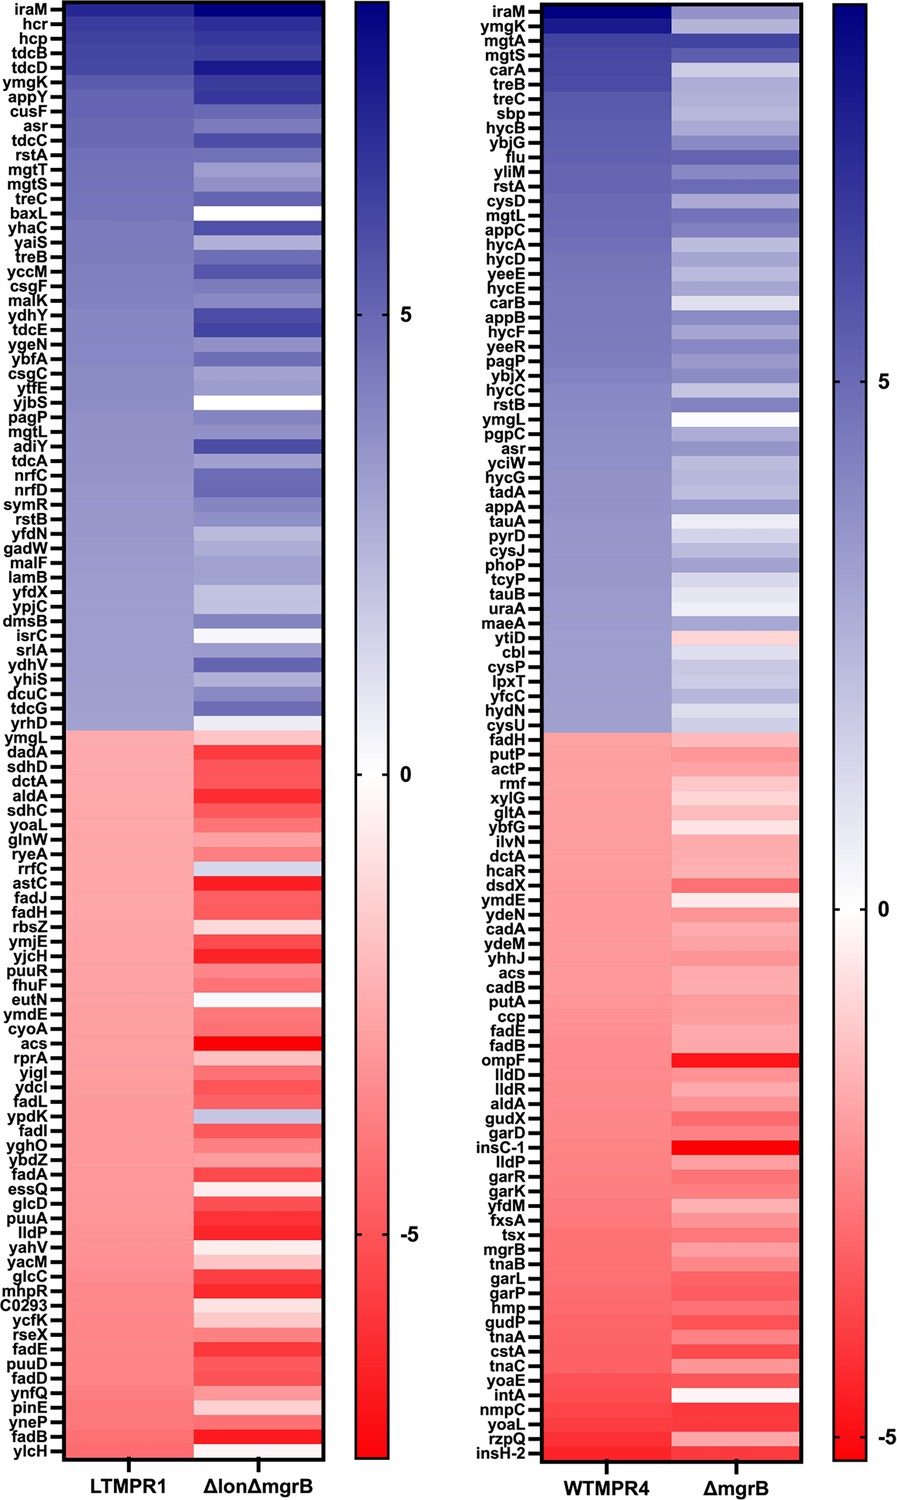
Gene expression changes associated with folA-encompassing duplication.
Heat map comparing the top 50 up/downregulated genes in LTMPR1 and WTMPR4 with E. coli ΔlonΔmgrB and E. coli ΔmgrB, respectively. Log2(fold change) values were calculated based on RNA-sequencing with respect to wild-type or Δlon E. coli and represented on a green/red scale as indicated. Gene names are shown adjacent to the appropriate cell. Genes are ranked according to their fold change in LTMPR1 and WTMPR4.
Figure 3 with 1 supplement
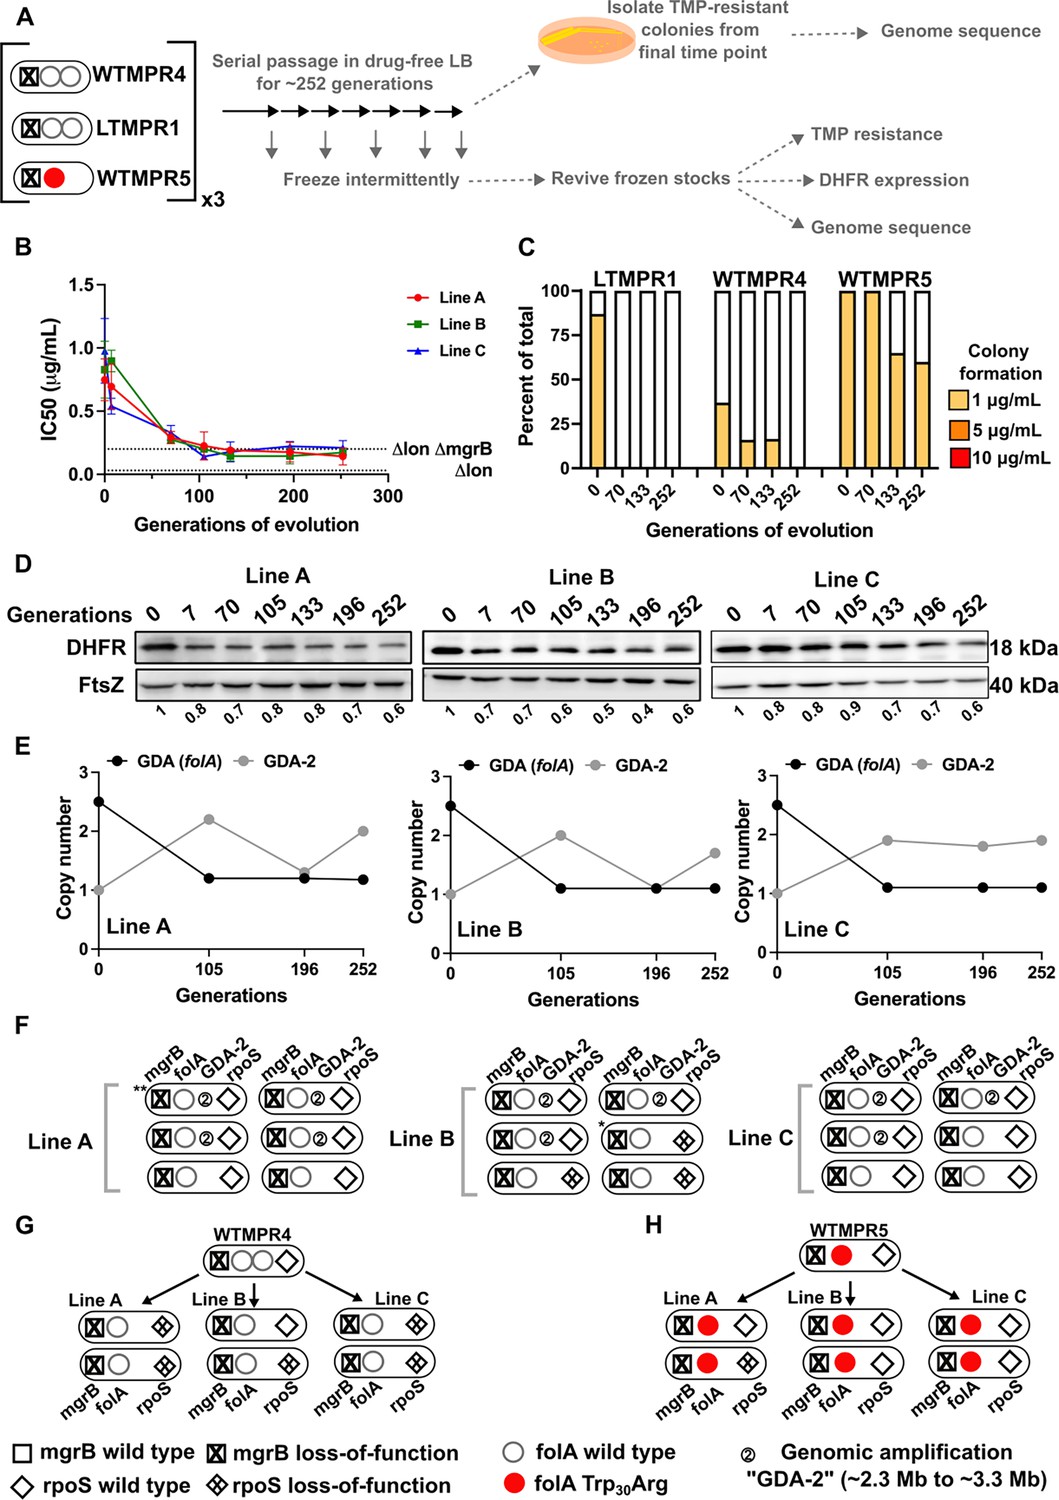
Evolutionary fate of folA duplication in the absence of drug pressure.
(A) Schematic of the experimental pipeline used to investigate the impact of evolution in drug-free media on resistance level, folA copy number, and expression level of different trimethoprim-resistant E. coli populations. (B) Trimethoprim inhibitory concentration 50 (IC50) values of three evolving lineages derived from LTMPR1 (A, B, C) over 252 generations of evolution in antibiotic-free medium. Mean ± SD from three measurements are plotted at each time point. IC50 values of E. coli Δlon and ΔlonΔmgrB are shown as dotted lines for reference. (C) Colony formation of LTMPR1, WTMPR4, and WTMPR5 evolved in antibiotic-free medium at different generations. Fraction of the population capable of forming colonies at 1, 5, and 10 μg/mL trimethoprim was calculated across three replicate lines. Mean value from the three lines is plotted. The results of similar experiments performed on ancestors (0 generations) are also provided for reference. (D) Dihydrofolate reductase (DHFR) expression during evolution in the absence of trimethoprim in LTMPR1 lineages A, B, and C, measured by immunoblotting using anti-DHFR polyclonal antibody. FtsZ was used as a loading control. Quantitation was performed by calculating band intensities using image analysis. DHFR expression at each time point was normalised to the ancestor (i.e. 0 generations, set to 1). Mean of three independent measurements is shown below each lane. (E) Copy number of the ancestral gene duplication and amplification (GDA) encompassing folA (GDA(folA)) and GDA-2 at different time points of evolution in the absence of trimethoprim are plotted. For GDA(folA), copy number was determined by dividing number of reads from an Illumina sequencing experiment corresponding to folA by the average number of reads mapping to the rest of the genome. (F) Point mutations in folA, rpoS, and mgrB and the ‘GDA-2’ genomic duplication in six randomly picked colonies from each of the LTMPR1 lines at 252 generations of evolution are shown schematically using the appropriate symbols. Asterisk (*/**) marks the genotypes that were carried forward for further analyses. (G, H) Point mutations in folA, mgrB, and rpoS in isolates derived from 252 generations of evolution of WTMPR4 (G) and WTMPR5 (H) in no antibiotic. From each of the evolving lines three random isolates were picked for genome sequencing. Various point mutants at the three gene loci of interest are represented by appropriate symbols as shown in the legend.
-
Figure 3—source data 1
Annotated image file for western blots in Figure 3D.
- https://cdn.elifesciences.org/articles/99785/elife-99785-fig3-data1-v1.zip
-
Figure 3—source data 2
Raw image file for western blots in Figure 3D.
- https://cdn.elifesciences.org/articles/99785/elife-99785-fig3-data2-v1.zip
Figure 3—figure supplement 1
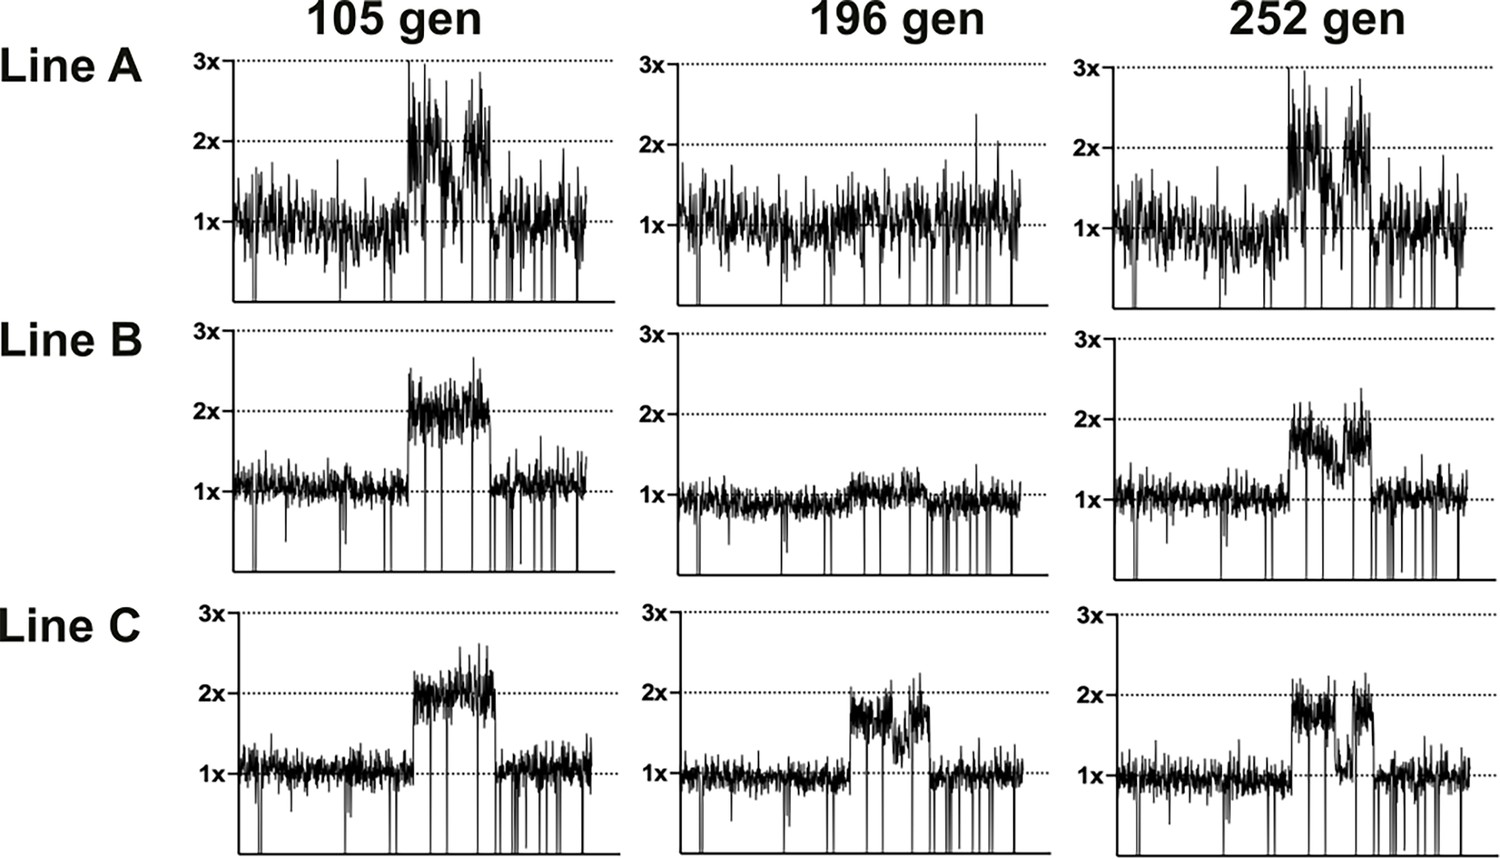
Coverage depth plots for population sequencing at 105, 196, and 252 generations of the three lineages of LTMPR1 (A, B, C) evolving in trimethoprim-free media.
Coverage depth plots show the number of reads from Illumina sequencing (y-axis) mapped to each genomic coordinate of the reference genome (x-axis). Coverage of 1×, 2×, and 3× are marked by dotted lines for reference.
Figure 4
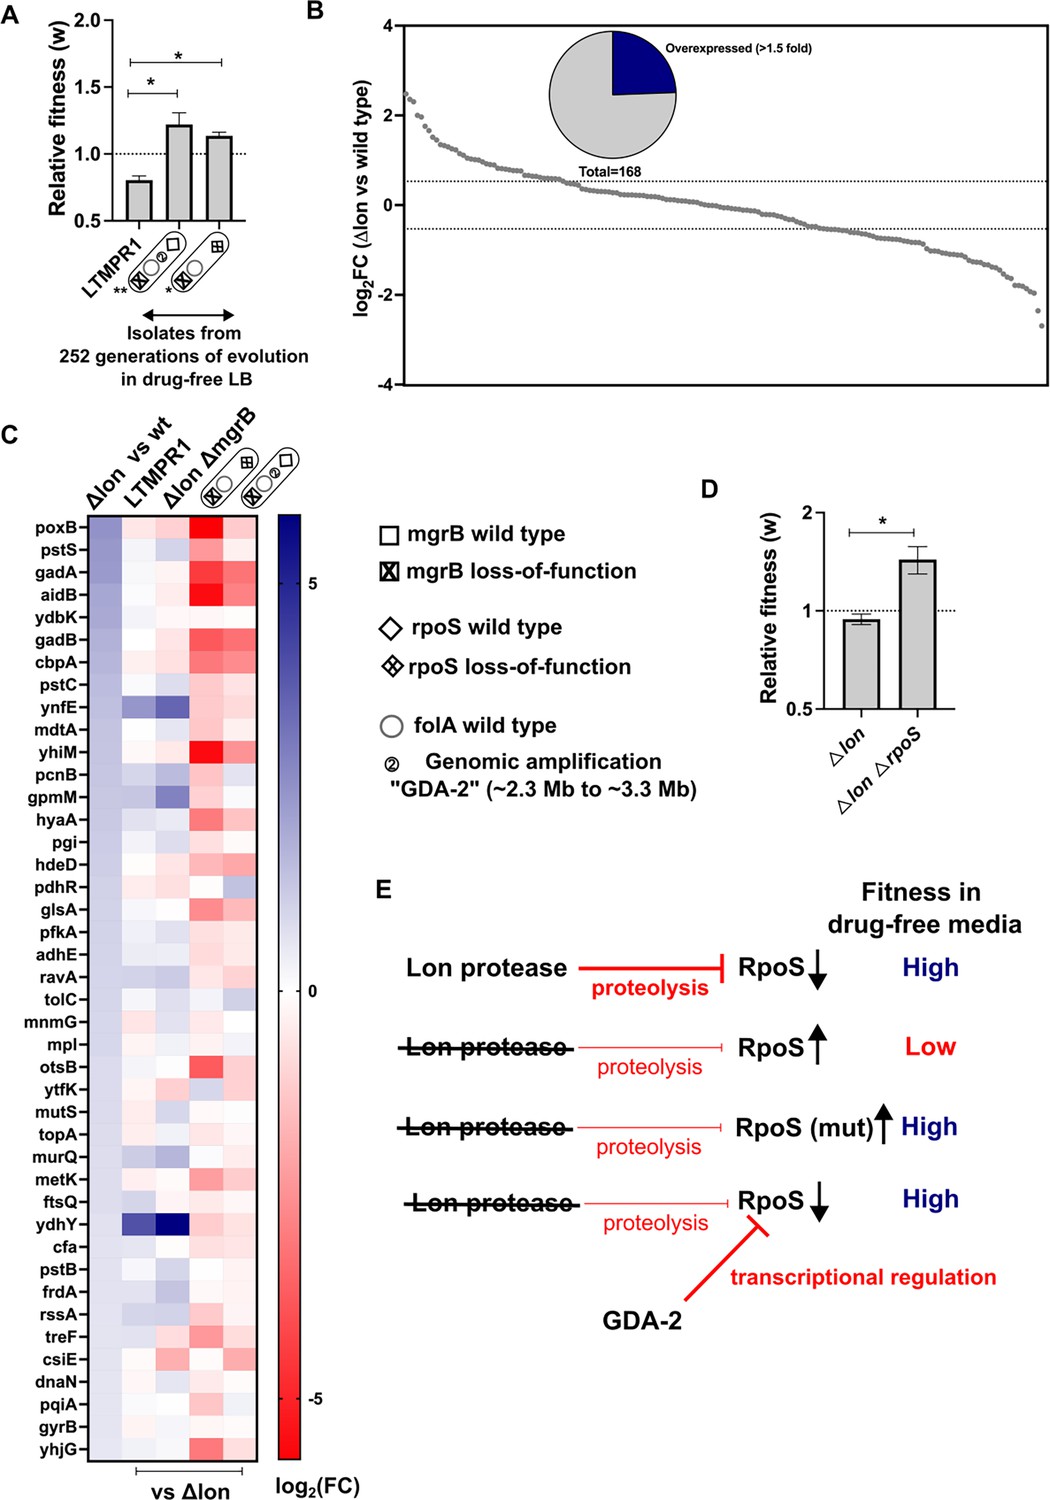
Lower RpoS activity leads to fitness enhancement of LTMPR1 in drug-free media.
(A) Relative fitness (w) of isolates with the indicated genotypes derived from LTMPR1 evolution in antibiotic-free media (see also Figure 3) calculated using a competitive growth assay using E. coli ΔlonΔlacZ as the reference strain. Mean ± SD from three independent measurements are plotted. No change in relative fitness compared to the reference (w=1) is shown as a dotted line for reference. Statistical significance was tested using an unpaired t-test. A p-value of <0.05 was considered as a statistically significant difference (*). (B) Expression level of 168 known targets of RpoS in E. coli Δlon compared to wild-type expressed as log2(fold change) values determined by RNA-sequencing. Dotted lines at 1.5-fold higher and lower than wild-type represent cutoffs used to identify overexpressed and underexpressed genes. The pie chart shows the fraction of RpoS targets that were overexpressed in E. coli Δlon by at least 1.5-fold. (C) Expression levels of 41 deregulated RpoS targets in E. coli Δlon compared to wild-type are shown as a heat map in the first vertical. The expression levels of these genes in LTMPR1, E. coli ΔlonΔmgrB, or LTMPR1-derived isolates compared to E. coli Δlon are provided in the subsequent verticals. (D) Relative fitness of E. coli ΔlonΔrpoS in antibiotic-free media calculated using a competitive growth assay using E. coli ΔlonΔlacZ as the reference strain. Neutrality of the ΔlacZ genetic marker was verified by competition between E. coli Δlon and E. coli ΔlonΔlacZ. Mean ± SD from three independent measurements are plotted. No change in relative fitness compared to the reference (w=1) is shown as a dotted line for reference. Statistical significance was tested using an unpaired t-test. A p-value of <0.5 was considered as a statistically significant difference (*). (E) Model for the effects of Lon deficiency on RpoS levels and bacterial fitness. The roles of mutations within RpoS or the gene duplication and amplification (GDA)-2 mutation in compensating for the defects of RpoS overproduction are shown.
Figure 5 with 2 supplements
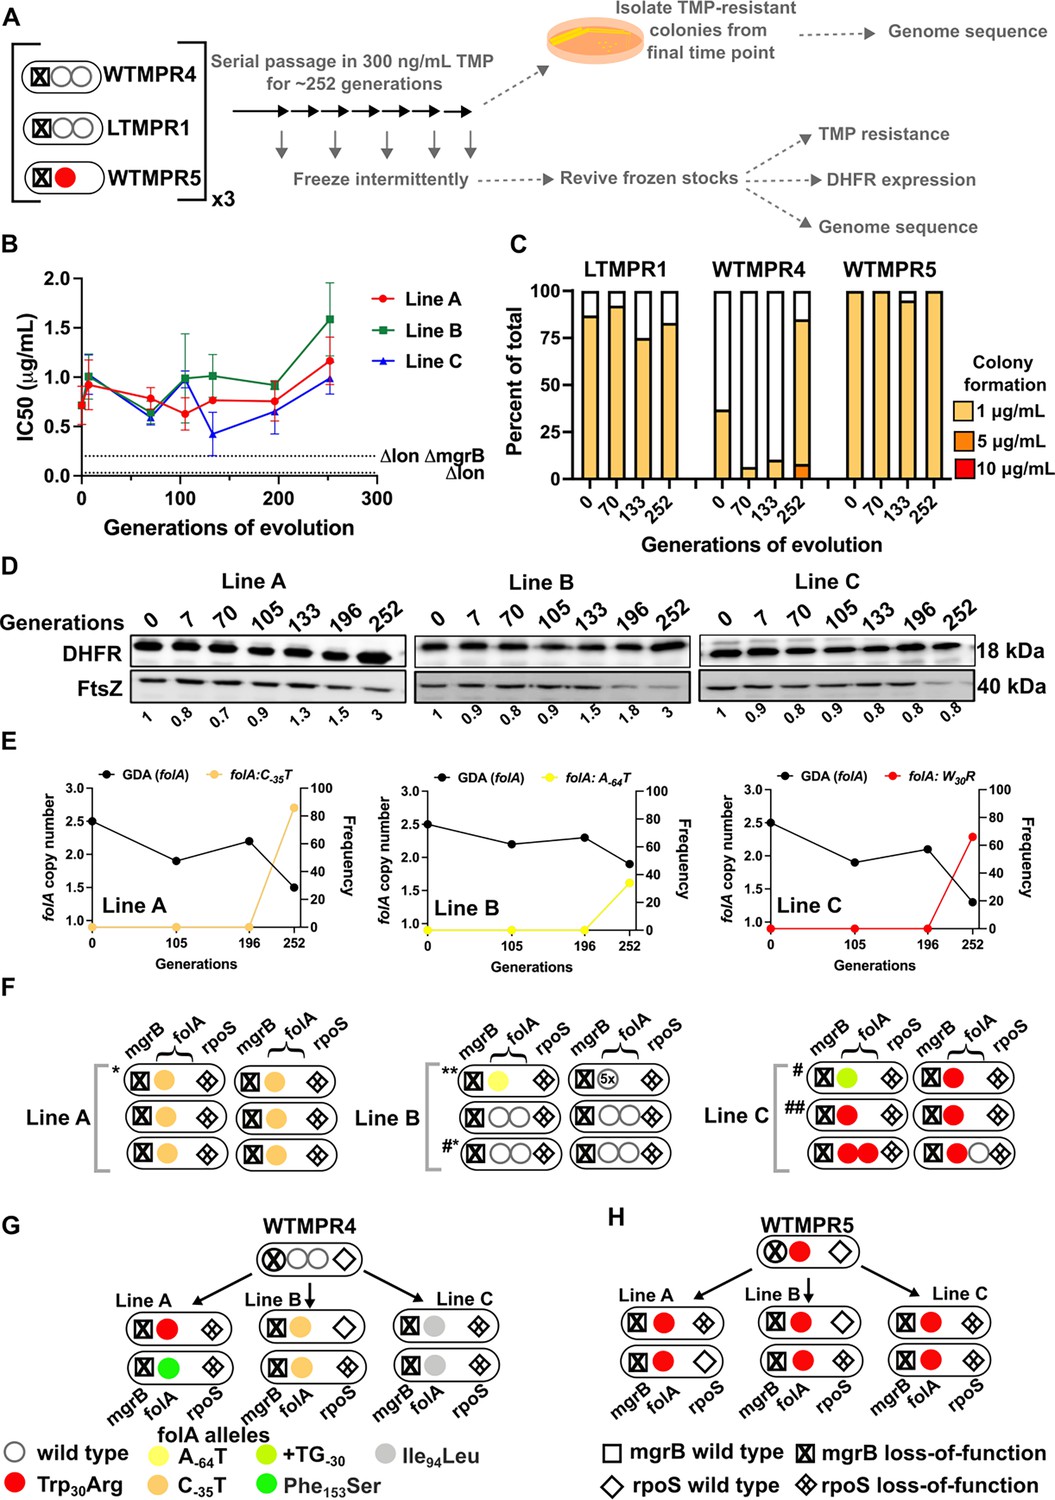
Evolutionary fate of folA-encompassing gene duplication and amplification (GDA) in LTMPR1 at sustained trimethoprim pressure.
(A) Schematic of the experimental pipeline used to investigate the impact of evolution in constant drug pressure on resistance level, folA copy number, point mutations in folA, and expression level of different trimethoprim-resistant E. coli populations. (B) Trimethoprim inhibitory concentration 50 (IC50) values of three evolving lineages starting from LTMPR1 (A, B, C) over 252 generations of evolution at 300 ng/mL trimethoprim. Mean ± SD from three measurements are plotted at each time point. IC50 values of E. coli Δlon and ΔlonΔmgrB are shown as dotted lines for reference. (C) Colony formation of LTMPR1, WTMPR4, and WTMPR5 evolved in 300 ng/mL trimethoprim at indicated time points. Fraction of the population capable of forming colonies at 1, 5, and 10 μg/mL trimethoprim was calculated across three replicate lines. Mean value from the three lines is plotted. The results of similar experiments performed on ancestors (0 generations) are also provided for reference. (D) Dihydrofolate reductase (DHFR) expression in LTMPR1 lineages (A, B, and C) evolved in 300 ng/mL trimethoprim, measured by immunoblotting using anti-DHFR polyclonal antibody. FtsZ was used as a loading control. Quantitation was performed by calculating band intensities using image analysis. DHFR expression at each time point was normalised to the ancestor (i.e. 0 generations, set to 1). Mean of three independent measurements is shown below each lane. (E) Copy number of folA (GDA(folA)) at different time points of evolution of LTMPR1 in trimethoprim is plotted on the left y-axis. Copy number was determined by dividing number of reads from an Illumina sequencing experiment corresponding to folA by the average number of reads mapping to the rest of the genome. Frequency of various folA alleles in the evolving populations at each of the time points is plotted on the right y-axis. (F) Point mutations in folA, rpoS, and mgrB in six randomly picked trimethoprim-resistant colonies from each of the LTMPR1 lines at 252 generations of evolution are shown diagrammatically. Genotypes that were carried forward for further analysis are marked * or #. (G, H) Point mutations in folA, mgrB, and rpoS in isolates derived from 252 generations of evolution of WTMPR4 (G) and WTMPR5 (H) in 300 ng/mL of trimethoprim. From each of the evolving lineages two random isolates were picked for genome sequencing. Various point mutants at the three gene loci are represented by appropriate symbols as shown in the legend.
-
Figure 5—source data 1
Annotated image file for western blots in Figure 5D.
- https://cdn.elifesciences.org/articles/99785/elife-99785-fig5-data1-v1.zip
-
Figure 5—source data 2
Raw image file for western blots in Figure 5D.
- https://cdn.elifesciences.org/articles/99785/elife-99785-fig5-data2-v1.zip
Figure 5—figure supplement 1
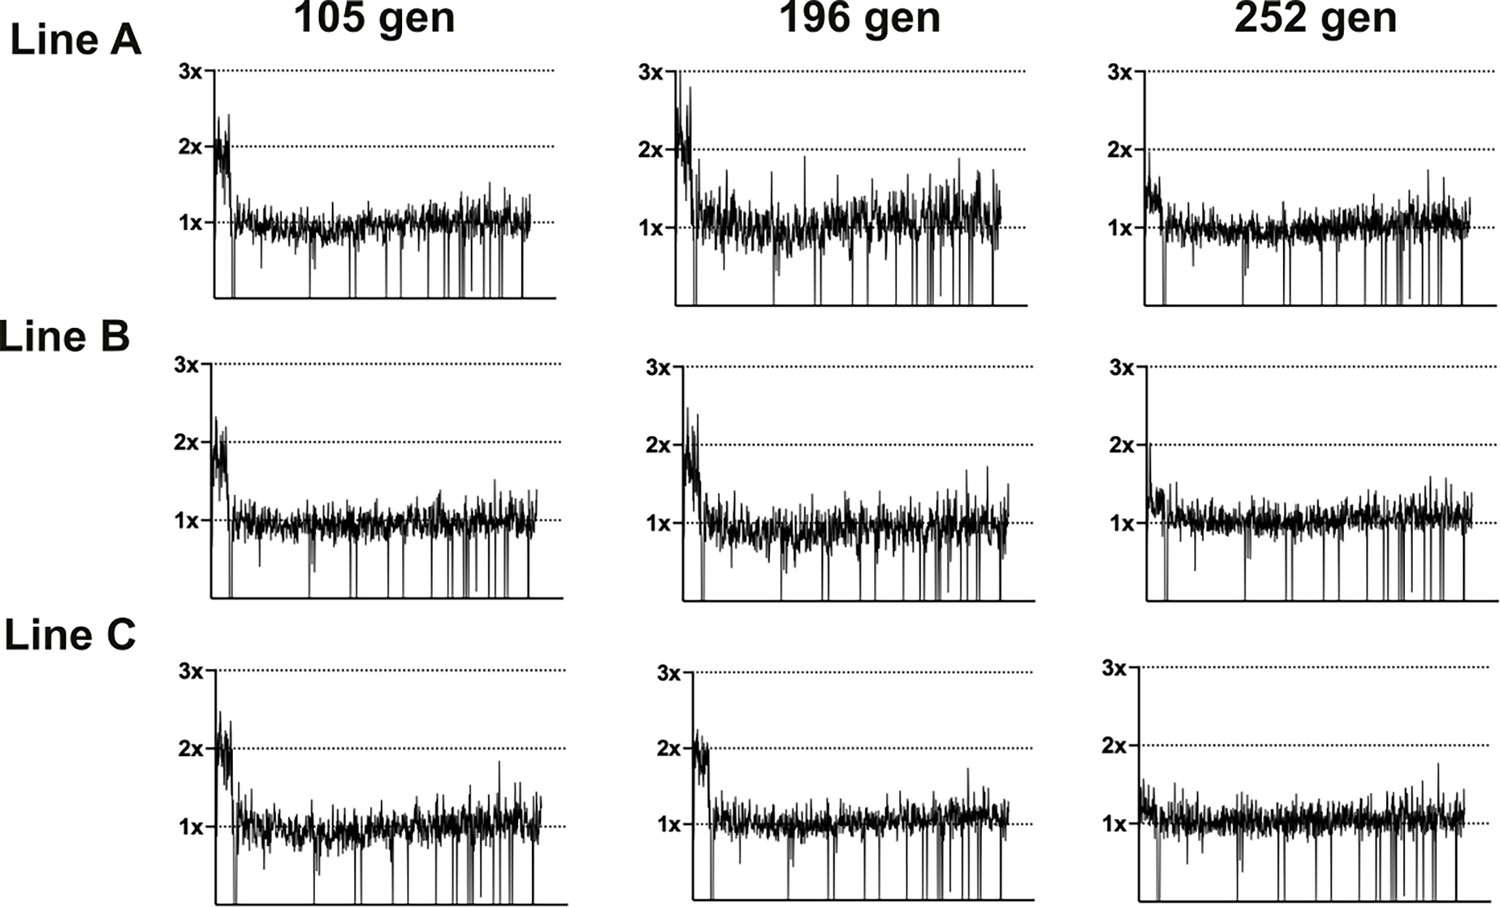
Coverage depth plots for population sequencing at 105, 196, and 252 generations of the three lineages of LTMPR1 (A, B, C) evolving in trimethoprim-supplemented (300 ng/mL) media.
Coverage depth plots show the number of reads from Illumina sequencing (y-axis mapped) to each genomic coordinate of the reference genome (x-axis). Coverage of 1×, 2×, and 3× are marked by dotted lines for reference.
Figure 5—figure supplement 2
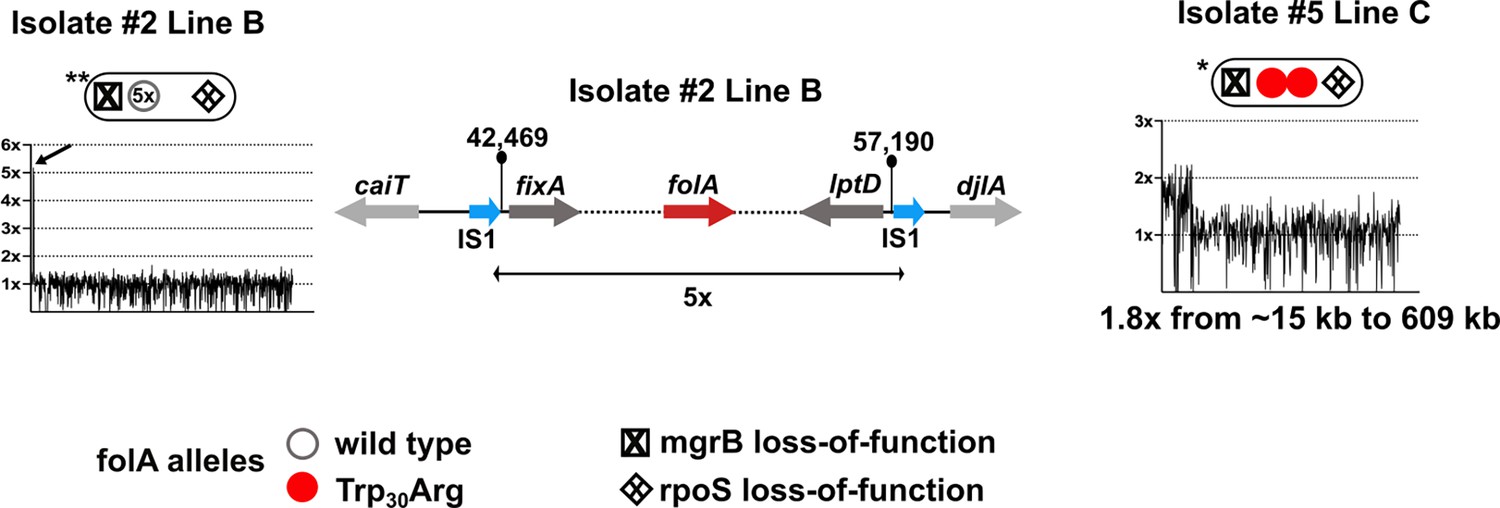
Coverage plots for Line C Isolate 5 and Line B Isolate 2.
Line B Isolate 3 showed 5× amplification of a shorter genomic stretch encompassing folA (marked with an arrow) which is shown diagrammatically next to the coverage plot. Line C Isolate 5 showed an expanded gene duplication and amplification (GDA) encompassing folA compared to the LTMPR1 ancestor, the coordinates for which are below the coverage plot.
Figure 6
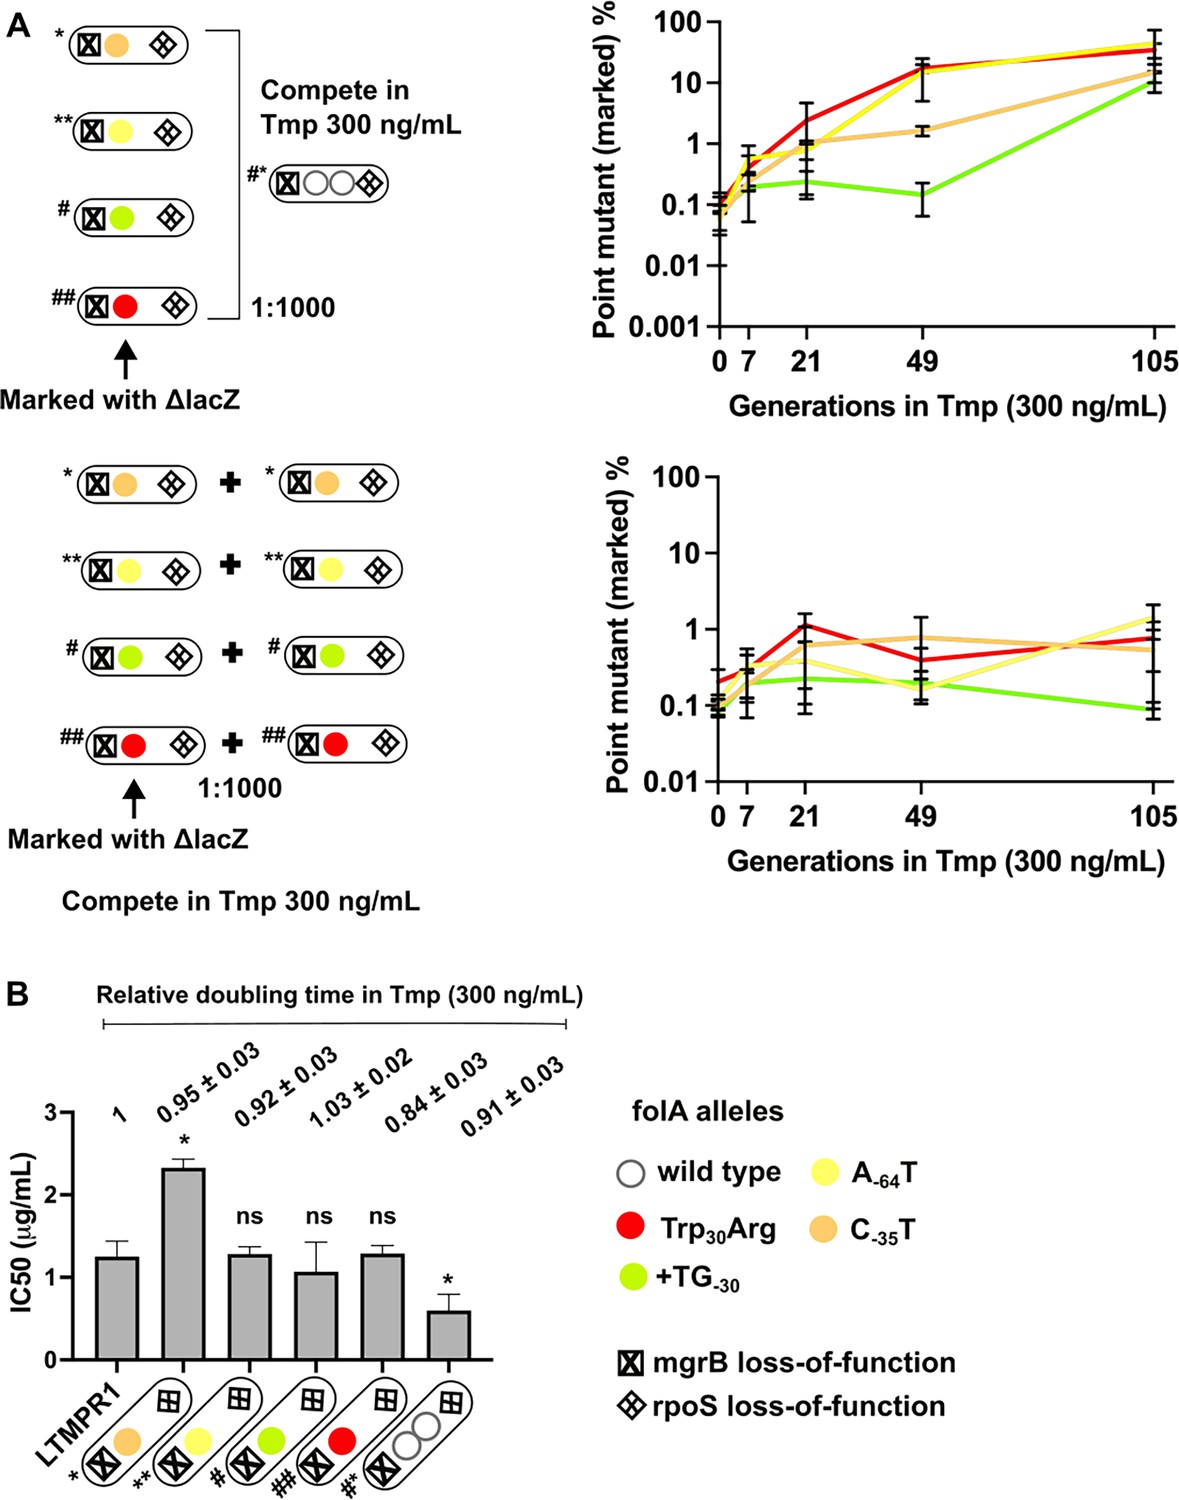
Invasion of gene duplication and amplification (GDA)-dominant populations by point mutations under trimethoprim pressure.
(A) Competition between isolates with point mutations in folA and an isolate that harboured a folA duplication derived from the same time point of LTMPR1 evolution (upper panel). The genotypes of the isolates (i.e. alleles at mgrB, folA, and rpoS loci) used are shown diagrammatically (see also Figure 5, Supplementary file 4). The initial mixing ratio was 1000:1 in favour of the GDA mutant. Point mutants were marked genetically with ΔlacZ::Cat. Neutrality of the ΔlacZ::Cat marker was verified by competing marked and unmarked point mutants (lower panel). Percentage of the population constituted by the marked point mutants over ~105 generations of serial transfer in media supplemented with trimethoprim (300 ng/mL) is plotted. Mean ± SD from three replicates are plotted and traces for individual mutants are appropriately coloured. (B) Trimethoprim inhibitory concentration 50 (IC50) values of the LTMPR1 ancestor or evolved isolates from 252 generations in trimethoprim with indicated genotypes (see also Figure 5, Supplementary file 4) are plotted as bars. Mean ± SD from three independent measurements are plotted. Statistical significance was tested using an unpaired t-test and LTMPR1 was used as the reference. A p-value<0.05 was considered significantly different (*) while ≥0.5 was considered not statistically significant (ns). Doubling times relative to LTMPR1 (set to 1) in the presence of 300 ng/mL of trimethoprim are provided above the graph as mean ± SD from three independent measurements.
Figure 7 with 1 supplement
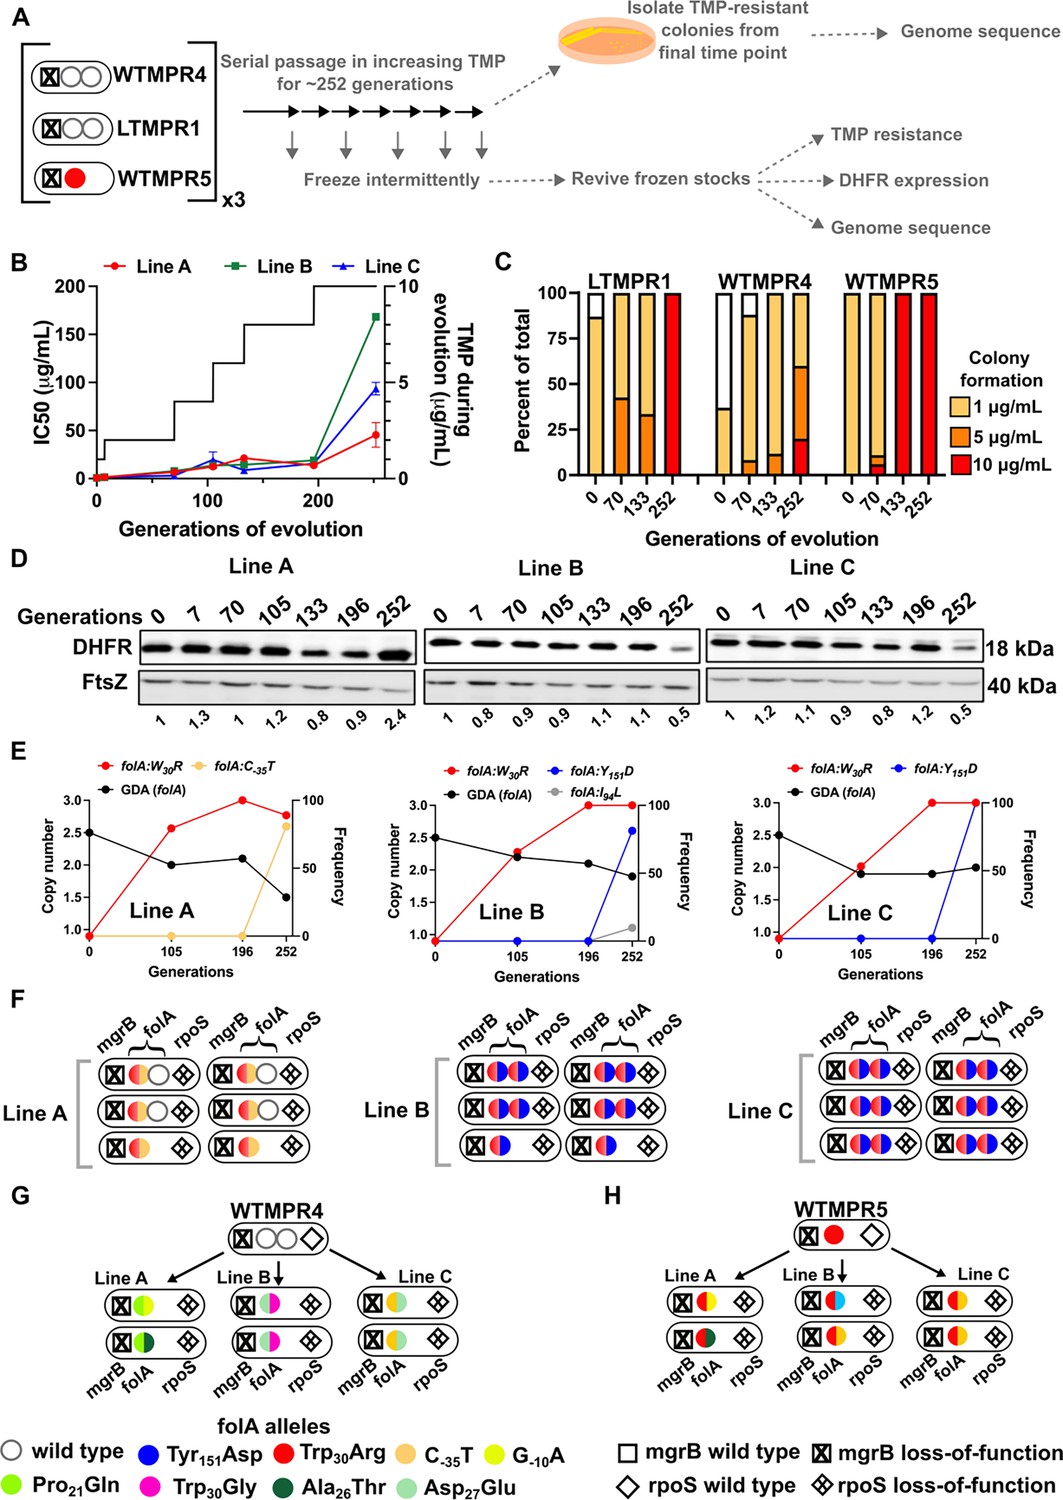
Evolutionary fate of folA-encompassing gene duplication and amplification (GDA) in LTMPR1 at increasing trimethoprim pressure.
(A) Schematic of the experimental pipeline used to investigate the impact of evolution in increasing drug pressure on resistance level, folA copy number, point mutations in folA, and expression level of different trimethoprim-resistant E. coli populations. (B) Trimethoprim inhibitory concentration 50 (IC50) values of three evolving lineages starting from LTMPR1 (A, B, C) over 252 generations of evolution are plotted on the left y-axis. Mean ± SD from three measurements are plotted at each time point. Trimethoprim concentrations used during evolution are plotted in the right y-axis. (C) Colony formation of LTMPR1, WTMPR4, and WTMPR5 evolved in increasing trimethoprim at indicated time points. Fraction of the population capable of forming colonies at 1, 5, and 10 μg/mL trimethoprim was calculated across three replicate lines. Mean value from the three lines is plotted. The results of similar experiments performed on ancestors (0 generations) are also provided for reference. (D) Dihydrofolate reductase (DHFR) expression in LTMPR1 lineages A, B, and C evolved in increasing trimethoprim, measured by immunoblotting using anti-DHFR polyclonal antibody. FtsZ was used as a loading control. Quantitation was performed by calculating band intensities using image analysis. DHFR expression at each time point was normalised to the ancestor (i.e. 0 generations, set to 1). Mean of three independent measurements is shown below each lane. (E) Copy number of folA (GDA(folA)) at different time points of LTMPR1 evolution in increasing trimethoprim is plotted on the left y-axis. Copy number was determined by dividing number of reads from an Illumina sequencing experiment corresponding to folA by the average number of reads mapping to the rest of the genome. Frequency of various folA alleles in the evolving LTMPR1 populations at each of the time points is shown on the right y-axis. (F) Point mutations in folA, rpoS, and mgrB in six randomly picked trimethoprim-resistant colonies from each of the LTMPR1 lines at 252 generations of evolution are shown schematically. (G, H) Point mutations in folA, mgrB, and rpoS in isolates derived from 252 generations of evolution of WTMPR4 (G) and WTMPR5 (H) in increasing trimethoprim. From each of the evolving lineages two random isolates were picked for genome sequencing. Various point mutants at the three gene loci are represented by appropriate symbols as shown in the legend.
-
Figure 7—source data 1
Annotated image file for western blots in Figure 7D.
- https://cdn.elifesciences.org/articles/99785/elife-99785-fig7-data1-v1.zip
-
Figure 7—source data 2
Raw image file for western blots in Figure 7D.
- https://cdn.elifesciences.org/articles/99785/elife-99785-fig7-data2-v1.zip
Figure 7—figure supplement 1
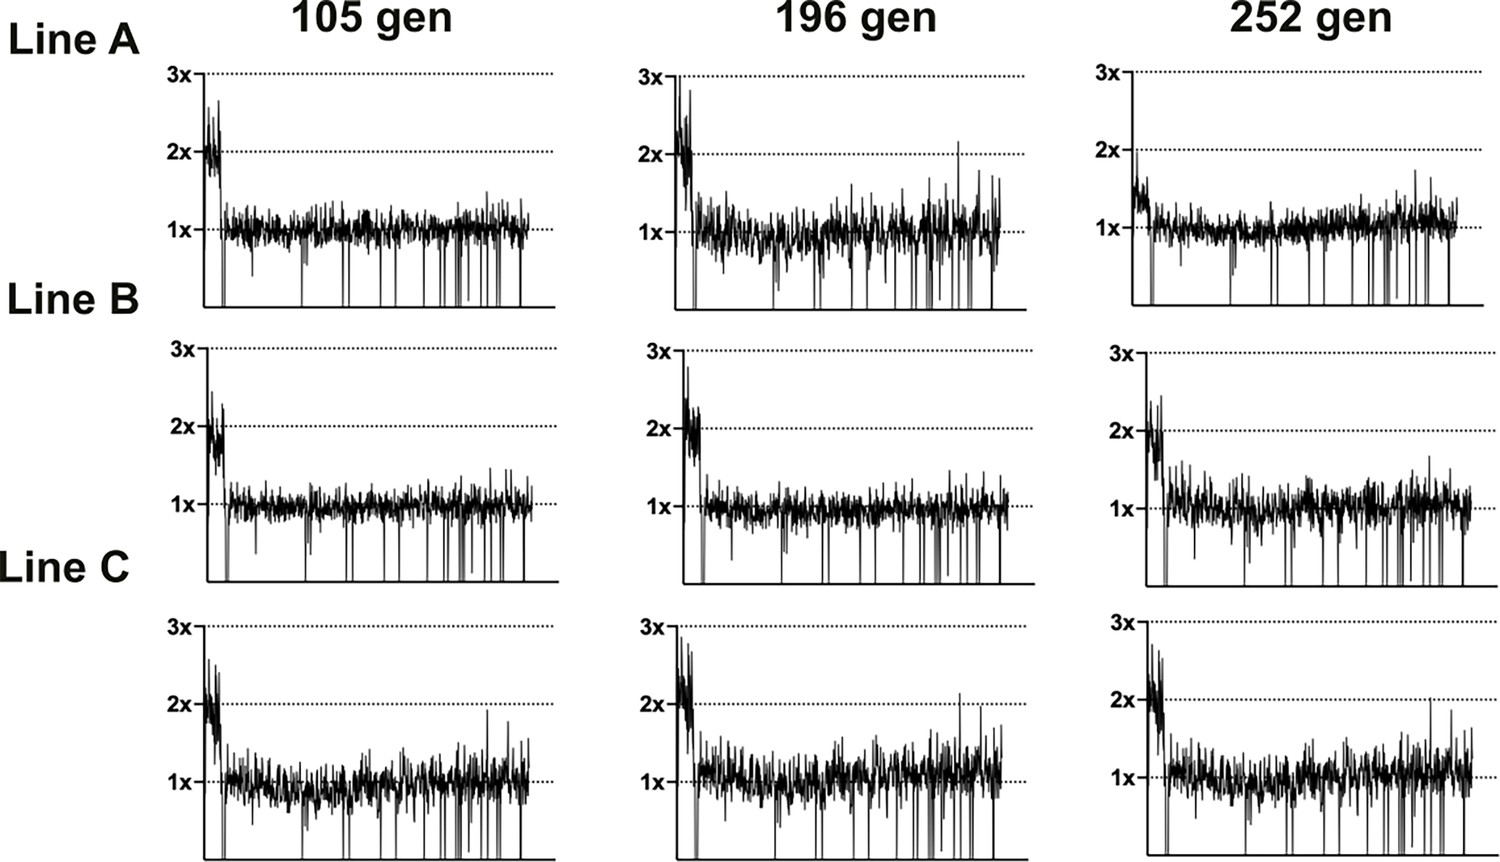
Coverage depth plots for population sequencing at 105, 196, and 252 generations of the three lineages of LTMPR1 (A, B, C) evolving in increasing trimethoprim concentrations.
Coverage depth plots show the number of reads from Illumina sequencing (y-axis) mapped to each genomic coordinate of the reference genome (x-axis). Coverage of 1×, 2×, and 3× are marked by dotted lines for reference.
Figure 8
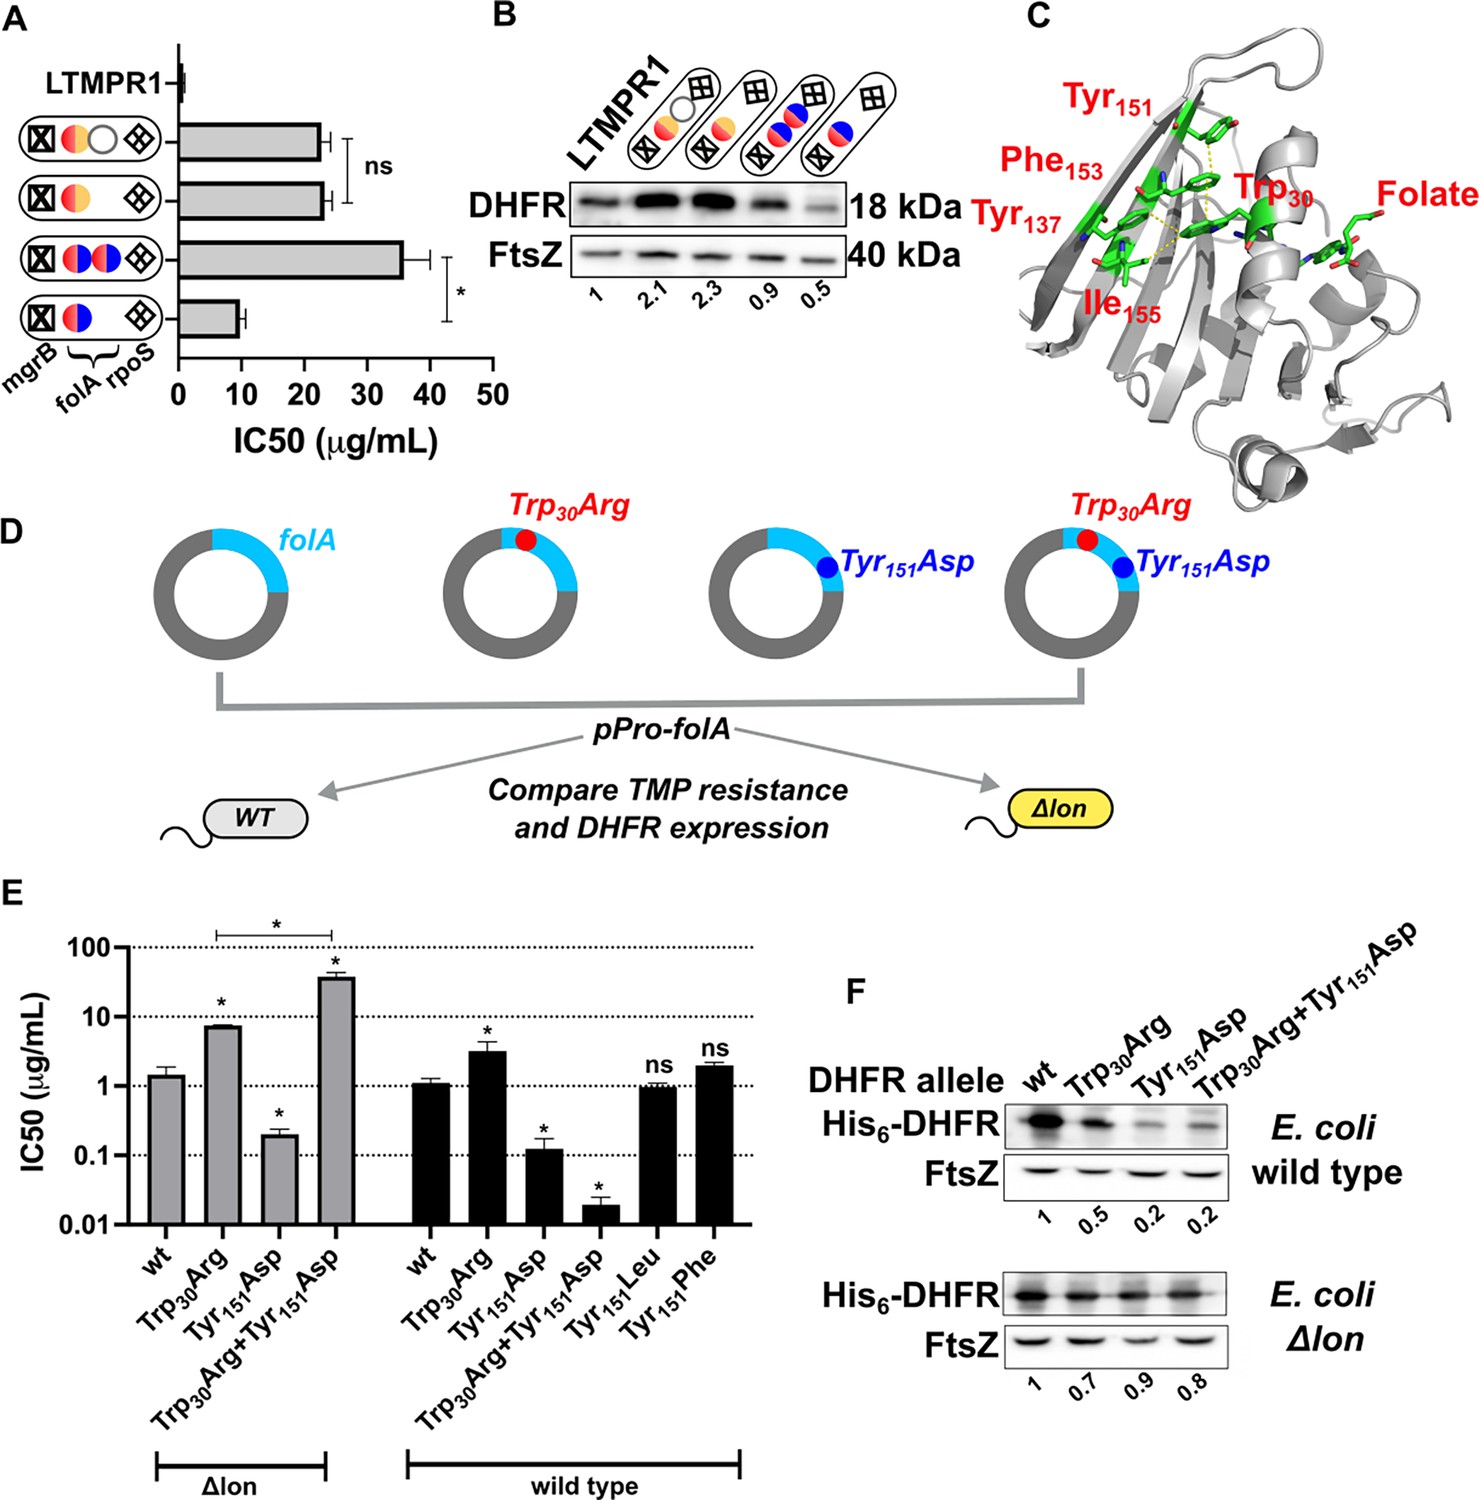
Proteostatic pressure facilitates maintenance of folA duplication.
(A) Trimethoprim inhibitory concentration 50 (IC50) values of resistant isolates with the indicated genotypes (see also Figure 7) derived from LTMPR1 evolution in increasing antibiotic pressure. Mean ± SD from three independent measurements are plotted. Statistical significance was tested using an unpaired t-test. A p-value of <0.05 was considered statistically significant (*). A p-value>0.05 was considered not statistically significant (ns). (B) Dihydrofolate reductase (DHFR) expression level in LTMPR1-derived trimethoprim-resistant isolates with indicated genotypes assessed by immunoblotting using anti-DHFR polyclonal antibody. FtsZ was used as a loading control. Quantitation was performed by calculating band intensities using image analysis. DHFR expression was normalised to the ancestor (LTMPR1). Mean of three independent measurements is provided. (C) Cartoon representation of the structure of E. coli DHFR (PDB: 7DFR) bound to folate. Residues Trp30, Tyr151, Phe153, and Ile155 which form hydrophobic interactions and are required for proteolytic stability are shown as sticks and coloured by element (C: green, O: red, N: blue). Distances of less than or equal to 4 Å, which indicates possible interactions, are shown as dotted yellow traces. Folate bound in the active site of DHFR is shown as sticks. (D) Schematic of the experiment used to test trimethoprim resistance and expression level of various DHFR mutants in E. coli wild-type (WT) or Δlon. (E) Trimethoprim IC50 values of E. coli wild-type or E. coli Δlon heterologously expressing DHFR (wt) or its mutants. Mean ± SD from three independent measurements are plotted. Statistical significance was tested using an unpaired t-test. Comparisons were between mutant and wild-type DHFR, unless otherwise indicated. A p-value of <0.05 was considered statistically significant (*). A p-value>0.05 was considered not statistically significant (ns). (F) Expression level of plasmid-borne DHFR (wt) or its mutants in wild-type or Δlon E. coli assessed by immunoblotting using anti-DHFR polyclonal antibody. FtsZ was used as a loading control. Quantitation was performed by calculating band intensities using image analysis. Expression of mutants was normalised to wild-type DHFR (set to 1). Mean of three independent measurements is shown.
-
Figure 8—source data 1
Annotated image file for western blots in Figure 8B and F.
- https://cdn.elifesciences.org/articles/99785/elife-99785-fig8-data1-v1.zip
-
Figure 8—source data 2
Raw image file for western blots in Figure 8B and F.
- https://cdn.elifesciences.org/articles/99785/elife-99785-fig8-data2-v1.zip
Figure 9
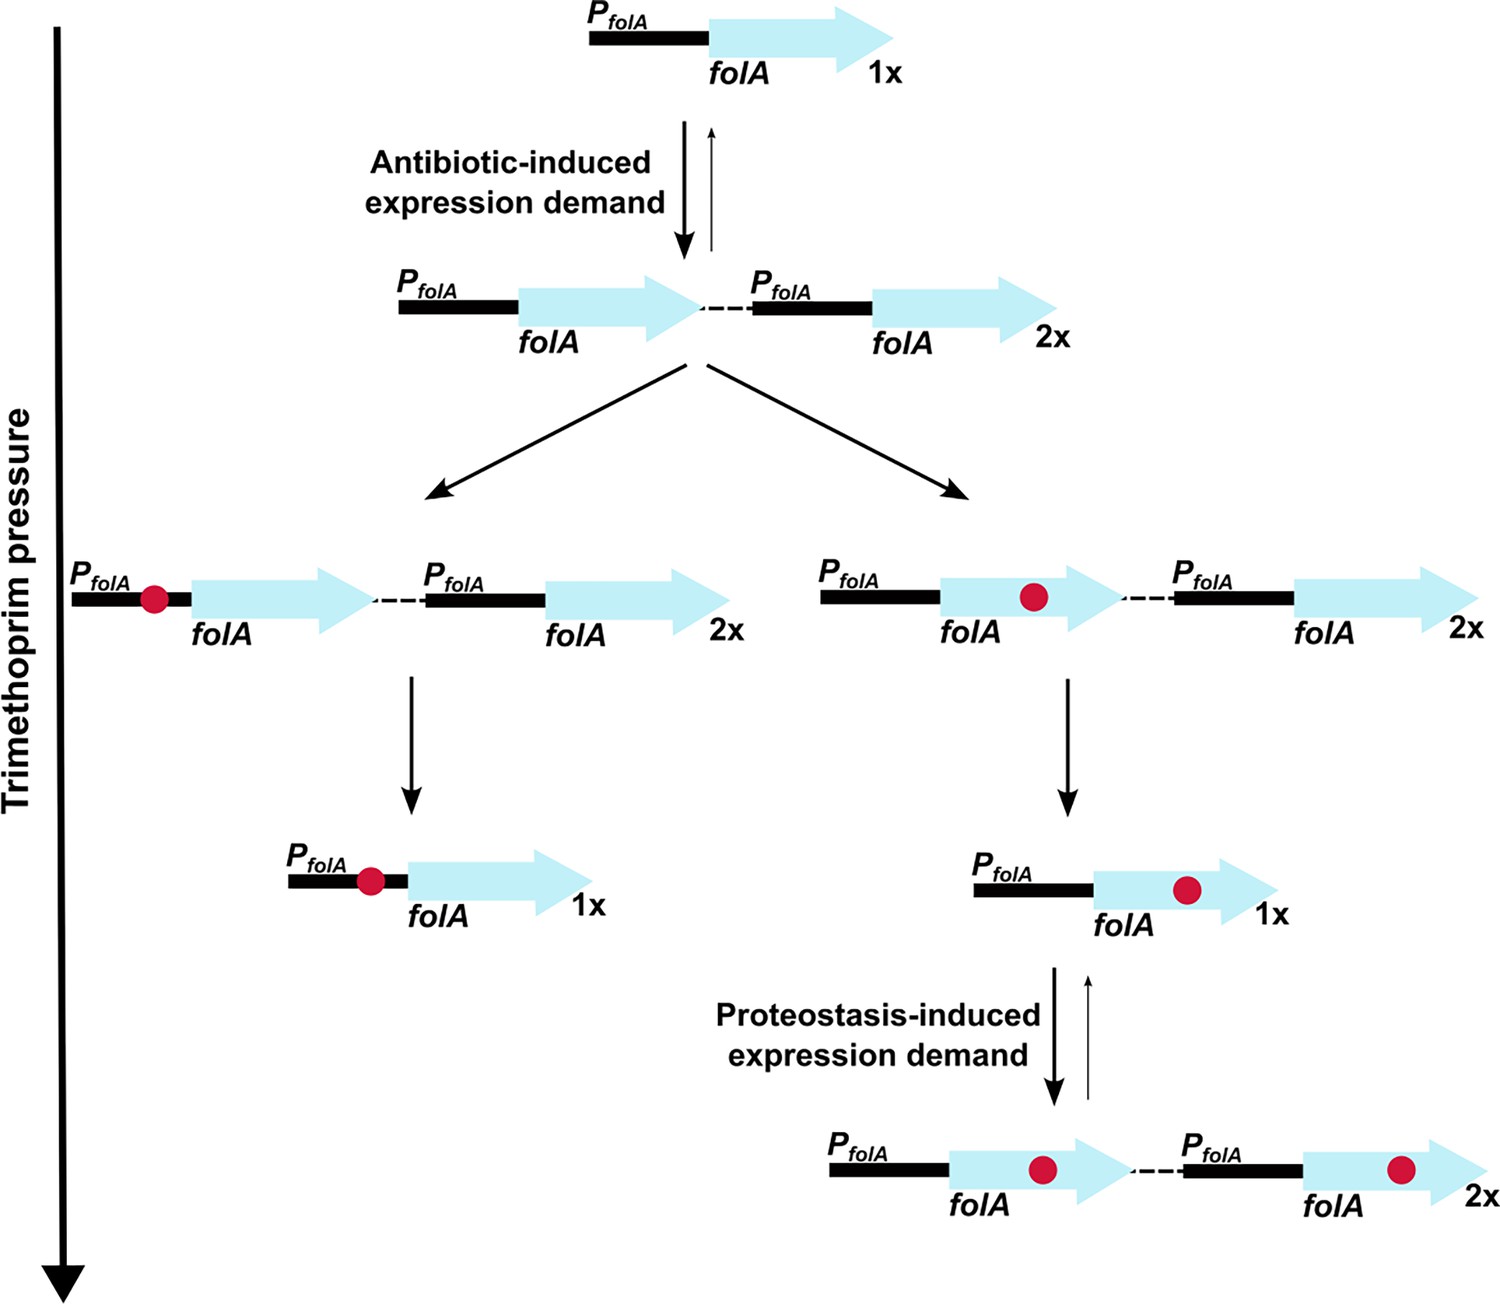
Model of expression demand induced selection of folA gene duplication, followed by replacement by phenotypically equivalent point mutants.
Expression demand for dihydrofolate reductase (DHFR) is generated by trimethoprim pressure, which results in the selection of folA gene duplications. Gene duplication is inherently unstable and reverses to a single copy of wild-type folA when drug pressure is withdrawn. Under drug pressure, folA gene duplication is maintained until a point mutation that confers resistance arises in one of the copies of folA (promoter or coding region). Upon acquisition of a point mutation, reversal of gene duplication ensues unless additional expression demand is generated by the action of proteostatic machinery on unstable drug-resistant DHFR mutants.
Tables
Table 1
Complete list of mutations identified in isolates LTMPR1–5.
| LTMPR1 | LTMPR2 | LTMPR3 | LTMPR4 | LTMPR5 | ||
|---|---|---|---|---|---|---|
| Gene/locus | Description | |||||
| mgrB | IS5 insertion at –46 | IS2 insertion at +82 | IS5 insertion at –36 | – | – | Negative feedback regulator of PhoQ sensor kinase |
| ybcK | – | IS2 insertion at +118 | – | – | – | Prophage recombinase |
| pitA | – | – | – | Ser425Pro | Deletion of 18 genes [yhiN, pitA… yhiS]. IS5-mediated | Metal/phosphate symporter |
| insH21 | Δ insH21 | Δ insH21 | Δ insH21 | Δ insH21 | Δ insH21 | IS5 transposase |
| GDA (encompassing folA) | 19,796–258,462 bp (~2.3×) | 15,445–609,177 bp (~1.6×) | 15,445–609,177 bp (~1.9×) | 15,445–609,177 bp (~1.7×) | – |
Key resources table
| Reagent type (species) or resource | Designation | Source or reference | Identifiers | Additional information |
|---|---|---|---|---|
| Strain, strain background (Escherichia coli) | E. coli K-12 MG1655 | Gift from Prof. Manjula Reddy, CCMB, India | NCBI:txid511145 | |
| Antibody | Anti-DHFR (Rabbit polyclonal) | Matange et al., 2018 | (100 ng/mL) | |
| Antibody | Anti-FtsZ (Rabbit polyclonal) | Gift from Prof. Manjula Reddy, CCMB, India | (1:50,000) | |
| Recombinant DNA reagent | pPRO-folA | Matange et al., 2018 | Plasmid for expression of DHFR | |
| Chemical compound, drug | Trimethoprim | Sigma-Aldrich | Cat. No. T7883 |
Table 2
List of strains and plasmids used in the study.
| Sr. no. | Strain | Description | Source |
|---|---|---|---|
| 1. | Escherichia coli K-12 MG1655 | Wild-type E. coli; used as ancestor for evolution experiments and as reference strains for phenotypic and genotypic comparisons | Laboratory stocks |
| Gene knockouts generated in E. coli K-12 MG1655 | |||
| 1. | E. coli ΔmgrB | Isogenic knockout of mgrB gene (ΔmgrB::Kan) | Patel and Matange, 2021 |
| 2. | E. coli ΔlacZ | Isogenic knockout of lacZ gene (ΔlacZ::Cat) | Patel and Matange, 2021 |
| 3. | E. coli Δlon | Isogenic knockout of lon gene (Δlon::Kan) | Matange, 2020 |
| 4. | E. coli ΔlonΔlacZ | Double knockout of lon (Δlon::Kan) and lacZ (ΔlacZ::Cat) genes | Patel and Matange, 2021 |
| 5. | E. coli ΔmgrBΔlon | Double knockout of lon (Δlon::Cat) and mgrB (ΔmgrB::Kan) genes | Patel and Matange, 2021 |
| 6. | E. coli ΔlonΔrpoS | Double knockout of lon (Δlon::Cat) and rpoS (ΔrpoS::Kan) genes | Patel and Matange, 2021 |
| 7. | E. coli ΔpitA | Isogenic knockout of pitA gene (ΔpitA::Kan) | This study |
| Strains/isolates derived from short-term adaptive laboratory evolution | |||
| 1. | WTMPR1, WTMPR2, WTMPR3, WTMPR4, and WTMPR5 | Trimethoprim-resistant derivatives of E. coli wild-type obtained by laboratory evolution at 300 ng/mL of trimethoprim for ~25 generation, followed by selection on agar plates supplemented with 1 μg/mL of trimethoprim | Patel and Matange, 2021. Note: These strains are labelled as TMPR1–5 in the original publication. They have been renamed WTMPR1-5 to indicate that they were derived after evolution of wild-type. |
| 2. | LTMPR1, LTMPR2, LTMPR3, LTMPR4, and LTMPR5 | Trimethoprim-resistant derivatives of E. coli Δlon obtained by laboratory evolution at 300 ng/mL of trimethoprim for ~25 generation, followed by selection on agar plates supplemented with 1 μg/mL of trimethoprim | This study |
| Plasmids | |||
| 1. | pPRO-insB | InsB gene cloned into the pPROEx-HtC expression plasmid in frame with an N-terminal hexa-histidine tag | This study |
| 2. | pPRO-insL | InsL gene cloned into the pPROEx-HtA expression plasmid in frame with an N-terminal hexa-histidine tag | This study |
| 3. | pPRO-folA | FolA gene cloned into the pPROEx-HtB expression plasmid in frame with an N-terminal hexa-histidine tag | Matange et al., 2018 |
| 4. | pPRO-folA Trp30Arg | FolA gene cloned into the pPROEx-HtB expression plasmid, harbouring the Trp30Arg mutation in frame with an N-terminal hexa-histidine tag | Matange et al., 2018 |
| 5. | pPRO-folA Tyr151Asp | FolA gene cloned into the pPROEx-HtB expression plasmid, harbouring the Tyr151Asp mutation in frame with an N-terminal hexa-histidine tag | This study |
| 6. | pPRO-folA Trp30Arg Tyr151Asp | FolA gene cloned into the pPROEx-HtB expression plasmid, harbouring the Trp30Arg and Tyr151Asp mutations in frame with an N-terminal hexa-histidine tag | This study |
| 7. | pPRO-folA Tyr151Phe | FolA gene cloned into the pPROEx-HtB expression plasmid, harbouring the Tyr151Phe mutation in frame with an N-terminal hexa-histidine tag | This study |
| 8. | pPRO-folA Tyr151Leu | FolA gene cloned into the pPROEx-HtB expression plasmid, harbouring the Tyr151Leu mutation in frame with an N-terminal hexa-histidine tag | This study |
Additional files
-
Supplementary file 1
Gene expression changes in LTMPR1 and WTMPR4 isolates.
- https://cdn.elifesciences.org/articles/99785/elife-99785-supp1-v1.xlsx
-
Supplementary file 2
Genomic changes associated with evolution of LTMPR1 in drug-free media.
- https://cdn.elifesciences.org/articles/99785/elife-99785-supp2-v1.xlsx
-
Supplementary file 3
Gene expression changes in isolates derived from LTMPR1 evolution in drug-free media containing mutation in rpoS or gene duplication and amplification (GDA)-2.
- https://cdn.elifesciences.org/articles/99785/elife-99785-supp3-v1.xlsx
-
Supplementary file 4
Genomic changes associated with evolution of LTMPR1 in trimethoprim (300 ng/mL).
- https://cdn.elifesciences.org/articles/99785/elife-99785-supp4-v1.xlsx
-
Supplementary file 5
Genomic changes associated with evolution of LTMPR1 in increasing trimethoprim pressure.
- https://cdn.elifesciences.org/articles/99785/elife-99785-supp5-v1.xlsx
-
Supplementary file 6
Genome sequencing of isolates derived from WTMPR4 evolution at different trimethoprim pressures.
- https://cdn.elifesciences.org/articles/99785/elife-99785-supp6-v1.xlsx
-
Supplementary file 7
Genome sequencing of isolates derived from WTMPR5 evolution at different trimethoprim pressures.
- https://cdn.elifesciences.org/articles/99785/elife-99785-supp7-v1.xlsx
-
MDAR checklist
- https://cdn.elifesciences.org/articles/99785/elife-99785-mdarchecklist1-v1.docx
Download links
A two-part list of links to download the article, or parts of the article, in various formats.
Downloads (link to download the article as PDF)
Open citations (links to open the citations from this article in various online reference manager services)
Cite this article (links to download the citations from this article in formats compatible with various reference manager tools)
Proteostasis modulates gene dosage evolution in antibiotic-resistant bacteria
eLife 13:RP99785.
https://doi.org/10.7554/eLife.99785.3


