Stepwise activation mechanism of the scramblase nhTMEM16 revealed by cryo-EM
- University of Zurich, Switzerland
- University of Groningen, The Netherlands
Figures
Figure 1 with 5 supplements
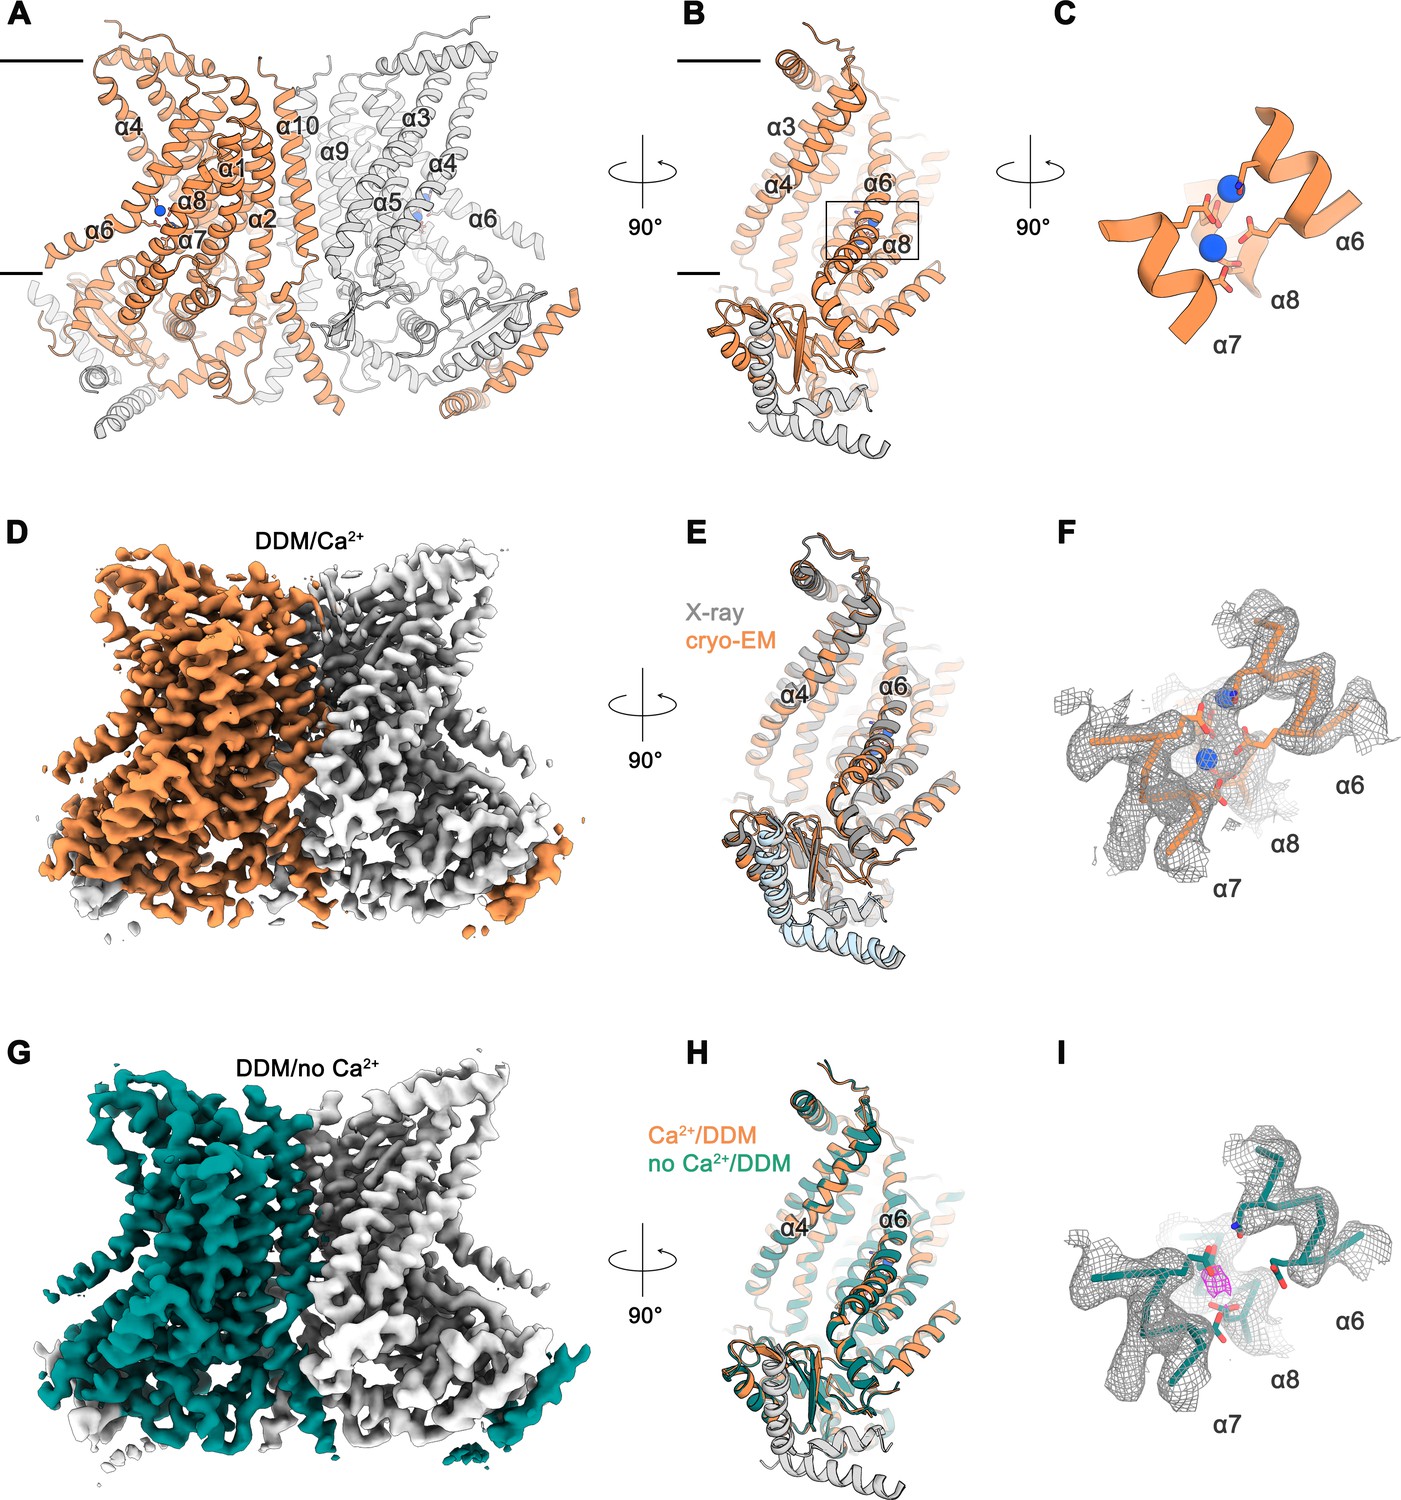
Cryo-EM structures of nhTMEM16 in detergent.
Ribbon representation of the Ca2+-bound cryo-EM structure of nhTMEM16 in detergent. The view is from within the membrane perpendicular to the long dimension of the protein (A), towards the subunit cavity (B) and at the Ca2+-ion binding site (C). The membrane boundary is indicated. Subunits in the dimer are depicted in orange and gray, respective transmembrane-helices are labelled and Ca2+-ions are displayed as blue spheres. Relative orientations are indicated and the location of the Ca2+-binding site is highlighted by a box in panel B. (D) Cryo-EM map of the nhTMEM16 dimer (orange and gray) in DDM in presence of Ca2+ at 3.6 Å, sharpened with a b-factor of –126 Å2 and contoured at 6 σ. (E) Ribbon representation of a superposition of the Ca2+-bound structure in detergent determined by cryo-EM (orange and gray) and the Ca2+-bound X-ray structure (dark gray and light blue, PDBID: 4WIS) The view is as in panel B. (F) View of the Ca2+-ion binding site of the Ca2+-bound state of nhTMEM16 in DDM. Ca2+-ions are displayed as blue spheres. (G) Cryo-EM map of the nhTMEM16 dimer (green and gray) in DDM in the absence of Ca2+ at 3.7 Å, sharpened with a b-factor of –147 Å2 and contoured at 6 σ. (H) Ribbon representation of a superposition of the Ca2+-bound (orange and gray) and the Ca2+-free structure (green and gray) in detergent determined by cryo-EM. The view is as in panel B. (I) View of the Ca2+-binding site in the Ca2+-free state of nhTMEM16 in DDM. The location of weak residual density at the center of the Ca2+-binding site is indicated in magenta. F,I The respective cryo-EM densities are contoured at 7 σ and shown as mesh. The backbone is displayed as Cα-trace, selected side-chains as sticks.
Figure 1—figure supplement 1

Reconstitution of nhTMEM16 into liposomes.
Ca2+-dependence of scrambling activity of WT in liposomes of three different lipid compositions. Traces depict the fluorescence decrease of tail-labeled NBD-PE lipids after addition of dithionite (#) at different Ca2+ concentrations. Data show averages of three technical replicates for assay and nanodisc lipids, and of two for soybean lipids. Ca2+ concentrations (μM) are indicated. (A) Scrambling activity of nhTMEM16 reconstituted into liposomes composed of E. coli polar lipids, egg PC at a ratio of 3:1 (w/w) used for functional experiments. (B) Scrambling activity of nhTMEM16 reconstituted into liposomes composed of soybean polar lipids extract with 20% cholesterol (mol/mol). (C) Scrambling activity of nhTMEM16 reconstituted into liposomes composed of POPC/POPG at a molar ratio of 7:3 used for nanodisc assembly. Traces of E. coli polar lipids/egg PC-containing proteoliposomes (displayed in A) are shown as dashed lines for comparison.
Figure 1—figure supplement 2

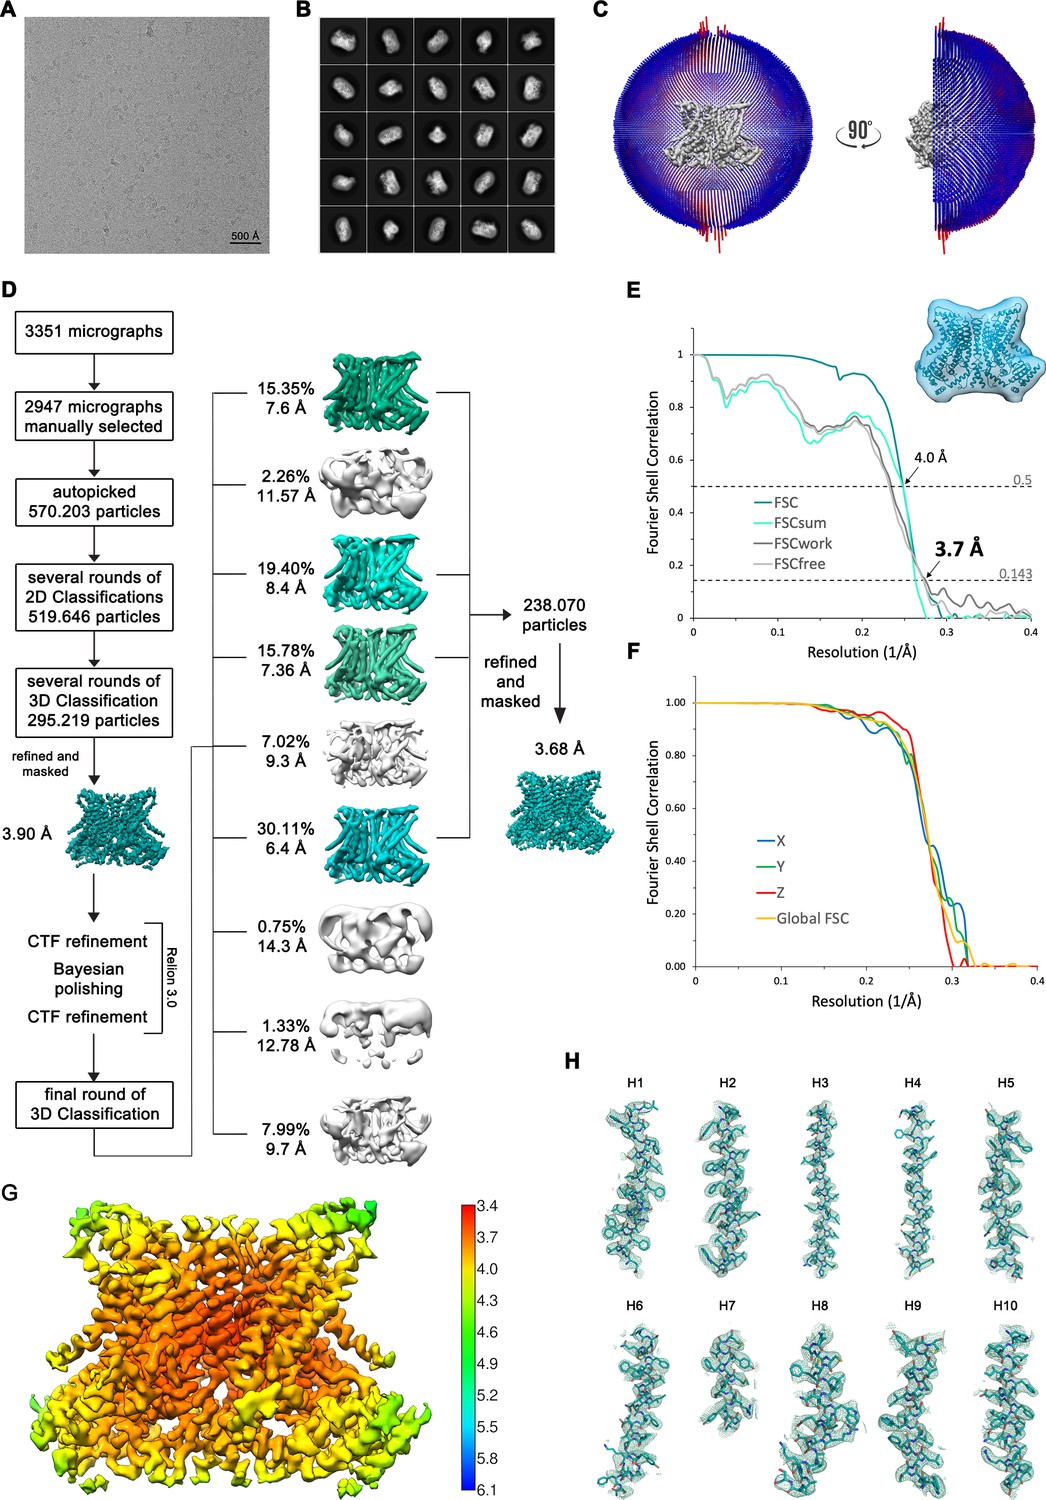
Structure Determination of nhTMEM16 in DDM in complex with Ca2+.
(A) Representative cryo-EM image and (B) 2D-class averages of vitrified nhTMEM16 in a Ca2+-bound state in detergent. (C) Angular distribution plot of particles included in the final C2-symmetric 3D reconstruction. The number of particles with their respective orientation is represented by length and color of the cylinders. (D) Image processing workflow. (E) FSC plot used for resolution estimation and model validation. The gold-standard FSC plot between two separately refined half-maps is shown in orange and indicates a final resolution of 3.6 Å. FSC validation curves for FSCsum, FSCwork and FSCfree as described in the Methods are shown in light yellow, dark gray and light gray, respectively. A thumbnail of the mask used for FSC calculation overlaid on the atomic model is shown in the upper right corner and thresholds used for FSCsum of 0.5 and for FSC of 0.143 are shown as dashed lines. (F) Anisotropy estimation plot of the final map. The global FSC curve is represented in yellow. The directional FSCs along the x, y and z axis displayed in blue, green and red, respectively, are indicative for an isotropic dataset. (G) Final reconstruction map colored by local resolution as estimated by Relion, indicate regions of higher resolution. (H) Sections of the cryo-EM density of the map superimposed on the refined model. The model is shown as sticks and structural elements are labelled. The map was sharpened with a b-factor of –126 Å2 and contoured at 5 σ.
Figure 1—figure supplement 3
Structure Determination of nhTMEM16 in DDM in absence of Ca2+.
(A) Representative cryo-EM image and (B) 2D-class averages of vitrified nhTMEM16 in a Ca2+-free state in detergent. (C) Angular distribution plot of particles included in the final C2-symmetric 3D reconstruction. The number of particles with their respective orientation is represented by length and color of the cylinders. (D) Image processing workflow. (E) FSC plot used for resolution estimation and model validation. The gold-standard FSC plot between two separately refined half-maps is shown in green and indicates a final resolution of 3.7 Å. FSC validation curves for FSCsum, FSCwork and FSCfree as described in the Methods are shown in cyan, dark gray and light gray, respectively. A thumbnail of the mask used for FSC calculation overlaid on the atomic model is shown in the upper right corner and thresholds used for FSCsum of 0.5 and for FSC of 0.143 are shown as dashed lines. (F) Anisotropy estimation plot of the final map. The global FSC curve is represented in yellow. The directional FSCs along the x, y and z axis displayed in blue, green and red, respectively, are indicative for an isotropic dataset. (G) Final reconstruction map colored by local resolution as estimated by Relion, indicate regions of higher resolution. (H) Sections of the cryo-EM density of the map superimposed on the refined model. The model is shown as sticks and structural elements are labelled. The map was sharpened with a b-factor of –147 Å2 and contoured at 5 σ.
Figure 1—figure supplement 4
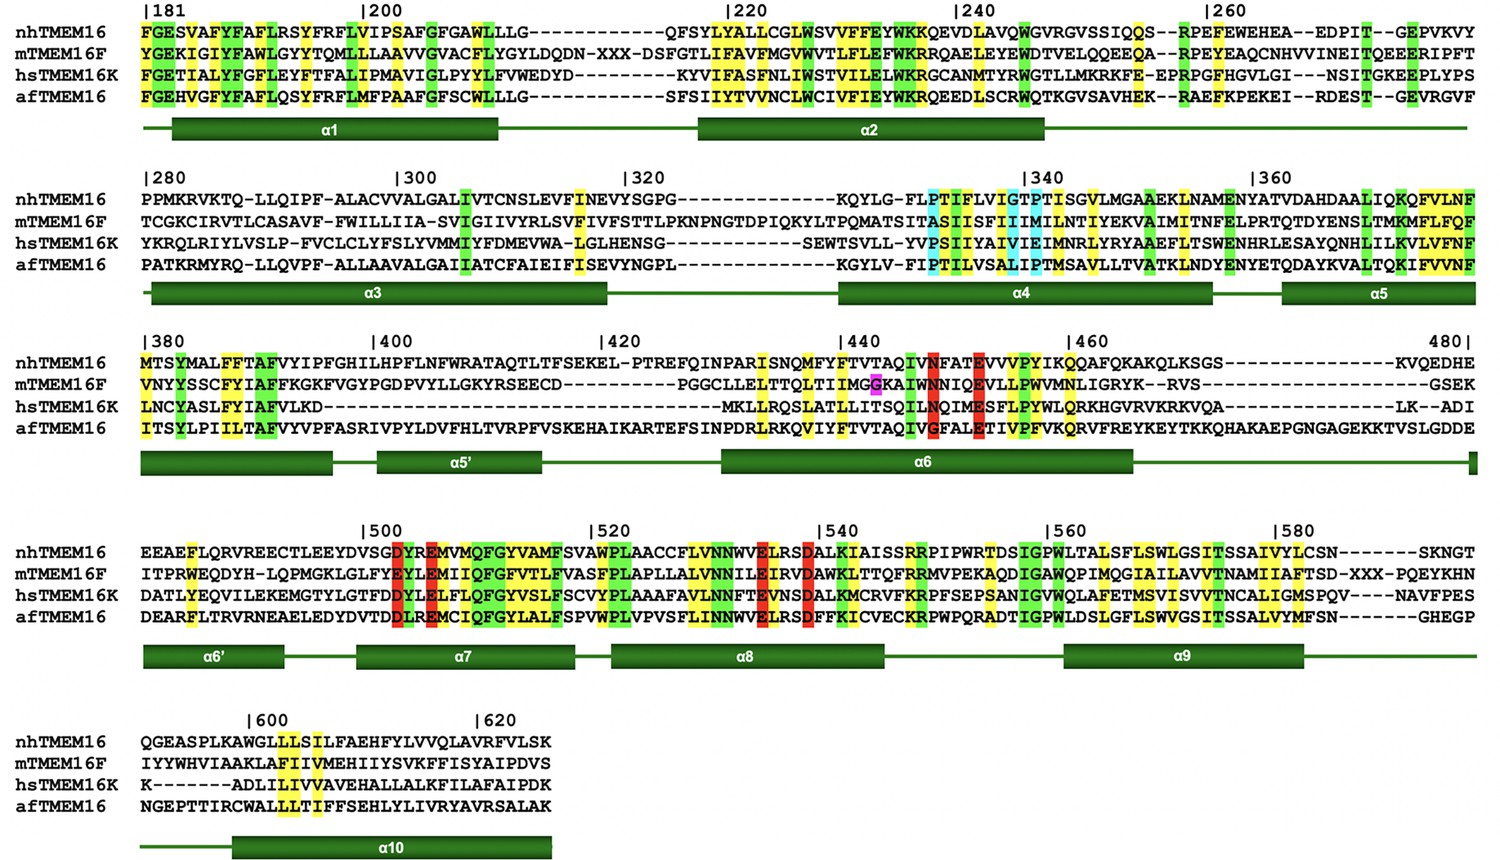
Sequence alignment of selected TMEM16 scramblases.
Protein sequences of the transmembrane domain of the fungal TMEM16 homologs from Nectria haematococca (nhTMEM16) and Aspergillus fumigatus (afTMEM16), murine TMEM16F and human TMEM16K were aligned based on their structure. Numbering and the boundaries of secondary structure elements (green rectangles for transmembrane-helices and green lines for loops) correspond to nhTMEM16. Residues highlighted in red constitute the Ca2+-binding site; residues highlighted in blue act as potential pivot points for structural rearrangements in α4; residue highlighted in purple indicates the flexible hinge region in TMEM16F responsible for the movements of α6 upon Ca2+ release.
Figure 1—figure supplement 5
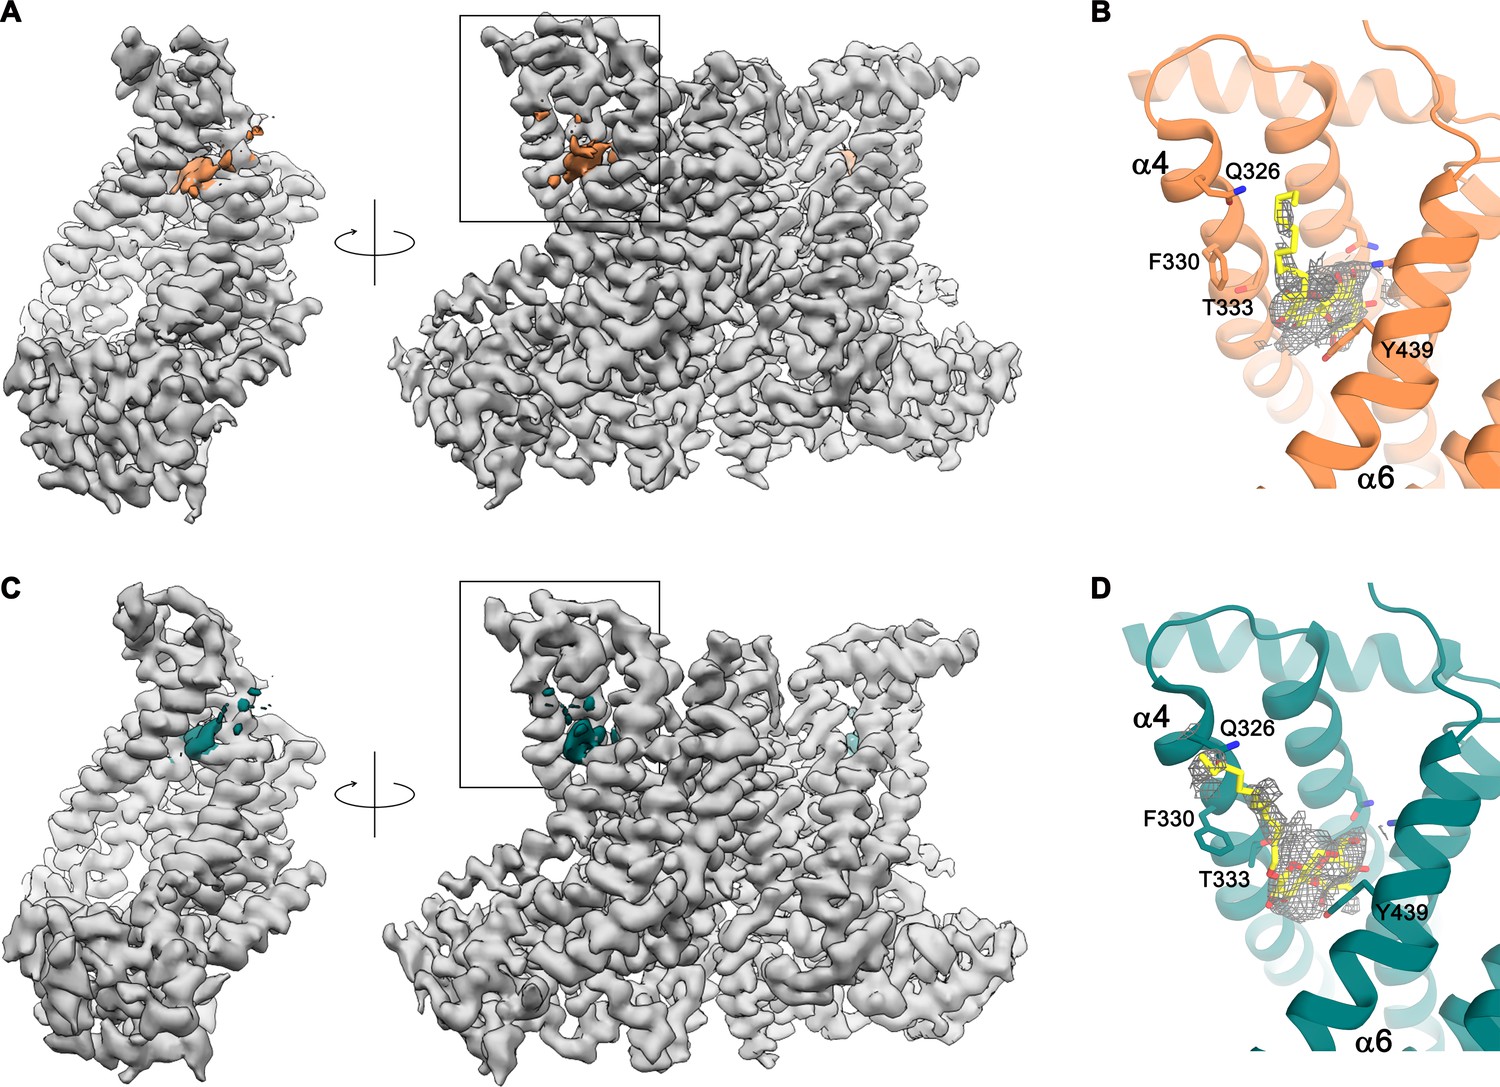
Detergent binding to the subunit cavity.
(A) Cryo-EM map of the nhTMEM16 dimer in detergents in presence of Ca2+ (gray) in two orientations. Residual density in the subunit cavity highlighted in orange. (B) Ribbon representation of the subunit cavity of nhTMEM16 in detergent in presence of Ca2+. Residual density (contoured at 5 σ) is shown as gray mesh. A DDM molecule (yellow) and selected sidechains are depicted as sticks. (C) Cryo-EM map of the nhTMEM16 dimer in detergent in absence of Ca2+ (gray) in two orientations. Residual density found in the subunit cavity is highlighted in green. (D) Ribbon representation of the subunit cavity of nhTMEM16 in detergents in absence of Ca2+ (green). Residual density (contoured at 5 σ) is shown as gray mesh. A DDM molecule (yellow) and selected sidechains are depicted as sticks. The location of B,D is indicated by the box drawn on the right panel of A,C.
Figure 2 with 2 supplements
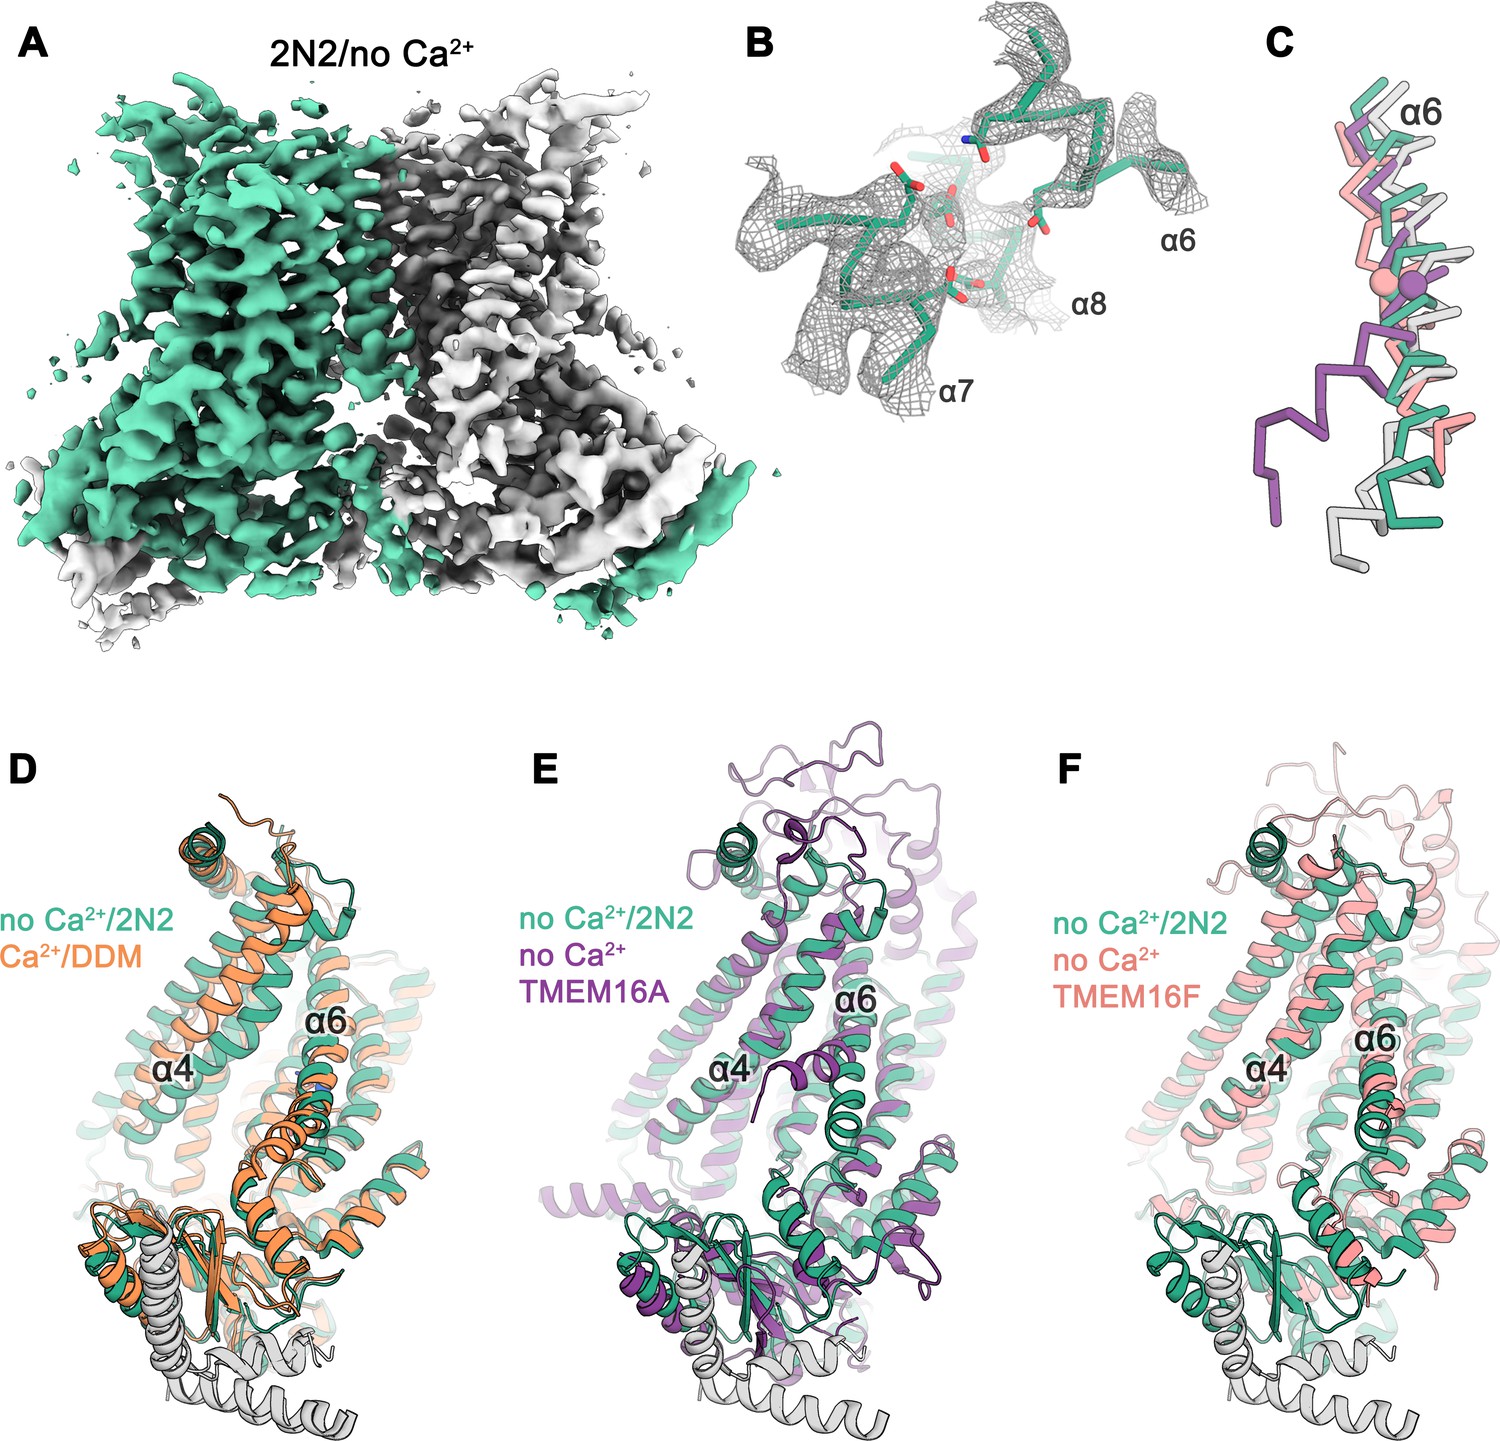
Cryo-EM structure of nhTMEM16 in nanodiscs in absence of Ca2+.
(A) Cryo-EM map of the nhTMEM16 dimer (light green and gray) in nanodiscs in absence of Ca2+ at 3.8 Å resolution. The map was sharpened with a b-factor of –150 Å2 and is contoured at 5.6 σ. (B) View of the Ca2+-binding site in the Ca2+-free state of nhTMEM16 in nanodiscs. The cryo-EM density shown as mesh is contoured at 6 σ, the backbone is displayed as Cα-trace and selected side-chains as sticks. (C) Cα-traces of α6 from a superposition of Ca2+-free structures of nhTMEM16 in nanodiscs (green), TMEM16A (violet, PDBID: 5OYG) and TMEM16F (red, PDBID: 6QPB) and of the Ca2+-bound structure of nhTMEM16 in DDM (gray). The spheres indicate the position of the flexible glycine residue in TMEM16A and TMEM16F, which acts as a hinge for conformational changes. (D–F) Ribbon representation of superpositions of the Ca2+-free structure in nanodiscs (light green and gray) with the Ca2+-bound structure in DDM ((D), orange and gray), the Ca2+-free structure of TMEM16A ((E), violet, PDBID: 5OYG) and the Ca2+-free structure of TMEM16F ((F), red, PDBID: 6QPB). Selected α-helices are labeled, the views are as in Figure 1.
Figure 2—figure supplement 1

Reconstitution of nhTMEM16 into nanodiscs.
Shape of nhTMEM16 particles reconstituted into nanodiscs at different protein to lipid ratios (LPR, mol/mol) in the absence of Ca2+: (A), LPR 145, (B), LPR 155 and (C), LPR 220. Refined and unmasked cryo-EM density maps were low-pass filtered to 10 Å and are shown from the extracellular side (upper panel, subunit cavity indicated by *) and from the side with a view towards the subunit cavity (lower panel). A model of nhTMEM16 fitted into the density is displayed as ribbon.
Figure 2—figure supplement 2
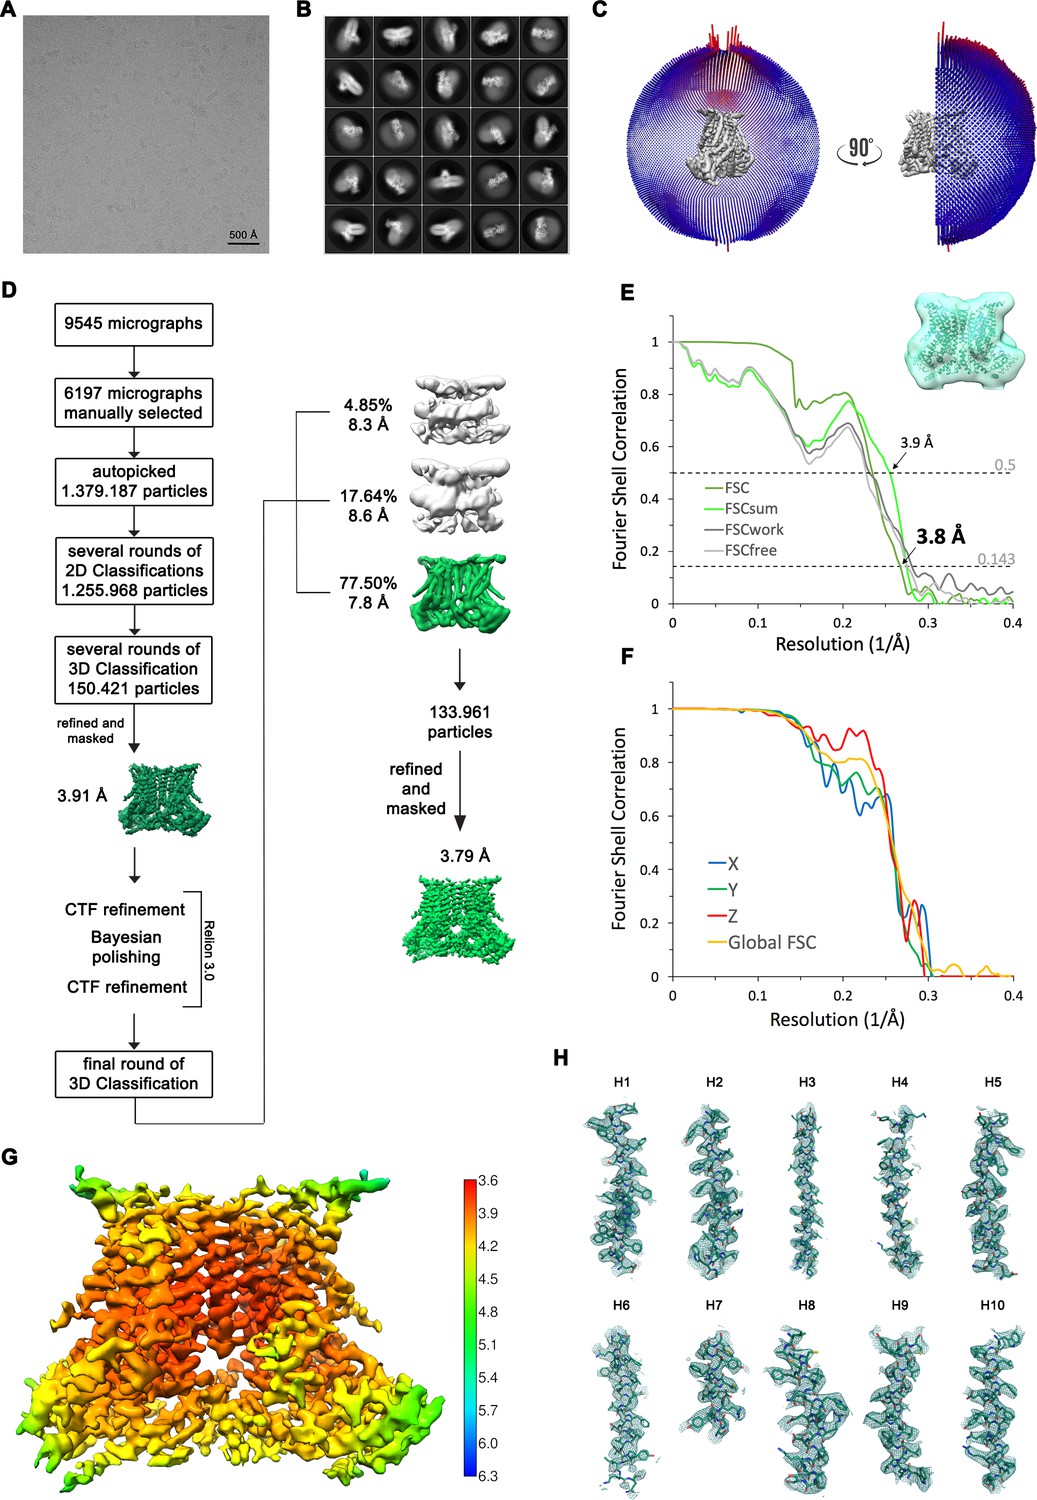
Structure Determination of nhTMEM16 in the absence of Ca2+ in nanodiscs.
(A) Representative cryo-EM image and (B) 2D-class averages of vitrified nhTMEM16 in a Ca2+-free state in lipid nanodiscs. (C) Angular distribution plot of particles included in the final C2-symmetric 3D reconstruction. The number of particles with their respective orientation is represented by length and color of the cylinders. (D) Image processing workflow. (E) FSC plot used for resolution estimation and model validation. The gold-standard FSC plot between two separately refined half-maps is shown in green and indicates a final resolution of 3.8 Å. FSC validation curves for FSCsum, FSCwork and FSCfree as described in the Methods are shown in light green, dark gray and light gray, respectively. A thumbnail of the mask used for FSC calculation overlaid on the atomic model is shown in the upper right corner and thresholds used for FSCsum of 0.5 and for FSC of 0.143 are shown as dashed lines. (F) Anisotropy estimation plot of the final map. The global FSC curve is represented in yellow. The directional FSCs along the x, y and z axis displayed in blue, green and red, respectively, are indicative for an isotropic dataset. (G) Final reconstruction map colored by local resolution as estimated by Relion, indicate regions of higher resolution. (H) Sections of the cryo-EM density of the map superimposed on the refined model. The model is shown as sticks and structural elements are labelled. The map was sharpened with a b-factor of –150 Å2 and contoured at 5 σ.
Figure 3 with 3 supplements

Cryo-EM structures of nhTMEM16 in nanodiscs in presence of Ca2+.
(A) Cryo-EM map of the nhTMEM16 dimer in the Ca2+-bound ‘open’ state (yellow and gray) in nanodiscs at 3.6 Å, sharpened with a b-factor of –114 Å2 and contoured at 6.5 σ (upper panel). Close-up of the Ca2+-binding site with two bound Ca2+-ions displayed as blue spheres (lower panel). Cryo-EM density contoured at 7 σ is shown as gray mesh, the backbone is displayed as yellow Cα-trace and selected side-chains as sticks. (B) Cryo-EM map of the nhTMEM16 dimer in the Ca2+-bound ‘intermediate’ state (yellow-green and gray) in nanodiscs at 3.7 Å, sharpened with a b-factor of –96 Å2 and contoured at 4.9 σ (upper panel). Close-up of the Ca2+-binding site with two bound Ca2+-ions displayed as blue spheres (lower panel). Cryo-EM density contoured at 7 σ is shown as gray mesh, the backbone is displayed as light green Cα-trace and selected side-chains as sticks. (C) Cryo-EM map of the nhTMEM16 dimer in the ‘Ca2+-bound closed state (green and gray) in nanodiscs at 3.6 Å, sharpened with a b-factor of –96 Å2 and contoured at 6.5 σ (upper panel). Close-up of the Ca2+-binding site with two bound Ca2+-ions displayed as blue spheres (lower panel). Cryo-EM density contoured at 7 σ is shown as gray mesh, the backbone is displayed as light green Cα-trace and selected side-chains as sticks. (D–G) Ribbon representation of superpositions with Ca2+-bound structures of nhTMEM16 in nanodiscs: (D) Ca2+-bound open structure in nanodiscs and Ca2+-bound structure in DDM; (E) Ca2+-bound open structure in nanodiscs and Ca2+-bound intermediate structure in nanodiscs; (F) Ca2+-bound intermediate structure in nanodiscs and Ca2+-bound closed structure in nanodiscs; (G) Ca2+-bound closed structure in nanodiscs and Ca2+-free structure in nanodiscs. Selected helices are labeled and views are as in Figure 1.
Figure 3—figure supplement 1
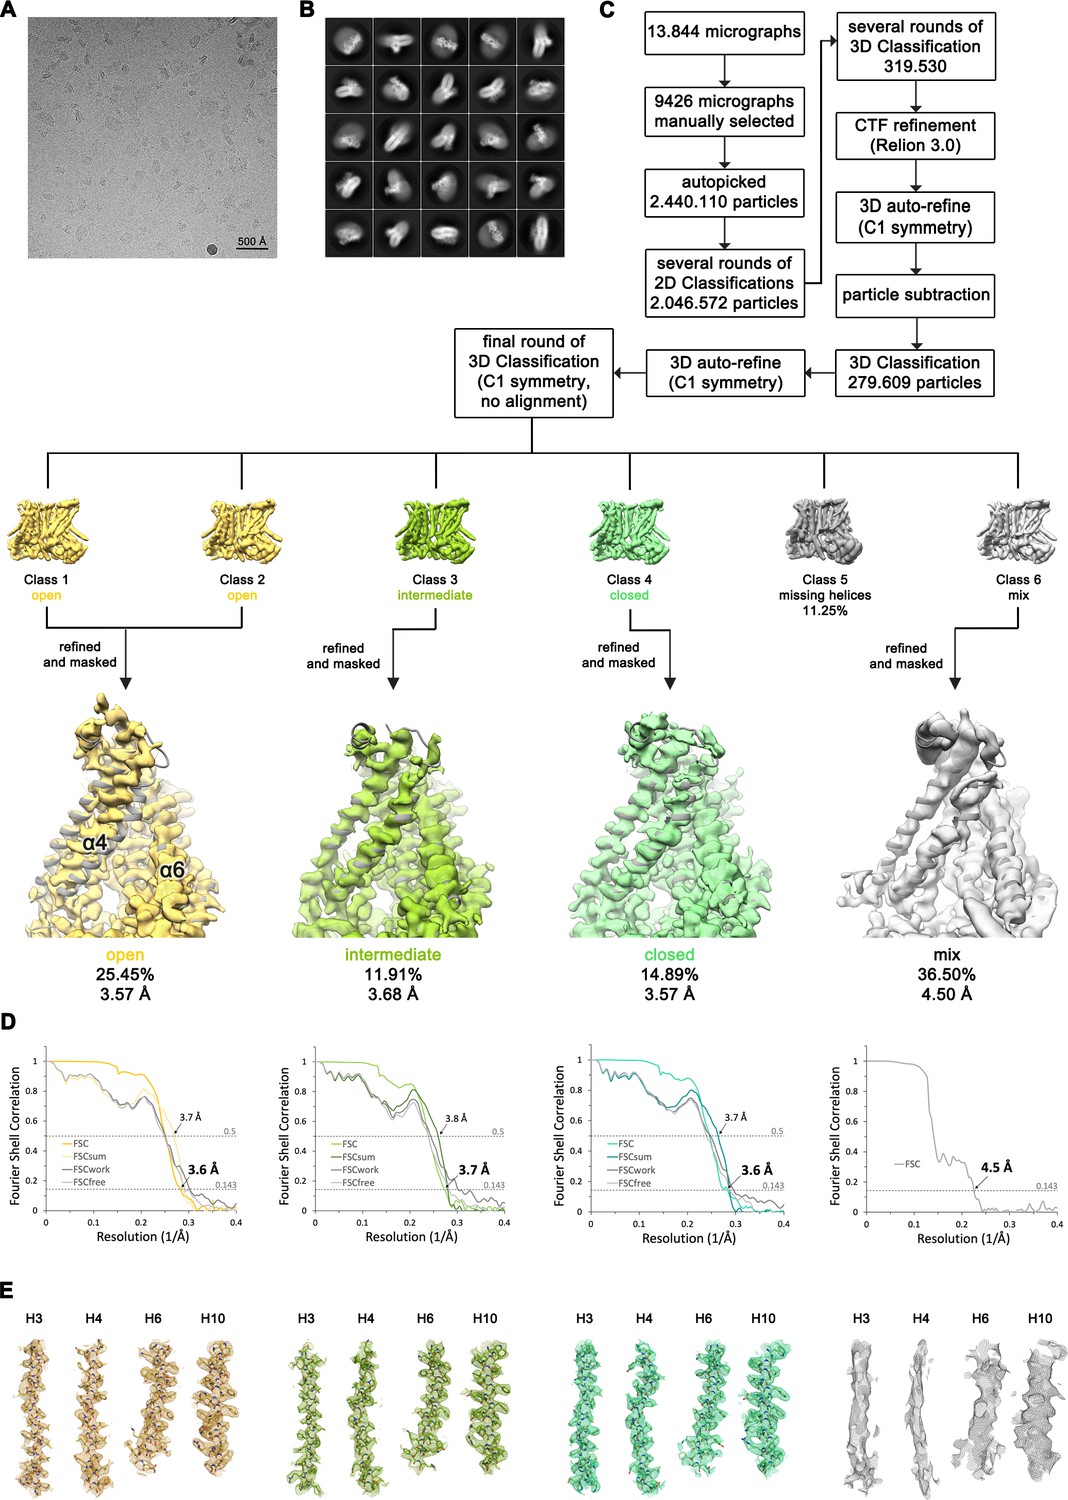
Structure Determination of nhTMEM16 in complex with Ca2+ in nanodiscs.
(A) Representative cryo-EM image and (B) 2D-class averages of vitrified nhTMEM16 in a Ca2+-bound state in lipid nanodiscs. (C) Image processing workflow. The final set of subtracted particles was subjected to a final round of 3D classification disclosing a conformational heterogeneity at the subunit cavity, with classes resembling a well-resolved open, intermediate and closed state of the subunit cavity. Other classes displayed a poorly resolved density for α3 and α4 that likely represent an average of several transition states. Close-up of the subunit cavities show the intermediate model (gray) superimposed on the cryo-EM maps of the respective classes. View as in Figure 3D. (D) FSC plot used for resolution estimation and model validation for each state. Shown are the gold-standard FSC plot between two separately refined half-maps, and the FSC validation curves for FSCsum, FSCwork and FSCfree as described in the Methods.. Thresholds used for FSCsum of 0.5 and for FSC of 0.143 are shown as dashed lines. (E) Sections of the cryo-EM density of the maps superimposed on the corresponding refined models. The models are shown as sticks and structural elements are labelled. The maps were contoured at 4.5 σ.
Figure 3—figure supplement 2
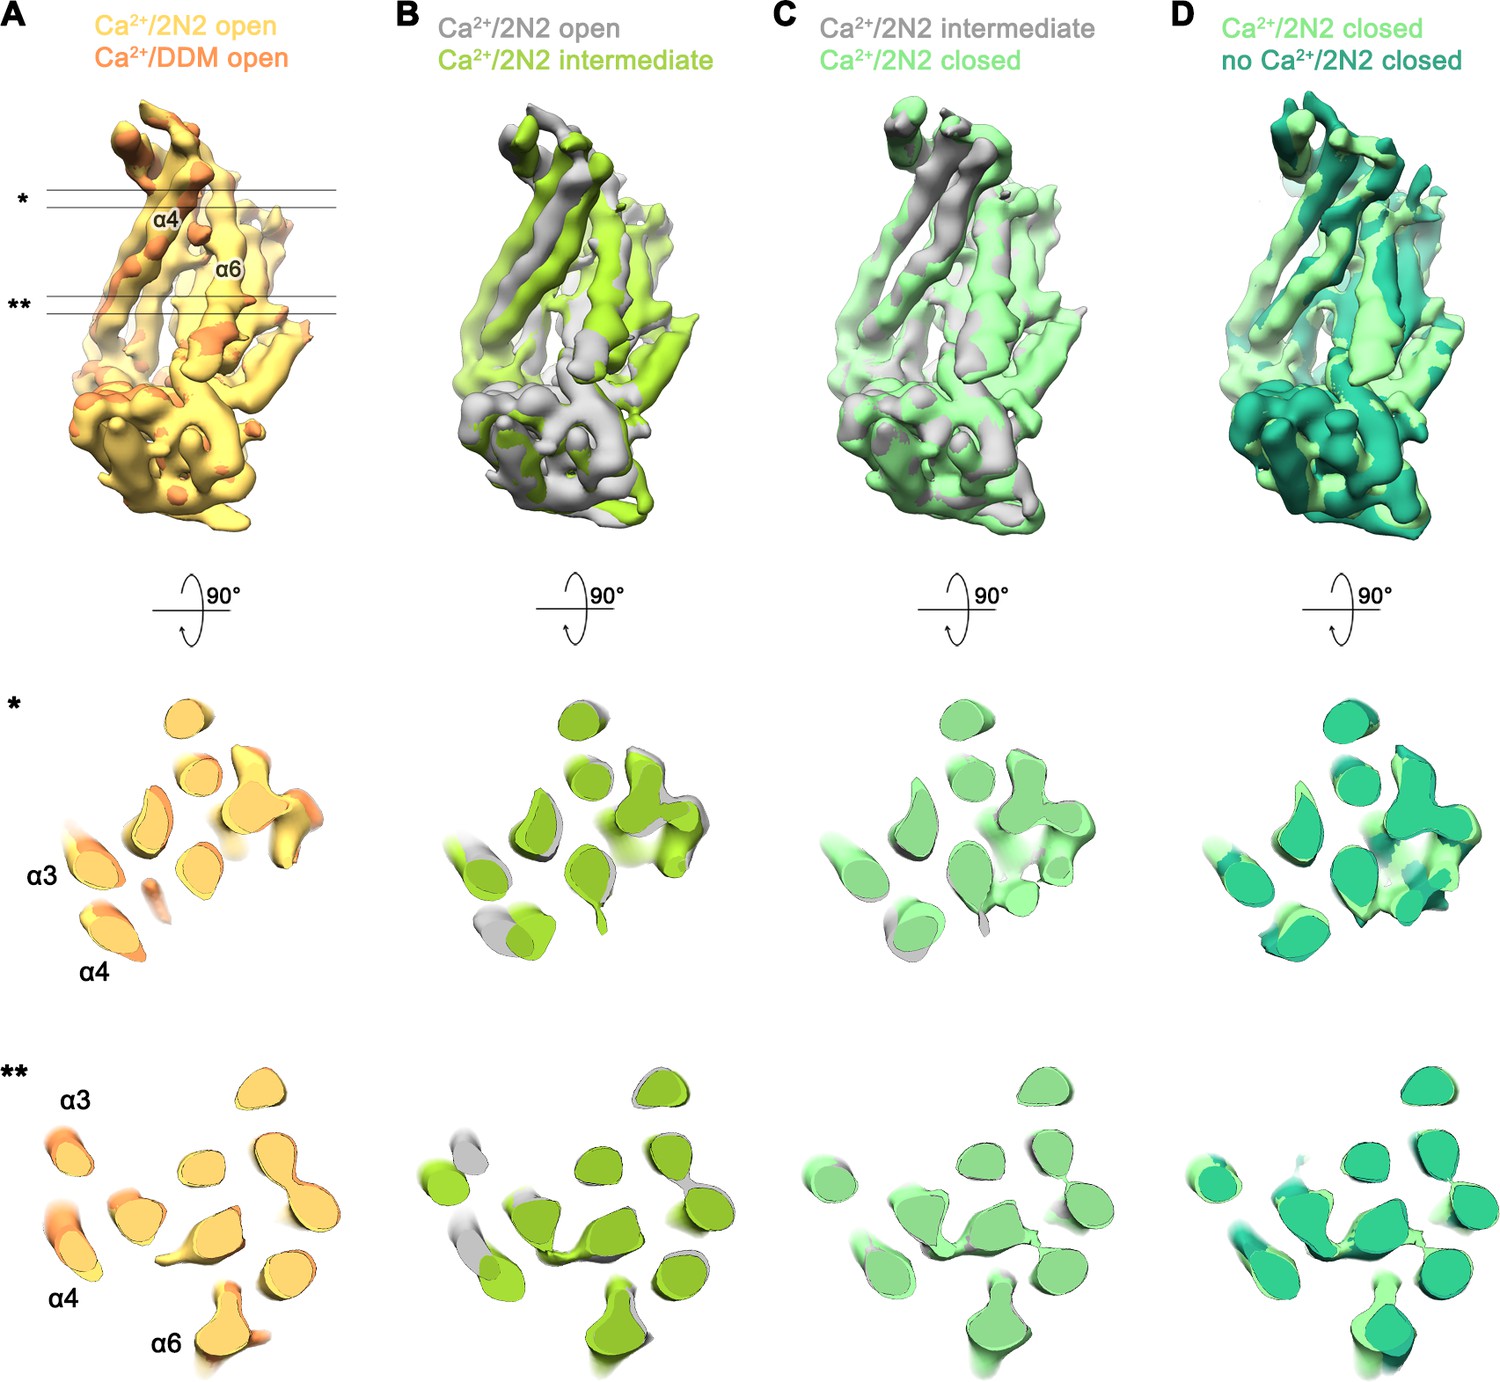
Conformational heterogeneity in the Ca2+-bound data of nhTMEM16 in nanodiscs.
(A–D) Superpositions of the refined and unmasked cryo-EM maps of Ca2+-bound structures of nhTMEM16 in nanodiscs, low-pass filtered at 6 Å. (A) Superposition of the Ca2+-bound open structure in nanodiscs and the Ca2+-bound structure in DDM; (B) the Ca2+-bound open structure in nanodiscs and the Ca2+-bound intermediate structure in nanodiscs; (C) the Ca2+-bound intermediate structure in nanodiscs and the Ca2+-bound closed structure in nanodiscs; (D) the Ca2+-bound closed structure in nanodiscs and the Ca2+-free structure in nanodiscs. A-D, selected helices are labeled, view of upper panel is as in Figure 3D–G. Middle and lower panel show a cross-section through the superposition at the indicated regions depicted in A by * and **.
Figure 3—figure supplement 3
Lipid distribution in the subunit cavity.
(A) Cryo-EM map of Ca2+-bound nhTMEM16 in nanodiscs (gray, contoured at 3.4 σ) with density corresponding to the phospholipid headgroup region of both membrane leaflets in the nanodisc and inside the subunit cavity highlighted in yellow. (B) Ribbon representation of the subunit cavity of the Ca2+-bound nhTMEM16 in nanodiscs (gray) with selected sidechains labelled and depicted as sticks. Unassigned density inside the subunit cavity (contoured at 3.9 σ) is shown in yellow. (C) Cryo-EM map of Ca2+-free nhTMEM16 in nanodiscs (gray, contoured at 3.4 σ) with density of the phospholipid headgroup region of both membrane leaflets in the nanodisc highlighted in green. No residual density is found at the subunit cavity. A,C The refined and unmasked maps were low-pass filtered to 6 Å.
Figure 4
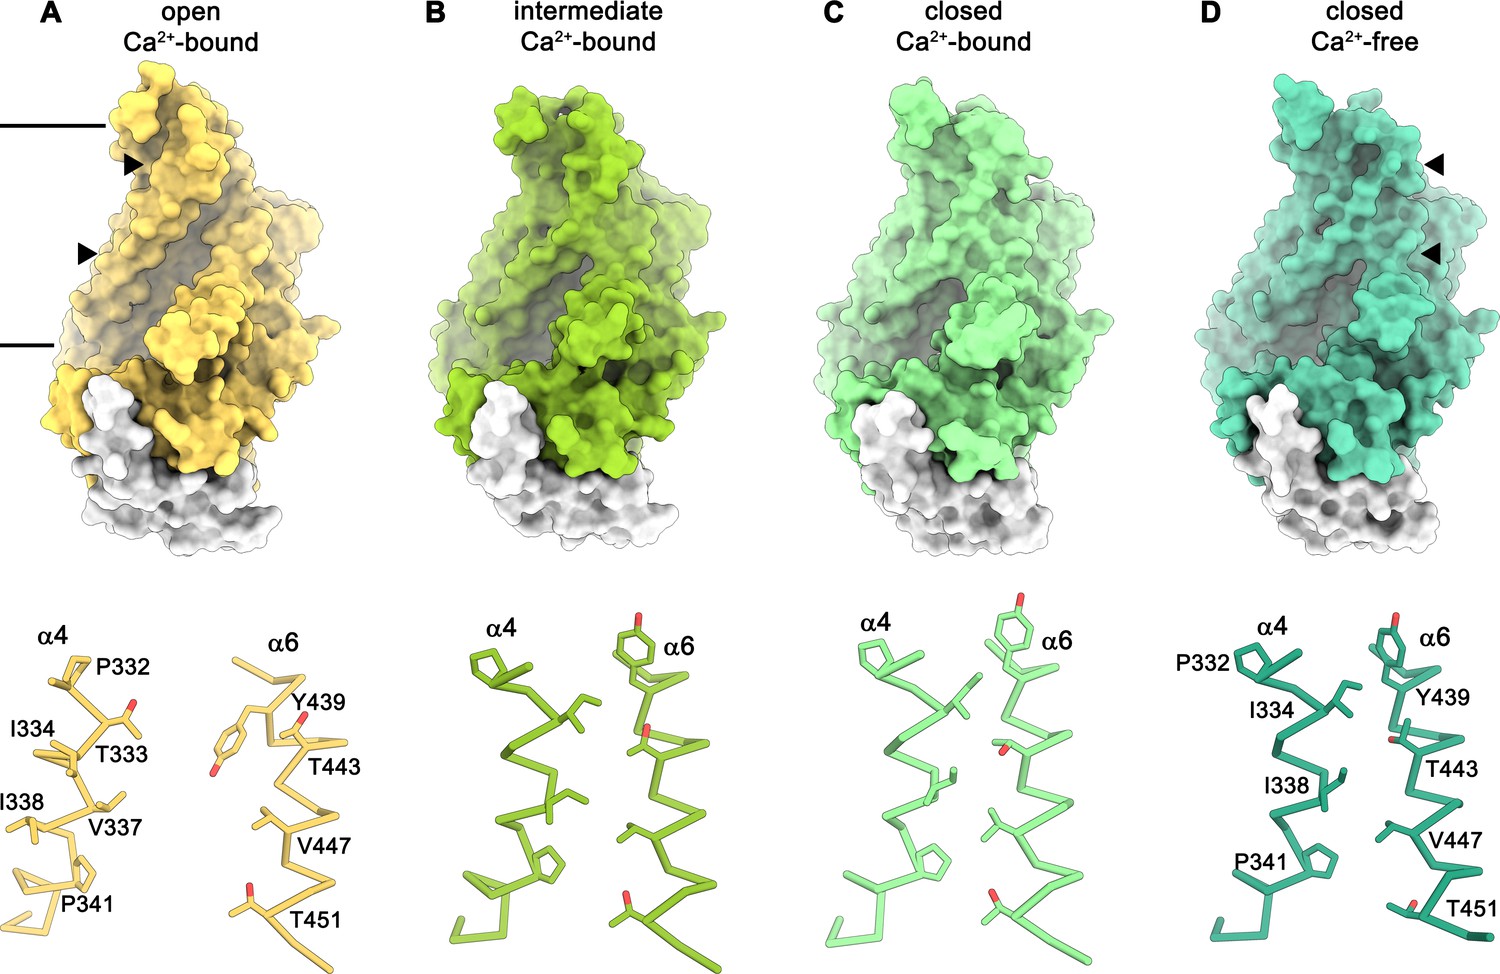
Conformations of the subunit cavity.
Views of the molecular surface of the subunit cavity (top) and structures of α4 and α6 that line the cavity, displayed as Cα-trace with selected sidechains shown as sticks and labeled (bottom). (A) ‘Open state’ as defined in the Ca2+-bound structure in nanodiscs. (B) ‘Intermediate state’ as defined in the Ca2+-bound structure in nanodiscs, (C) ‘Ca2+-bound closed state’ as defined in the Ca2+-bound structure in nanodiscs. (D) ‘Closed state’ as defined by the Ca2+-free structure in nanodiscs. Membrane boundaries are indicated and the region shown in the lower panels is depicted by triangles in the upper panels.
Figure 5 with 1 supplement
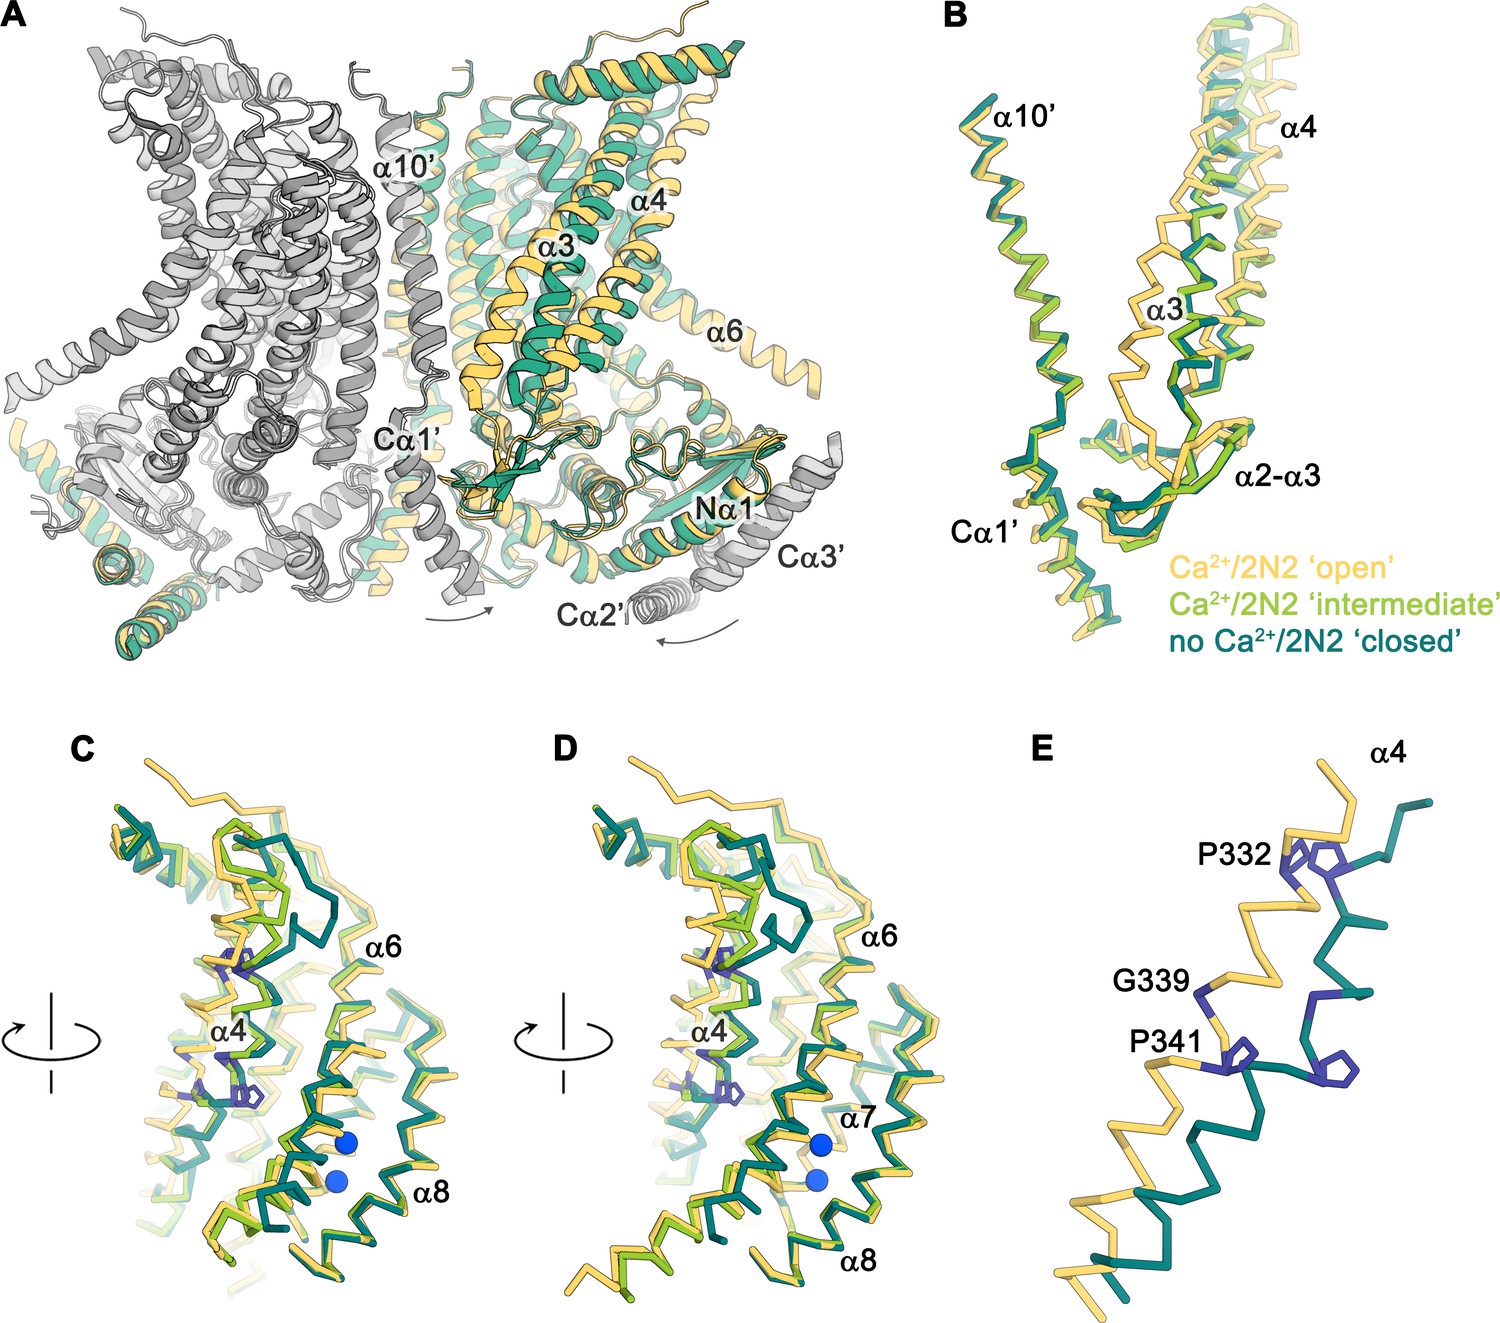
Conformational changes.
(A) Ribbon representation of a superposition of the Ca2+-bound ‘open’ (yellow and light gray) and Ca2+-free ‘closed’ (green and dark gray) nhTMEM16 structures in nanodiscs. Selective helices are labeled and the arrows indicate small rearrangements of the cytosolic domain upon Ca2+ release. (B–D) Cα-traces of selected regions of the ‘subunit cavity’ in different conformations as defined by the Ca2+-bound ‘open’ structure in nanodiscs (yellow), the Ca2+-bound ‘intermediate’ structure in nanodiscs (light green) and the Ca2+-free ‘closed’ structure in nanodiscs (dark green). The view in B is as in A and the respective orientations of subsequent panels are indicated. (E) Superposition of α4 in the ‘open’ and ‘closed’ states with residues that act as potential pivots for structural arrangements highlighted in blue.
Figure 5—figure supplement 1
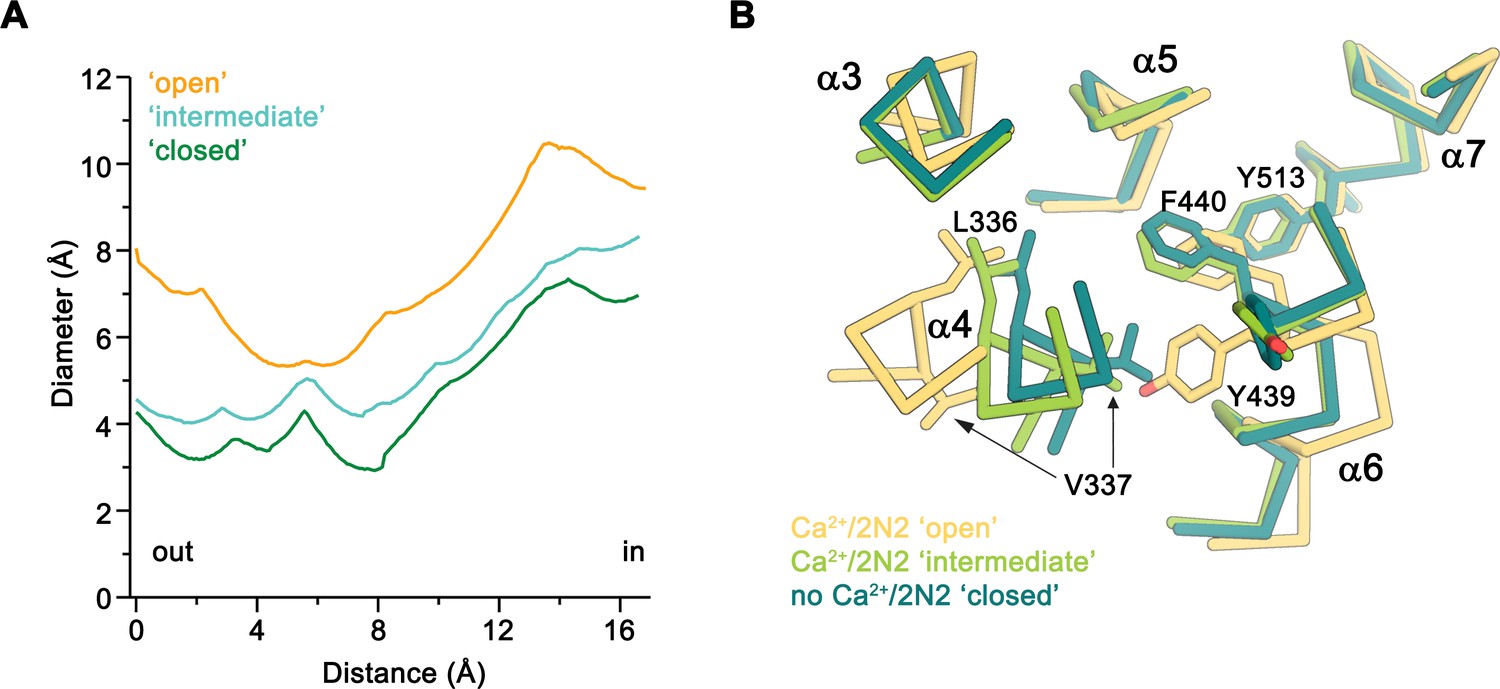
Diameter of the subunit cavity in Ca2+-bound nhTMEM16 structures in nanodiscs.
(A) Pore diameter at the constriction of the subunit cavity in the three conformations of the subunit cavity calculated with HOLE (Smart et al., 1996). (B) View of the constriction of the ‘subunit cavity’ in three different conformations from the extracellular side. The protein is shown as Cα-trace with selected sidechains displayed as sticks and labelled.
Figure 6
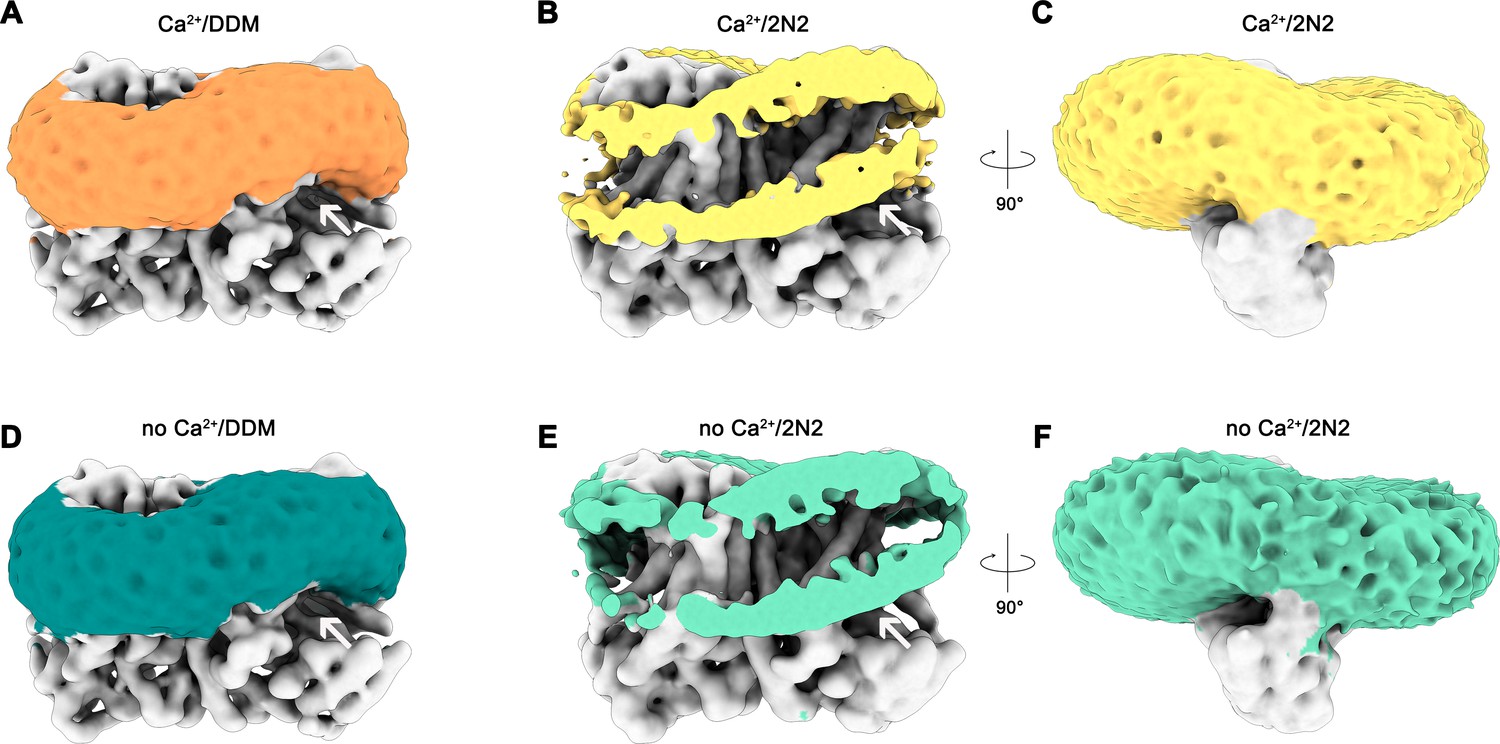
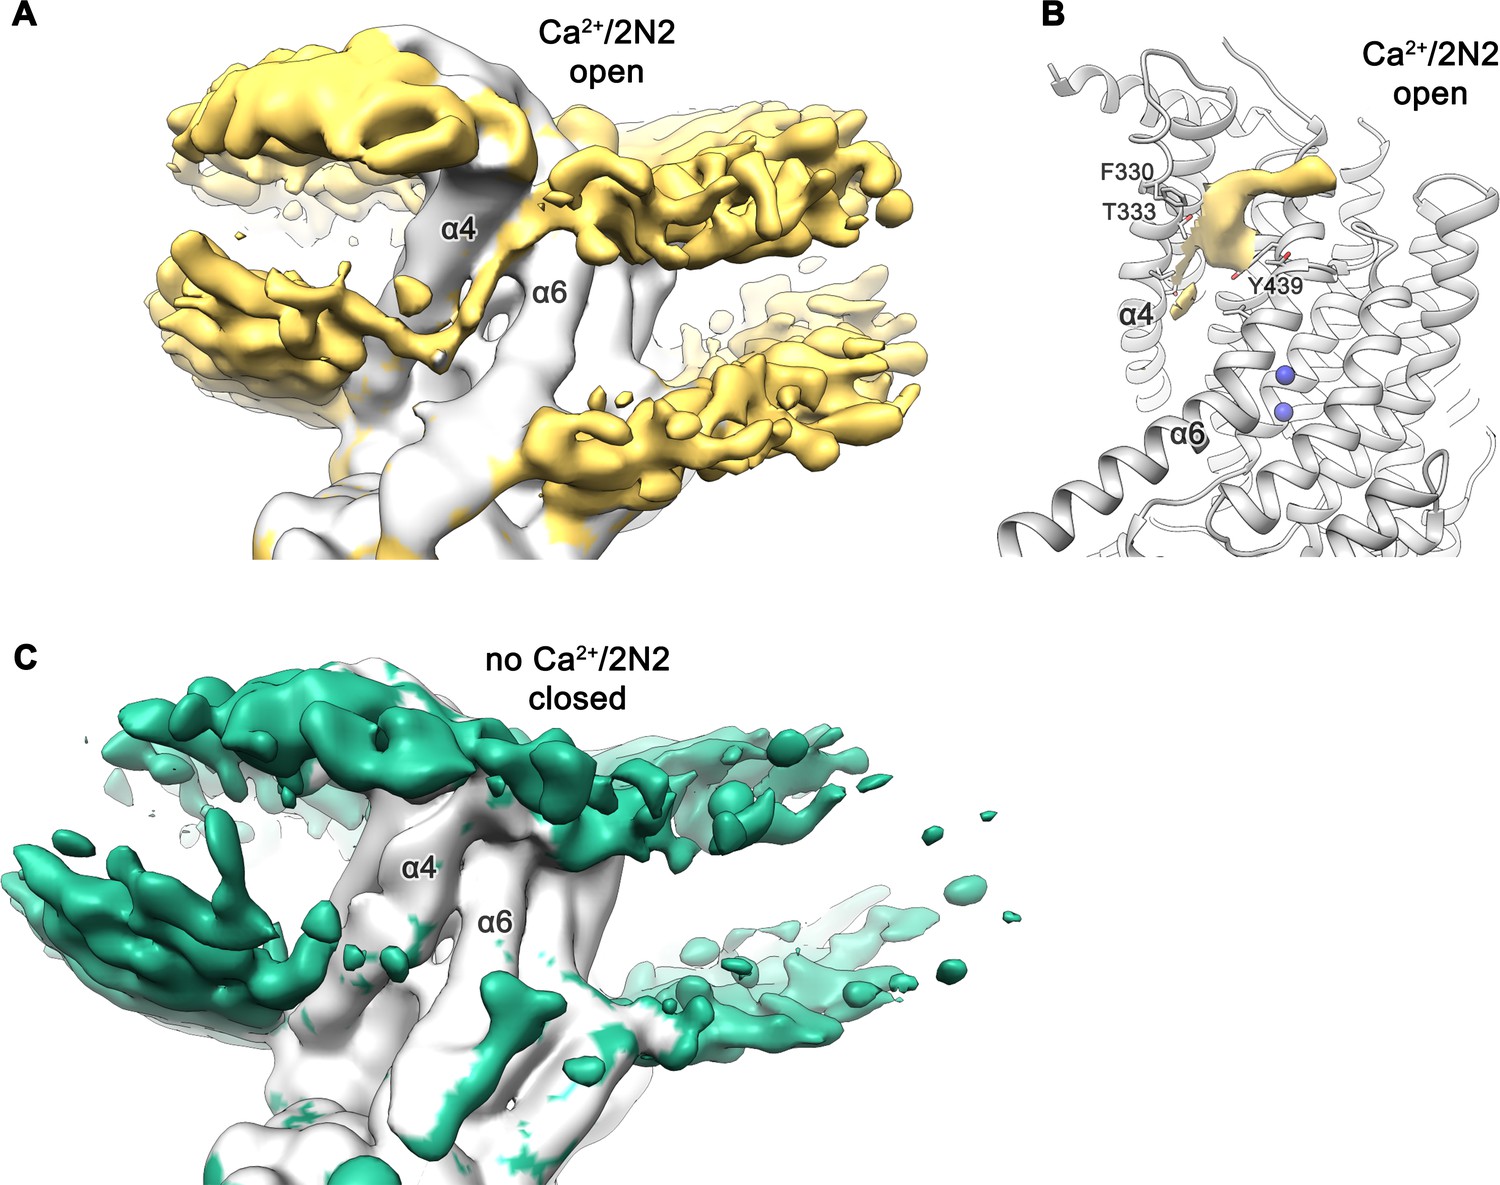
Detergent and lipid interactions.
Shown are refined and unmasked cryo-EM density maps low-pass filtered to 6 Å. (A) Map of the Ca2+-bound nhTMEM16 data in detergent contoured at 4 σ; (B,C) Map of the Ca2+-bound nhTMEM16 data in nanodiscs contoured at 3.2 and 1.6 σ; (D) Map of the Ca2+-free nhTMEM16 data in detergent contoured at 4 σ; (E and F), Map of the Ca2+-free nhTMEM16 data in nanodiscs contoured at 3.2 and 1.6 σ. The density corresponding to the detergent micelle or the nanodisc, which is composed of lipids surrounded by the 2N2 belt protein, are colored in orange, yellow, dark green and light green, respectively, density of nhTMEM16 is shown in gray. A,B,D,E show a front view of the dimer similar to Figure 1A and the subunit cavity is indicated by a white arrow. B, E, clipped maps reveal the headgroup regions of both membrane leaflets. C,F, are viewed in direction of the subunit cavity.
Figure 7 with 1 supplement
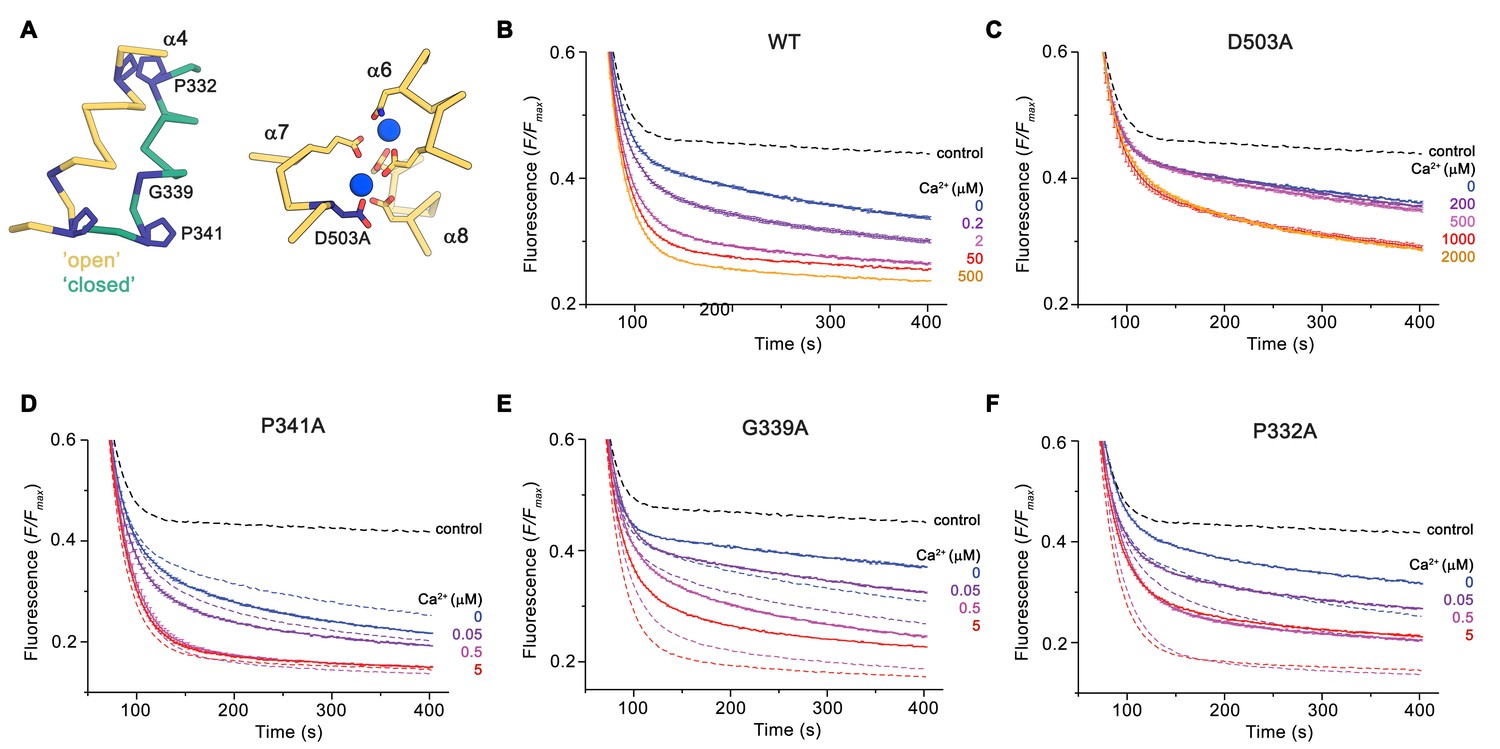
Functional properties of mutants.
(A) Regions of nhTMEM16 harboring mutated residues. Left, Cα-trace of α4 in ‘open’ (yellow) and ‘closed’ (green) conformations of Ca2+-bound nhTMEM16 in nanodiscs. Right, ion binding site with Ca2+ ions shown in blue. (B–F) Ca2+-dependence of scrambling activity in nhTMEM16-containing proteoliposomes. Traces depict sections of the fluorescence decrease of tail-labeled NBD-PE lipids after addition of dithionite at different Ca2+ concentrations. Data show averages of three technical replicates, errors are s.e.m.. Ca2+ concentrations (μM) are indicated. Full traces are displayed in Figure 7—figure supplement 1. (B) WT, (C) D503A, (D) P341A, (E) G339A, and (F) P332A. (D to F) The traces of WT reconstituted in the same batch of liposomes are shown as dashed lines in the same color as their corresponding conditions of the mutant for comparison. (B to F), The black dashed line refers to the fluorescence decay in protein-free liposomes.
Figure 7—figure supplement 1

Reconstitution efficiency.
(A) Reconstitution efficiency of nhTMEM16 mutants compared to WT (WT1, WT2, WT3) reconstituted in the same batch of solubilized lipids. For analysis, equivalent amounts of liposomes were loaded on SDS-PAGE and detected with an anti-myc antibody detecting a fusion tag on the protein. The positions of molecular weight markers (kDa) are indicated. (B–H) Traces of scrambling experiments displayed in Figure 7. Data show averages of three technical replicates, errors are s.e.m.. Ca2+-dependence of scrambling activity of WT1 (B) and D503A (C) displayed in Figure 7B and C. (D) Ca2+-dependence of scrambling activity of WT2 displayed for comparison in Figure 7D and F. (E) Ca2+-dependence of scrambling activity of WT3 displayed for comparison in Figure 7E. (F) Ca2+-dependence of scrambling activity of P341A displayed for comparison in Figure 7D. (G) Ca2+-dependence of scrambling activity of G339A displayed for comparison in Figure 7E. (H) Ca2+-dependence of scrambling activity of P332A displayed for comparison in Figure 7F. Traces depict fluorescence decrease of tail-labeled NBD-PE lipids after addition of dithionite (#) at different Ca2+ concentrations. Data show averages of three technical replicates. Ca2+ concentrations (μM) are indicated.
Figure 8 with 1 supplement
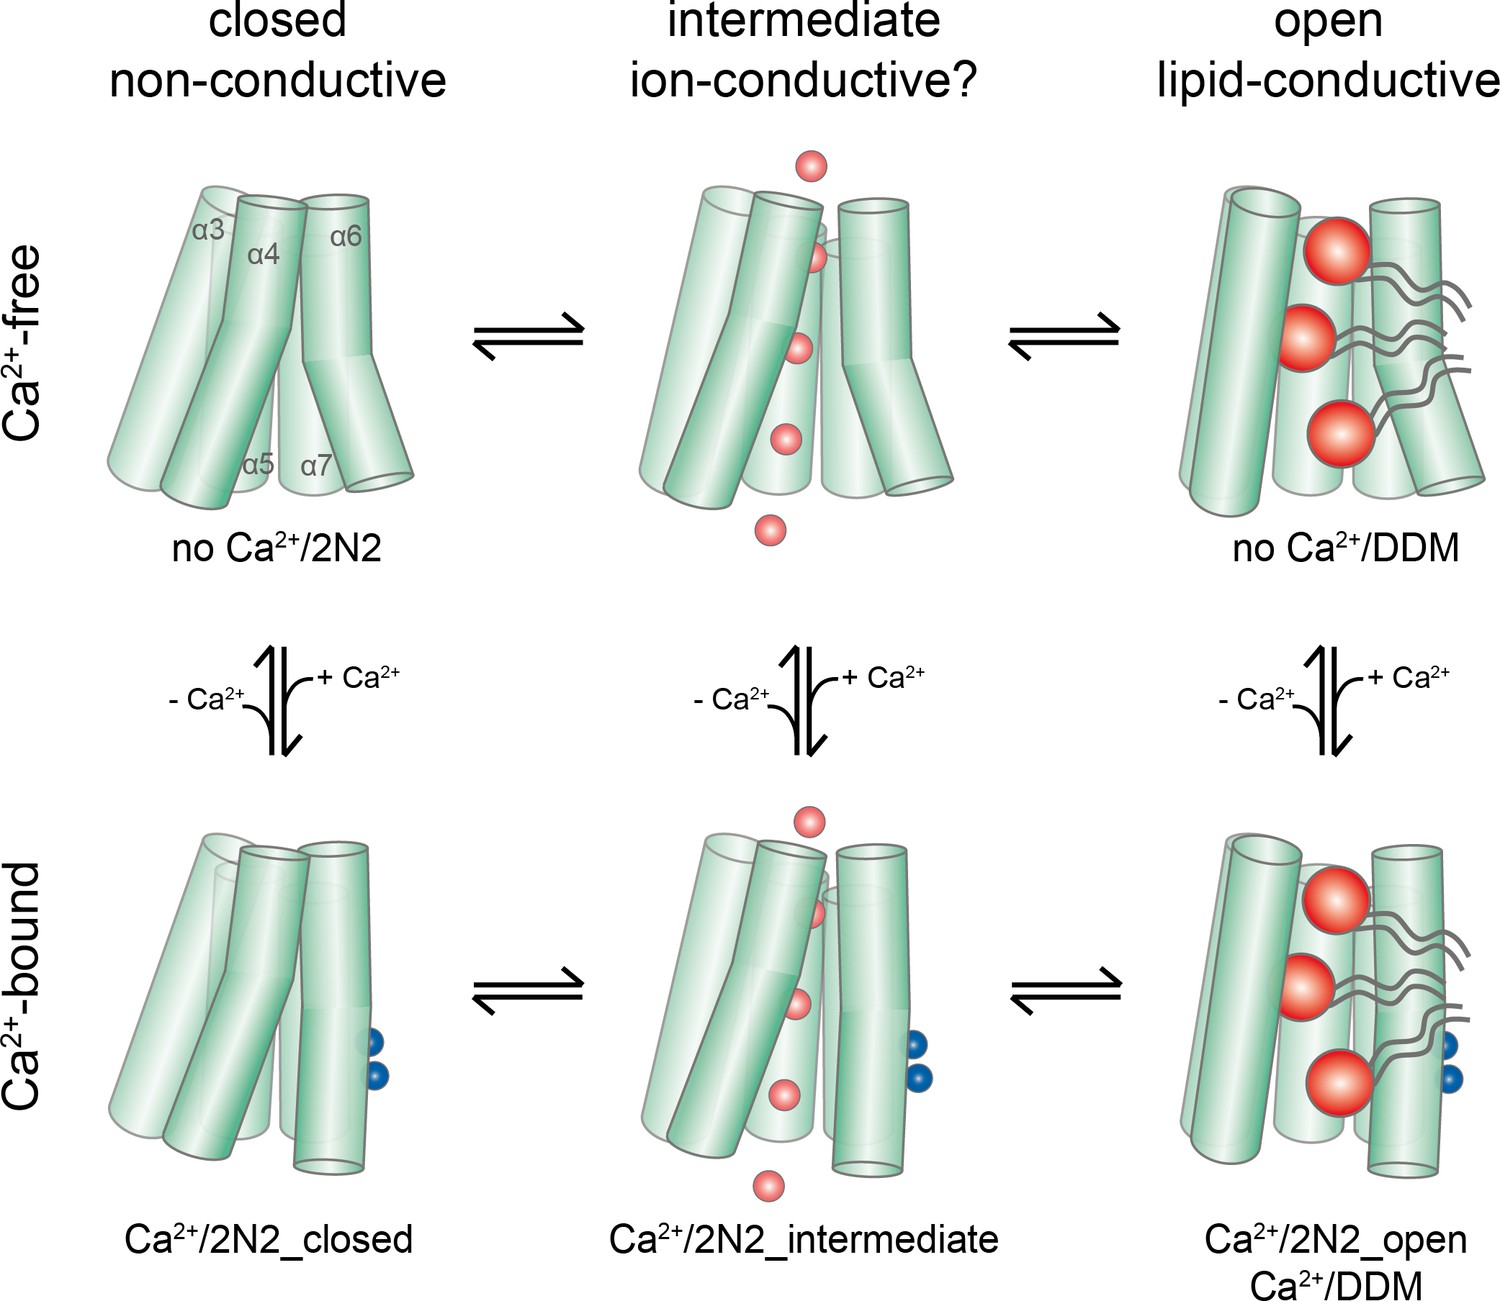
Activation mechanism.
Scheme of the stepwise activation of nhTMEM16 displaying the equilibrium of states in Ca2+-bound and Ca2+-free conditions. Conformations obtained in this study and their correspondence to distinct states are indicated. Ca2+ and permeating ions are depicted as blue and red spheres, respectively. Phospholipid headgroups are shown as red spheres and acyl chains as gray tails.
Figure 8—figure supplement 1
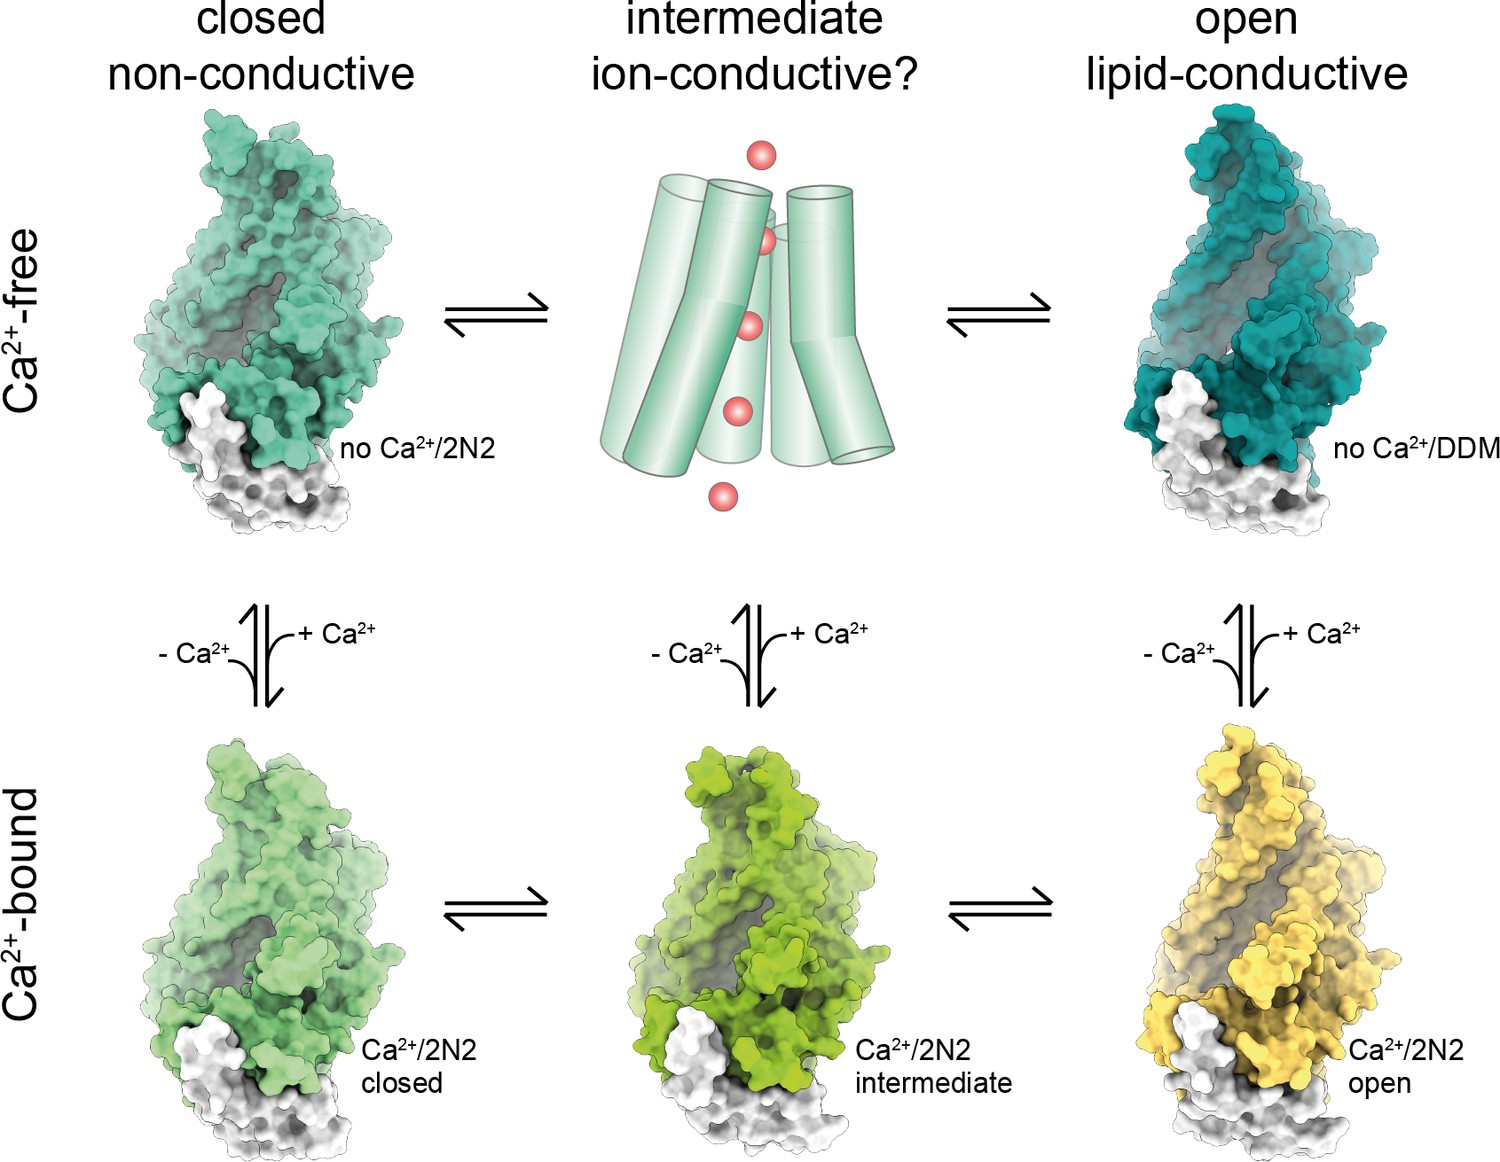
Activation mechanism.
Scheme of the stepwise activation of nhTMEM16 as shown in Figure 8 with the states displayed by the surface representation of the respective conformation.
Videos
Video 1
Conformational transitions.
Shown is a morph between distinct conformational states obtained for nhTMEM16, namely: the Ca2+-bound ‘open’ state obtained in nanodiscs; the Ca2+-bound ‘intermediate’ state obtained in lipid nanodiscs; the Ca2+-bound ‘closed’ state obtained in lipid nanodiscs; and the Ca2+-free closed state obtained in lipid nanodiscs. Shown is a view of the subunit cavity as depicted in Figure 3 and 4. Ca2+ ions are shown as blue spheres.
Video 2
Micelle and lipid distortion.
Shown are the cryo-EM density maps of nhTMEM16 obtained in detergent in complex with Ca2+ (upper left corner), in detergent in absence of Ca2+ (upper right corner), in lipid nanodiscs in complex with Ca2+ (lower left corner) and in lipid nanodiscs in absence of Ca2+ (lower right corner). The surrounding environment corresponding to the detergent micelle (upper panels) or the lipid nanodiscs (lower panels) are colored respectively, while the rest of the protein is shown in gray. Refined and unmasked cryo-EM maps were low-pass filtered to 6 Å. Transmembrane α-helices 4 and 6 are labeled at the end, indicating the position of the subunit cavity.
Tables
Table 1
Cryo-EM data collection, refinement and validation statistics.
https://doi.org/10.7554/eLife.44364.008| nhTMEM16, DDM, +Ca2+ (EMDB-4588, PDB 6QM5) | nhTMEM16, DDM, -Ca2+ (EMDB-4589, PDB 6QM6) | nhTMEM16, 2N2, -Ca2+ (EMDB-4587, PDB 6QM4) | |
|---|---|---|---|
| Data collection and processing | |||
| Microscope Camera Magnification | FEI Talos Arctica Gatan K2 Summit + GIF 49,407 | FEI Talos Arctica Gatan K2 Summit + GIF 49,407 | FEI Talos Arctica Gatan K2 Summit + GIF 49,407 |
| Voltage (kV) Exposure time frame/total (s) Number of frames per image | 200 0.15/9 60 | 200 0.15/9 60 | 200 0.15/9 60 |
| Electron exposure (e–/Å2) | 52 | 52 | 52 |
| Defocus range (μm) | −0.5 to −2.0 | −0.5 to −2.0 | −0.5 to −2.0 |
| Pixel size (Å) Box size (pixels) | 1.012 220 | 1.012 240 | 1.012 240 |
| Symmetry imposed | C2 | C2 | C2 |
| Initial particle images (no.) | 251,693 | 570,203 | 1,379,187 |
| Final particle images (no.) | 120,086 | 238,070 | 133,961 |
| Map resolution (Å) 0.143 FSC threshold | 3.64 | 3.68 | 3.79 |
| Map resolution range (Å) | 3.4–5.0 | 3.4–5.0 | 3.3–5.0 |
| Refinement | |||
| Initial model used | PDB 4WIS | 6QM5 | 6QMB |
| Model resolution (Å) FSC threshold | 3.6 | 3.7 | 3.8 |
| Model resolution range (Å) | 15–3.6 | 15–3.7 | 15–3.8 |
| Map sharpening B factor (Å2) | −126 | −147 | −150 |
| Model composition Nonhydrogen atoms Protein residues Ligands | 10874 1346 4 | 10852 1344 - | 10578 1308 - |
| B factors (Å2) Protein Ligand | 55.75 33.72 | 76.42 - | 94.09 - |
| R.m.s. deviations Bond lengths (Å) Bond angles (°) | 0.007 0.821 | 0.004 0.835 | 0.007 0.983 |
| Validation MolProbity score Clashscore Poor rotamers (%) | 1.47 4.02 0 | 1.42 4.35 0 | 1.53 4.09 0.18 |
| Ramachandran plot Favored (%) Allowed (%) Disallowed (%) | 95.92 4.08 0 | 96.74 3.26 0 | 95.17 4.83 0 |
Table 2
Cryo-EM data collection, refinement and validation statistics of the Ca2+ bound nhTMEM16 in nanodiscs.
https://doi.org/10.7554/eLife.44364.016| nhTMEM16, 2N2, +Ca2+open (EMDB-4592, PDB 6QM9) | nhTMEM16, 2N2, +Ca2+intermediate closed (EMDB-4593, PDB 6QMA) | nhTMEM16, 2N2, +Ca2+closed (EMDB-4594, PDB 6QMB) | |
|---|---|---|---|
| Data collection and processing | |||
| Microscope Camera Magnification | FEI Talos Arctica Gatan K2 Summit + GIF 49,407 | ||
| Voltage (kV) Exposure time frame/total (s) Number of frames per image | 200 0.15/9 60 | ||
| Electron exposure (e–/Å2) | 52 | ||
| Defocus range (μm) | −0.5 to −2.0 | ||
| Pixel size (Å) Box size (pixels) | 1.012 240 | ||
| Symmetry imposed | C2 | ||
| Initial particle images (no.) | 2,440,110 | ||
| Final particle images (no.) | 71,175 | 33,310 | 41,631 |
| Map resolution (Å) 0.143 FSC threshold | 3.57 | 3.68 | 3.57 |
| Map resolution range (Å) | 3.4–5 | 3.6–5 | 3.4–5 |
| Refinement | |||
| Initial model used | 6QM5 | 6QMB | 6QM5 |
| Model resolution (Å) FSC threshold | 3.6 | 3.7 | 3.6 |
| Model resolution range (Å) | 15–3.6 | 15–3.7 | 15–3.6 |
| Map sharpening B factor (Å2) | −114 | −96 | −95 |
| Model composition Nonhydrogen atoms Protein residues Ligands | 10878 1346 4 | 10714 1324 4 | 10696 1322 4 |
| B factors (Å2) Protein Ligand | 77.93 54.34 | 84.86 57.57 | 88.53 67.10 |
| R.m.s. deviations Bond lengths (Å) Bond angles (°) | 0.005 0.880 | 0.006 0.872 | 0.008 0.858 |
| Validation MolProbity score Clashscore Poor rotamers (%) | 1.36 3.74 0 | 1.38 4.69 0.18 | 1.42 3.90 0 |
| Ramachandran plot Favored (%) Allowed (%) Disallowed (%) | 96.82 3.18 0 | 97.23 2.77 0 | 96.38 3.62 0 |
Key resources table
| Reagent type (species) or resource | Designation | Source or reference | Identifiers | Additional information |
|---|---|---|---|---|
| Antibody | Mouse monoclonal Anti-c-Myc | Millipore Sigma | Cat#M4439; Clone#9E10 | (1:5000) |
| Antibody | Peroxidase Affinipuregoat anti-mouse IgG | Jackson Immunoresearch | Cat#115-035-146 | (1:10000) |
| Chemical compound, drug | n-dodecyl-β-d-maltopyranoside(DDM), Solgrade | Anatrace | Cat#D310S | |
| Chemical compound, drug | Water for molecular biology | Millipore | H20MB1006 | |
| Chemical compound, drug | Calcium nitratetetrahydrate | Millipore Sigma | Cat#C4955 | |
| Chemical compound, drug | Sodium chloride | Millipore Sigma | Cat#71380 | |
| Chemical compound, drug | Magnesium chloride | Fluka | Cat#63065 | |
| Chemicalcompound, drug | HEPES | Millipore Sigma | Cat#H3375 | |
| Chemicalcompound, drug | Ethyleneglycol-bis(2-aminoethylether)-N,N,N′,N′-tetraacetic acid | Millipore Sigma | Cat#03777 | |
| Chemicalcompound, drug | Ethylenediamin etetraacetic acid | Millipore Sigma | Cat#E6758 | |
| Chemical compound, drug | cOmplete, EDTA-freeProtease Inhibitor Cocktail | Roche | Cat#5056489001 | |
| Chemical compound, drug | Biotin | Millipore Sigma | Cat#B4501 | |
| Chemical compound, drug | D-desthiobiotin | Millipore Sigma | Cat#D1411 | |
| Chemical compound, drug | Glycerol | Millipore Sigma | Cat#G5516 | |
| Chemical compound, drug | 1-palmitoyl-2-oleoyl-glycero-3-phosphocholine | Avanti Polar Lipids, Inc | Cat#850457C | |
| Chemical compound, drug | 1-palmitoyl-2-oleoyl-sn-glycero-3-phospho-(1'-rac-glycerol) | Avanti Polar Lipids, Inc | Cat#840457C | |
| Chemical compound, drug | Diethyl ether | Millipore Sigma | Cat#296082 | |
| Chemicalcompound, drug | E. coli polar lipid extract | Avanti Polar Lipids, Inc | Cat#100600C | |
| Chemicalcompound, drug | Egg PC, 95% | Avanti Polar Lipids, Inc | Cat#131601C | |
| Chemical compound, drug | 18:1-06:0 NBD-PE | Avanti Polar Lipids, Inc | Cat#810155C | |
| Chemicalcompound, drug | Potassium chloride | Millipore Sigma | Cat#746436 | |
| Chemicalcompound, drug | CHAPS | Millipore Sigma | Cat#C3023 | |
| Chemical compound, drug | Sodium dithionite | Millipore Sigma | Cat#157953 | |
| Chemical compound, drug | Yeast nitrogen base without amino acids | Millipore Sigma | Cat#Y0626 | |
| Chemicalcompound, drug | Yeast SyntheticDrop-out MediumSupplements without uracil | Millipore Sigma | Cat#Y1501 | |
| Chemicalcompound, drug | D-Glucose | Applichem | Cat#A1422 | |
| Chemical compound, drug | Galactose | Millipore Sigma | Cat#G0625 | |
| Chemical compound, drug | Lithium acetate | Millipore Sigma | Cat#L4158 | |
| Chemical compound, drug | PEG3350 | Millipore Sigma | Cat#88276 | |
| Peptide,recombinant protein | DNAse I | AppliChem | A3778-0500 | |
| Peptide, recombinant protein | HRV 3C protease | Raimund Dutzler laboratory | ||
| Commercial assay or kit | Pierce StreptavidinPlus UltraLink Resin | Thermo Fisher Scientific | Cat#53117 | |
| Commercial assay or kit | Bio-Beads SM-2 Adsorbents | Bio-Rad | Cat# 1523920 | |
| Commercialassay or kit | Amicon Ultra-4–100 KDa cutoff | EMD Millipore | Cat#UFC8100 | |
| Commercialassay or kit | 0.22 μm Ultrafree-MC Centrifugal Filter | EMD Millipore | Cat#UFC30GV | |
| Commercialassay or kit | Strep-Tactin Superflow high capacity | IBA Lifesciences | Cat#2-1208-010 | |
| Commercial assay or kit | Superdex 200 10/300 GL | GE Healthcare | Cat# 17-5175-01 | |
| Commercial assay or kit | Superose 6 10/300 GL | GE Healthcare | Cat#17-5172-01 | |
| Strain, strainbackground(S. cerevisiae) | FGY217 | David Drew laboratory | ||
| Recombinant DNA reagent | nhTMEM16 open reading frame | GenScript | PubMed accession number XM_003045982 | |
| RecombinantDNA reagent | Yeast expressionvector withN-terminal streptavidinbinding peptide,Myc tag and 3C protease cleavage site | Raimund Dutzler laboratory | ||
| Recombinant DNA reagent | Membrane scaffoldprotein (MSP) 2N2 | Stephen Sligar laboratory | Addgene:Cat#29520 | |
| Software, algorithm | Online WEBMAXC calculator | Bers et al., 2010 | http://maxchelator.stanford.edu/webmaxc/webmaxcS.htm | |
| Software, algorithm | Focus 1.1.0 | Biyani et al. (2017) | https://focus.c-cina.unibas.ch/about.php | |
| Software,algorithm | MotionCorr2 1.1.0 | Zheng et al. (2017) | http://msg.ucsf.edu/em/software/motioncor2.html | |
| Software, algorithm | CTFFIND 4.1 | Rohou and Grigorieff, 2015 | http://grigoriefflab.janelia.org/ctf | |
| Software, algorithm | Relion v 2.1 and 3.0 | Kimanius et al., 2016 | https://www2.mrc-lmb.cam.ac.uk/relion/ | |
| Software, algorithm | Phenix 1.14 | Adams et al., 2010 | http://phenix-online.org/ | |
| Software, algorithm | Coot 0.8.9.1 | Emsley and Cowtan, 2004 | https://www2.mrc-lmb.cam.ac.uk/personal/pemsley/coot/ | |
| Software, algorithm | Pymol 2.0 | Schrodinger LLC | https://pymol.org/2/ | |
| Software, algorithm | Chimera 1.12 | Pettersen et al., 2004 | https://www.cgl.ucsf.edu/chimera/ | |
| Software, algorithm | ChimeraX 0.6 | Goddard et al., 2018 | https://www.rbvi.ucsf.edu/chimerax/ | |
| Other | Whatman Nuclepore Track-Etched Membranes diam. 19 mm, pore size 0.4 μm, polycarbonate | Millipore Sigma | Cat#WHA800282 | |
| Other | HPL6 | Maximator | ||
| Other | Fluoromax 4 | Horiba | ||
| Other | 300 mesh Au 1.2/1.3 cryo-EM grids | Quantifoil | Cat#N1-C14nAu30-01 |
Additional files
-
Transparent reporting form
- https://doi.org/10.7554/eLife.44364.027
Download links
A two-part list of links to download the article, or parts of the article, in various formats.
Downloads (link to download the article as PDF)
Open citations (links to open the citations from this article in various online reference manager services)
Cite this article (links to download the citations from this article in formats compatible with various reference manager tools)
Stepwise activation mechanism of the scramblase nhTMEM16 revealed by cryo-EM
eLife 8:e44364.
https://doi.org/10.7554/eLife.44364


