Genetic therapy in a mitochondrial disease model suggests a critical role for liver dysfunction in mortality
- Department of Biochemistry and Molecular Biology, Mayo Clinic College of Medicine, United States
- Department of Embryology, Carnegie Institution for Science, United States
- Division of Cardiovascular Diseases, Department of Medicine, Mayo Clinic College of Medicine, United States
- Biochemical Genetics Laboratory, Department of Laboratory Medicine and Pathology, Mayo Clinic College of Medicine, United States
Figures
Figure 1

GBT mutagenesis generates a novel zebrafish model of LSFC.
(A) Schematic of human and zebrafish LRPPRC proteins with highlighted PPR domains (denoted by P). (B) Schematic of the integration event of GBT vector RP2.1 with 5’ protein trap and 3’ exon trap cassettes. The RP2.1 cassette was integrated into the intronic region 22 of the lrpprc genomic locus on chromosome 13. ITR, inverted terminal repeat; SA, loxP; Cre recombinase recognition sequence, splice acceptor; *mRFP’ AUG-less mRFP sequence; poly (A) +, polyadenylation signal; red-octagon, extra transcriptional terminator and putative border element; β-act, carp beta-actin enhancer, SD, splice donor.
Figure 2 with 3 supplements
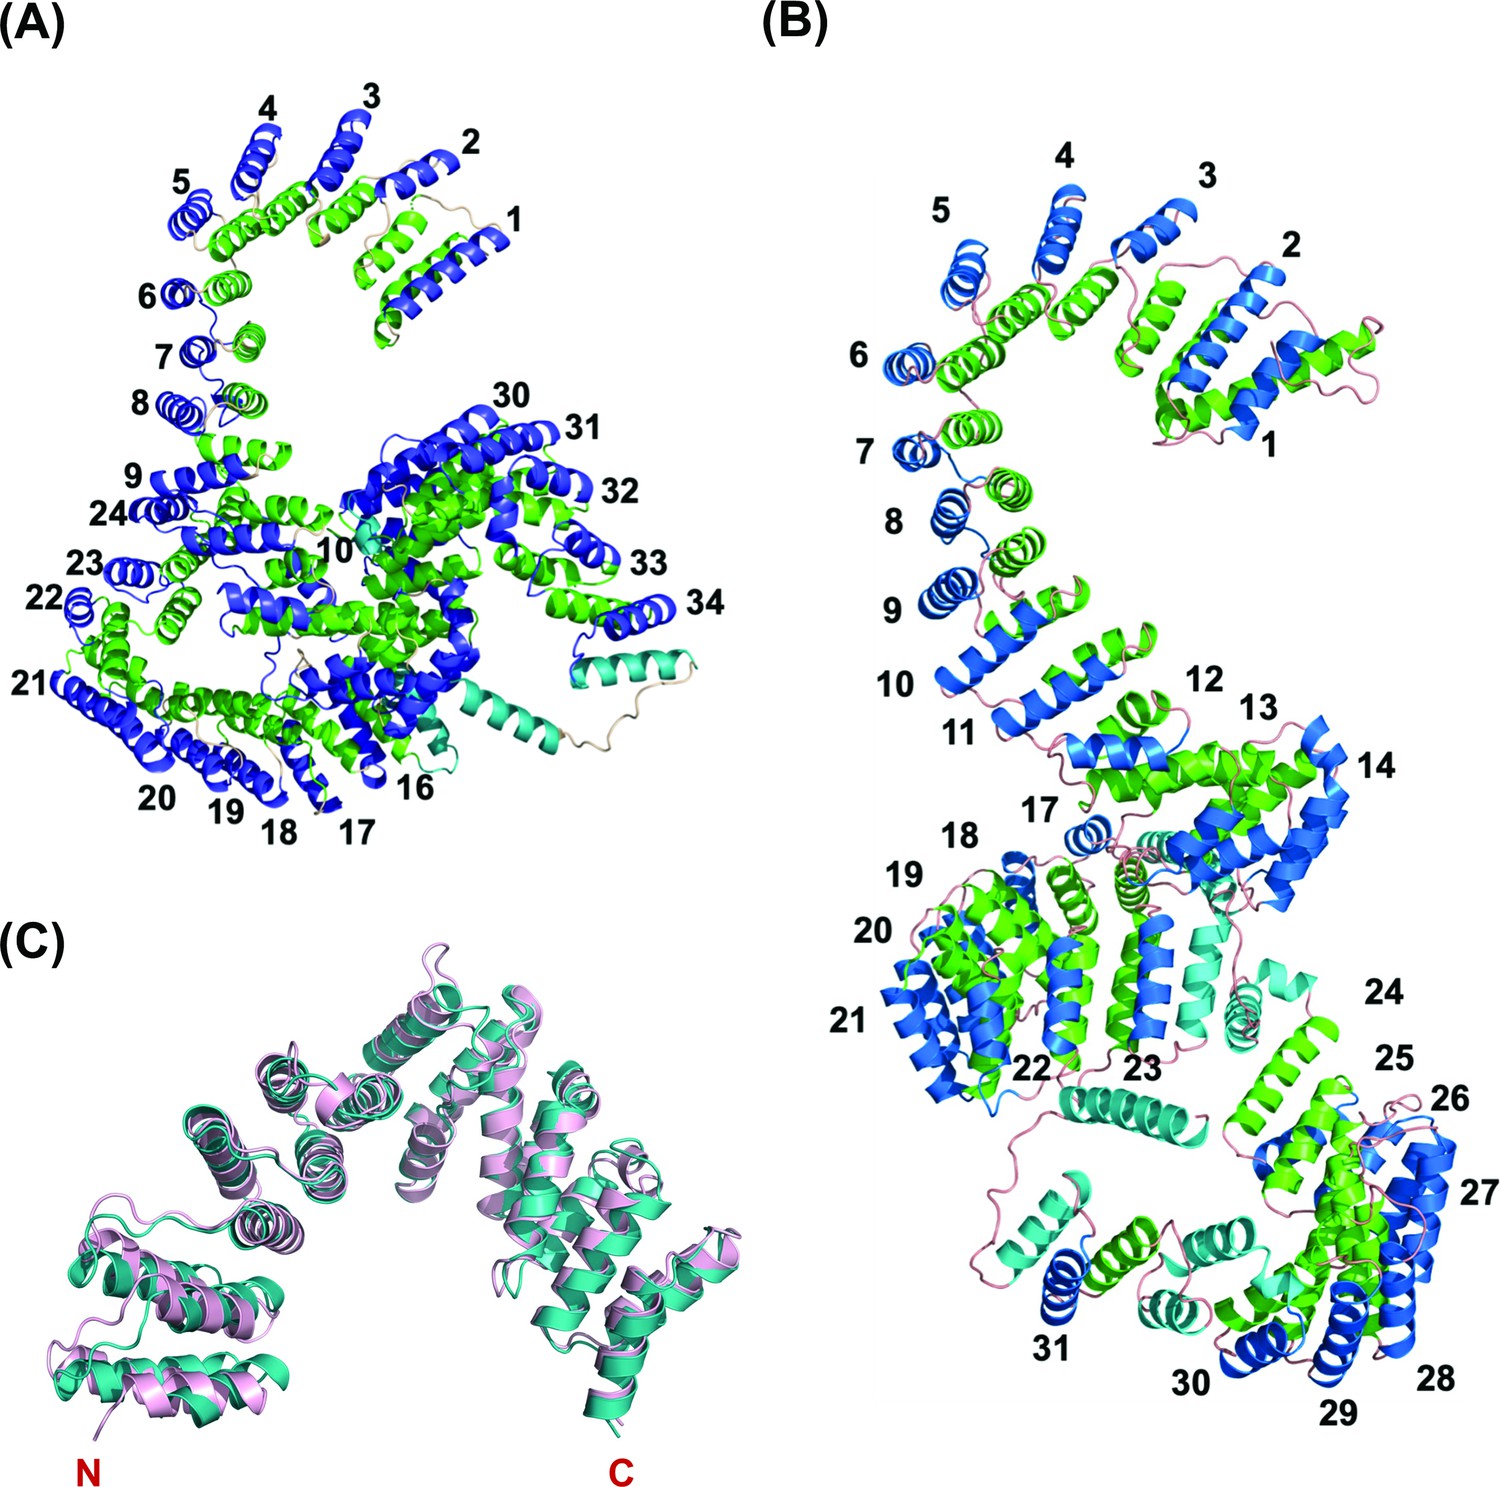
Overall predicted structure of human and zebrafish LRPPRC and its C-terminus comparison with human LRPPRC.
(A) The predicted structure of mature human LRPPRC comprises 34 likely PPR repeats. (B) Overall predicted structure of mature zebrafish Lrpprc comprises 31 likely PPR repeats. The two helices within each repeat are colored green and blue. The predicted PPR motifs are numbered from the N-terminal of the protein. The functionally undefined regions and C-terminal helix were colored cyan. (C) Structural superimposition of the C-terminus part (SEC1 domain) of human and zebrafish Lrpprc. The light pink and teal colors represent human and zebrafish Lrpprc respectively.
Figure 2—figure supplement 1
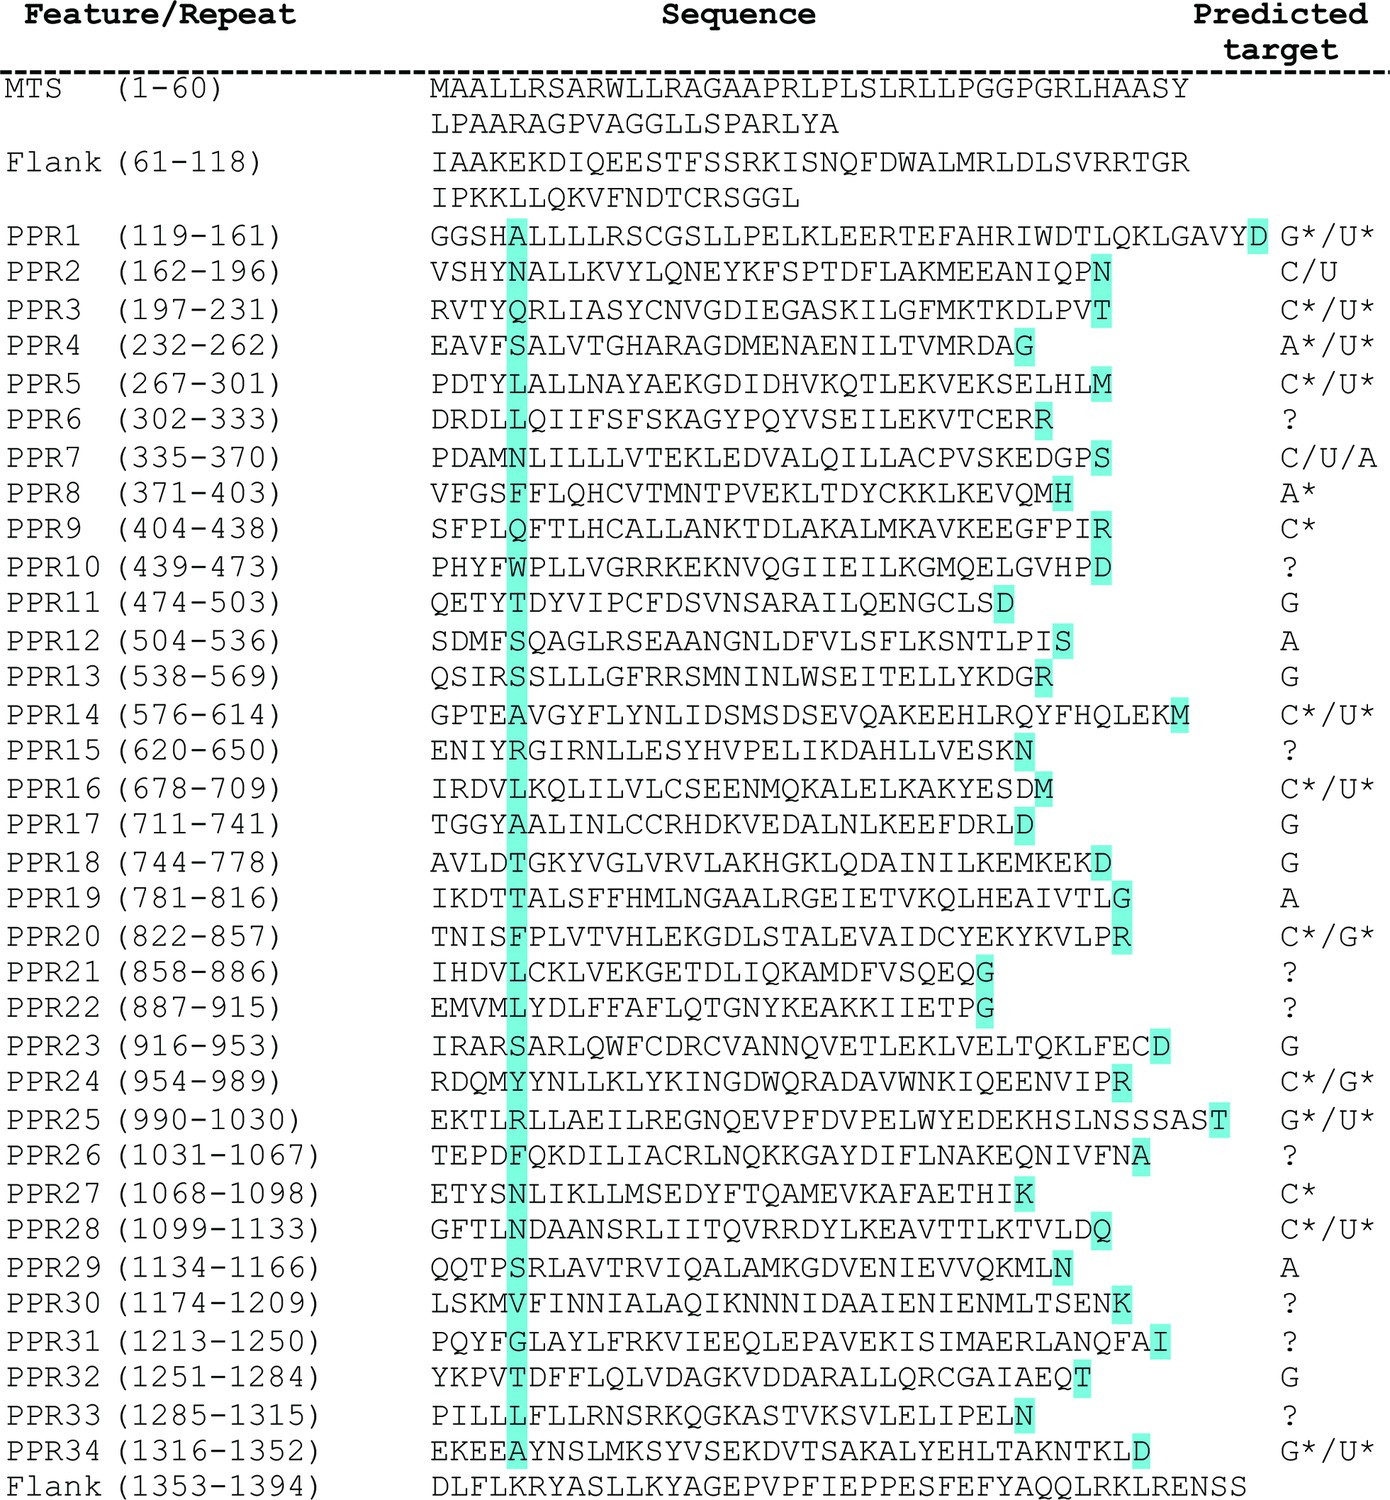
Domain organization of human LRPPRC predicted from structural and sequence analysis.
Structure-based prediction of PPR motifs. PPR sequences and comprehensive residues are represented on the left. The cyan color highlighted amino acids specify the RNA binding of PPR motifs. The predicted target ribonucleotides for each motif are presented on the right. The targets with and without the star marks are high confidence and speculative predictions, respectively. We put the corresponding question mark sign where the prediction for the PPR motif was not sure.
Figure 2—figure supplement 2

Domain organization of zebrafish Lrpprc predicted from structural and sequence analysis.
(A) Schematic representation of the PPR motifs and sequence homology domain structure of zebrafish Lrpprc. The homology domains are predicted by comparing the zebrafish Lrpprc sequence against multiple databases. The structural analysis predicted that in GBT0235 mutants, truncated Lrpprc had the insertion of mRFP towards the end of PPR motif 17. (B) Structure-based prediction of PPR motifs. PPR sequences and comprehensive residues are represented on the left. The cyan color highlighted amino acids specify the RNA binding of PPR motifs. The predicted target ribonucleotides for each motif are presented on the right. The targets with and without the star marks are high confidence and speculative predictions, respectively. We put the corresponding question mark sign where the prediction for the PPR motif was not sure. The italicized motif was highly degenerate and may consist of a pair of PPRs.
Figure 2—figure supplement 3
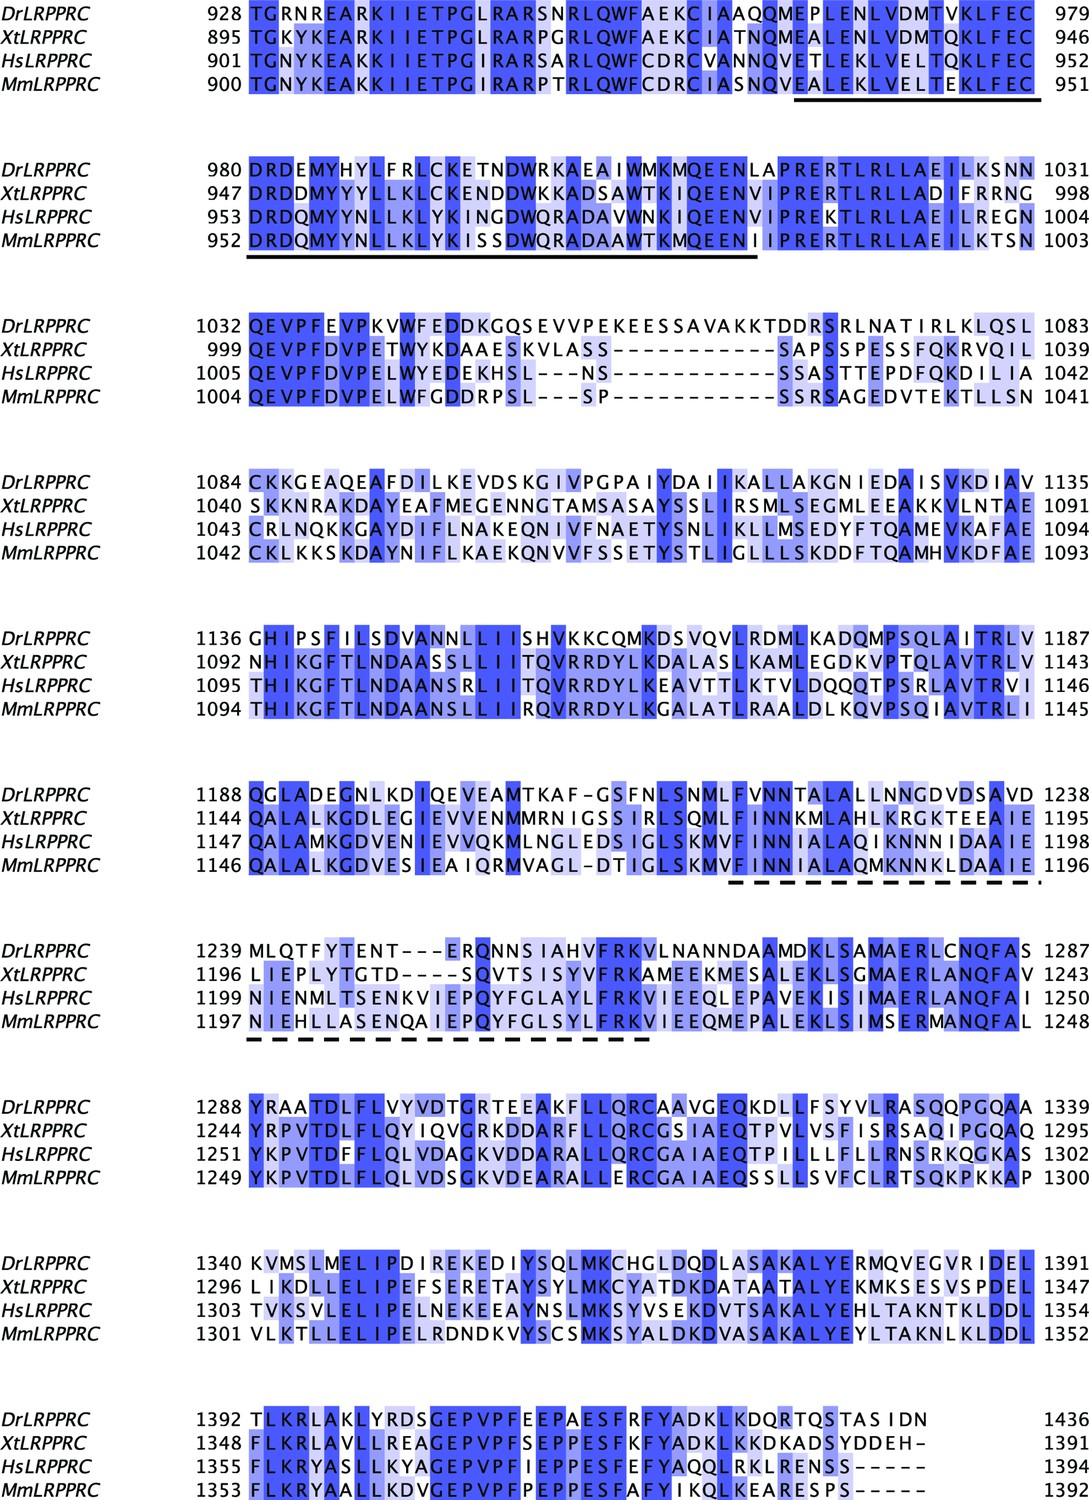
Sequence alignment of SEC1 domain of LRPPRC from different model organisms.
Sequence conservation was represented with a Percentage Identity color code (percentage abundance of aligned residues in each column). Species abbreviations used: Dr-Danio rerio, Xt-Xenopus tropicalis, Hs-Homo sapiens, and Mm-Mus musculus. The DUF2517 and EAD11 homology domains were underlined by solid and dotted lines, respectively.
Figure 3 with 1 supplement
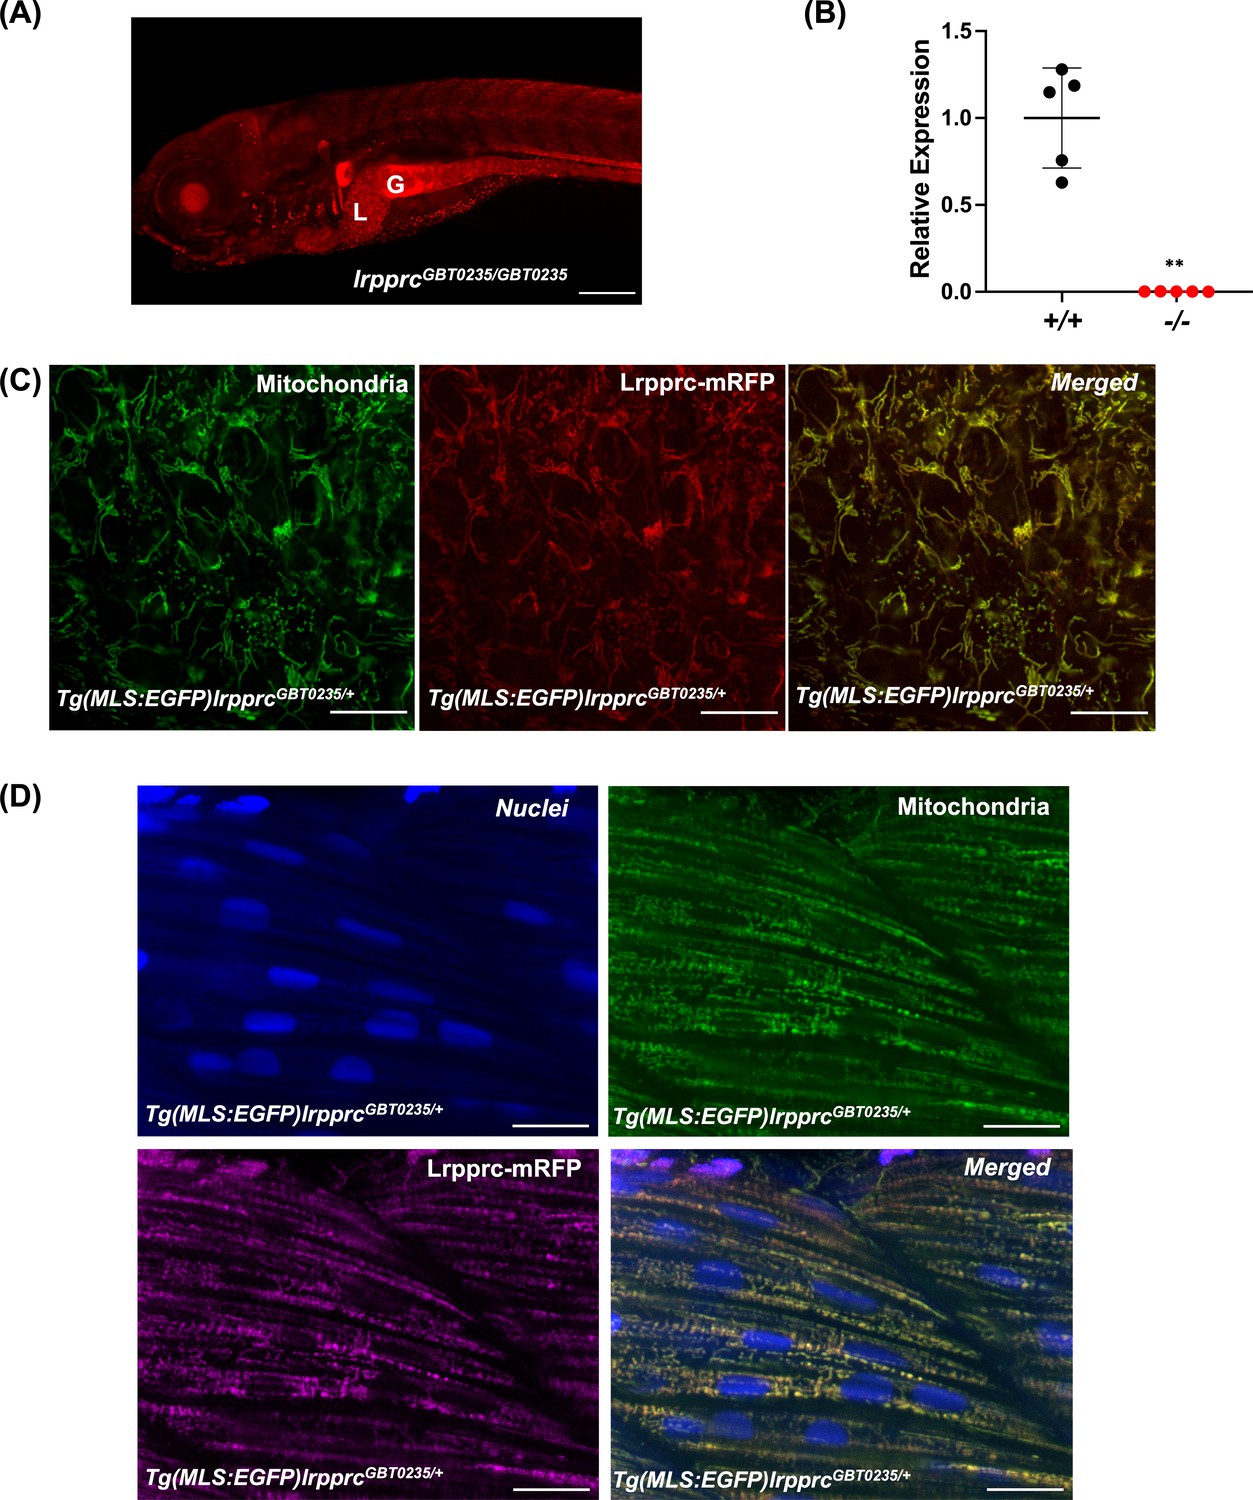
Spatiotemporal expression of Lrpprc-mRFP in GBT0235 mutants.
(A) Representative images of 6 dpf lrpprcGBT0235/GBT0235 with RFP expression in the liver and gut (magnification-5×; scale-bar: 200 µm). (B) Relative expression of lrpprc transcript in lrpprc+/+ and homozygous mutant larvae, lrpprc-/- (P-value = 0.0015). p-value was determined using the unpaired t-test. Each data point represents a biological replicate (N=5) (Figure 3—source data 1). (C) Mitochondrial network marked by EGFP in the caudal fin was observed to be overlapping with truncated Lrpprc:mRFP fusion protein in 2 dpf Tg(MLS:EGFP)lrpprcGBT0235/+ embryo (scale bar: 15 µm). (D) RFP from truncated Lrpprc:mRFP fusion protein was observed to be overlapped with EGFP in mitochondria present in myocytes of skeletal muscle region in 2 dpf Tg(MLS:EGFP)lrpprcGBT0235/+ embryo injected with NLS:TagBFP RNA. Nuclei were marked by TagBFP protein (scale-bar: 15 µm).
-
Figure 3—source data 1
Numeric data for the relative expression of lrpprc transcript in lrpprc+/+ and homozygous mutant larvae, lrpprc-/-.
- https://cdn.elifesciences.org/articles/65488/elife-65488-fig3-data1-v3.xlsx
Figure 3—figure supplement 1
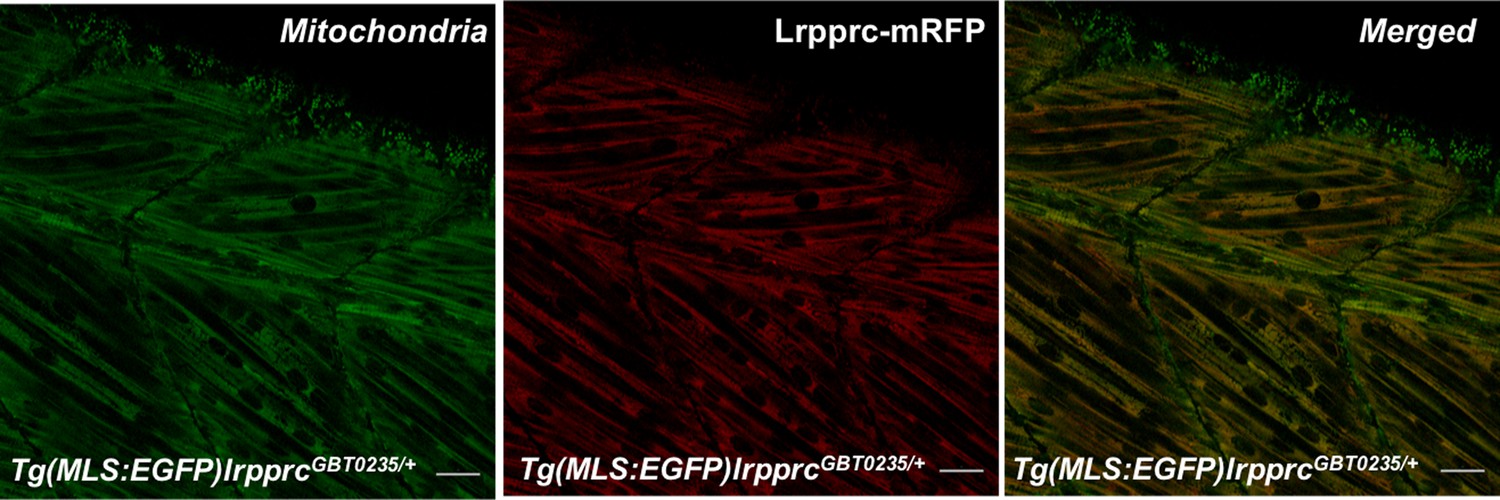
Lrpprc-mRFP localizes to the mitochondria in the zebrafish mutants.
4 dpf Tg(MLS:EGFP)lrpprcGBT0235/+ was used to observe the subcellular localization of the Lrpprc-mRFP protein in the myocytes from the skeletal muscle region (magnification 63×; scale bar: 20 µm).
Figure 4 with 1 supplement
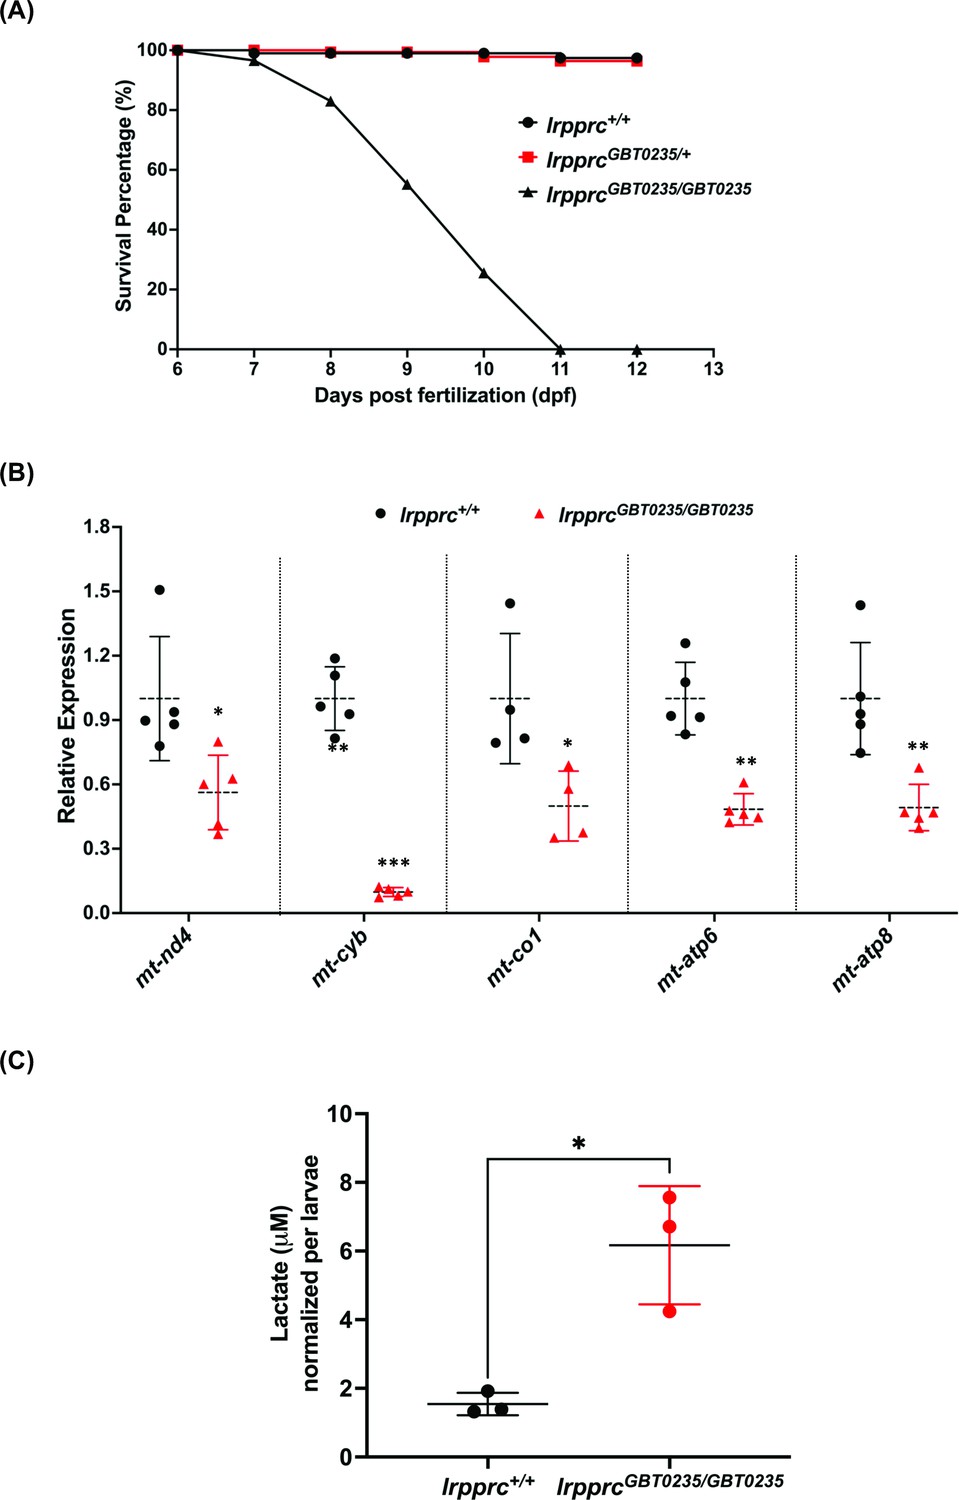
lrpprcGBT0235/GBT0235 mutants recapitulate the hallmarks of LSFC.
(A) Survival percentage of lrpprc+/+, lrpprcGBT0235/+, and lrpprcGBT0235/GBT0235. Data is represented from independent experiments (N=5 pairs) (Figure 4—source data 1) (B) Relative expression of mtDNA transcripts in the lrpprcGBT0235/GBT0235 and lrpprc+/+ assessed by qRT-PCR. Mitochondrial transcripts were normalized to eef1a1l1 transcript levels. The black circle represents wild-type and the red triangle represents homozygous mutants. Each data point represents embryos from the different clutch. Error bars are represented as SD (*: p-value < 0.05, **: p-value < 0.01, ***: p-value < 0.001). p-Values were determined by unpaired t-test. p-values (mt-nd4=0.0248; mt-cyb=0.0001; mt-co1=0.0371; mt-atp6=0.0011; mt-atp8=0.0089). (Figure 4—source data 1) (C) Relative lactate levels in the whole-body lysates of wild-type and lrpprc homozygous siblings. Lactate levels were normalized to the number of larvae. Error bars are represented as SD (*: p-value = 0.0392). p-Value was determined using the unpaired t-test. (Figure 4—source data 1).
-
Figure 4—source data 1
Numeric data for the survival percentage, relative expression of mtDNA transcripts and relative lactate levels in lrpprc homozygous mutants.
A.Data for the survival percentage of lrpprc+/+, lrpprcGBT0235/+ and lrpprcGBT0235/GBT0235. B. Numeric data for the relative expression of mitochondrial encoded transcripts in lrpprc+/+ and homozygous mutant larvae, lrpprcGBT0235/GBT0235. C. Data for lactate measurements in lrpprc+/+ and lrpprcGBT0235/GBT0235.
- https://cdn.elifesciences.org/articles/65488/elife-65488-fig4-data1-v3.xlsx
Figure 4—figure supplement 1
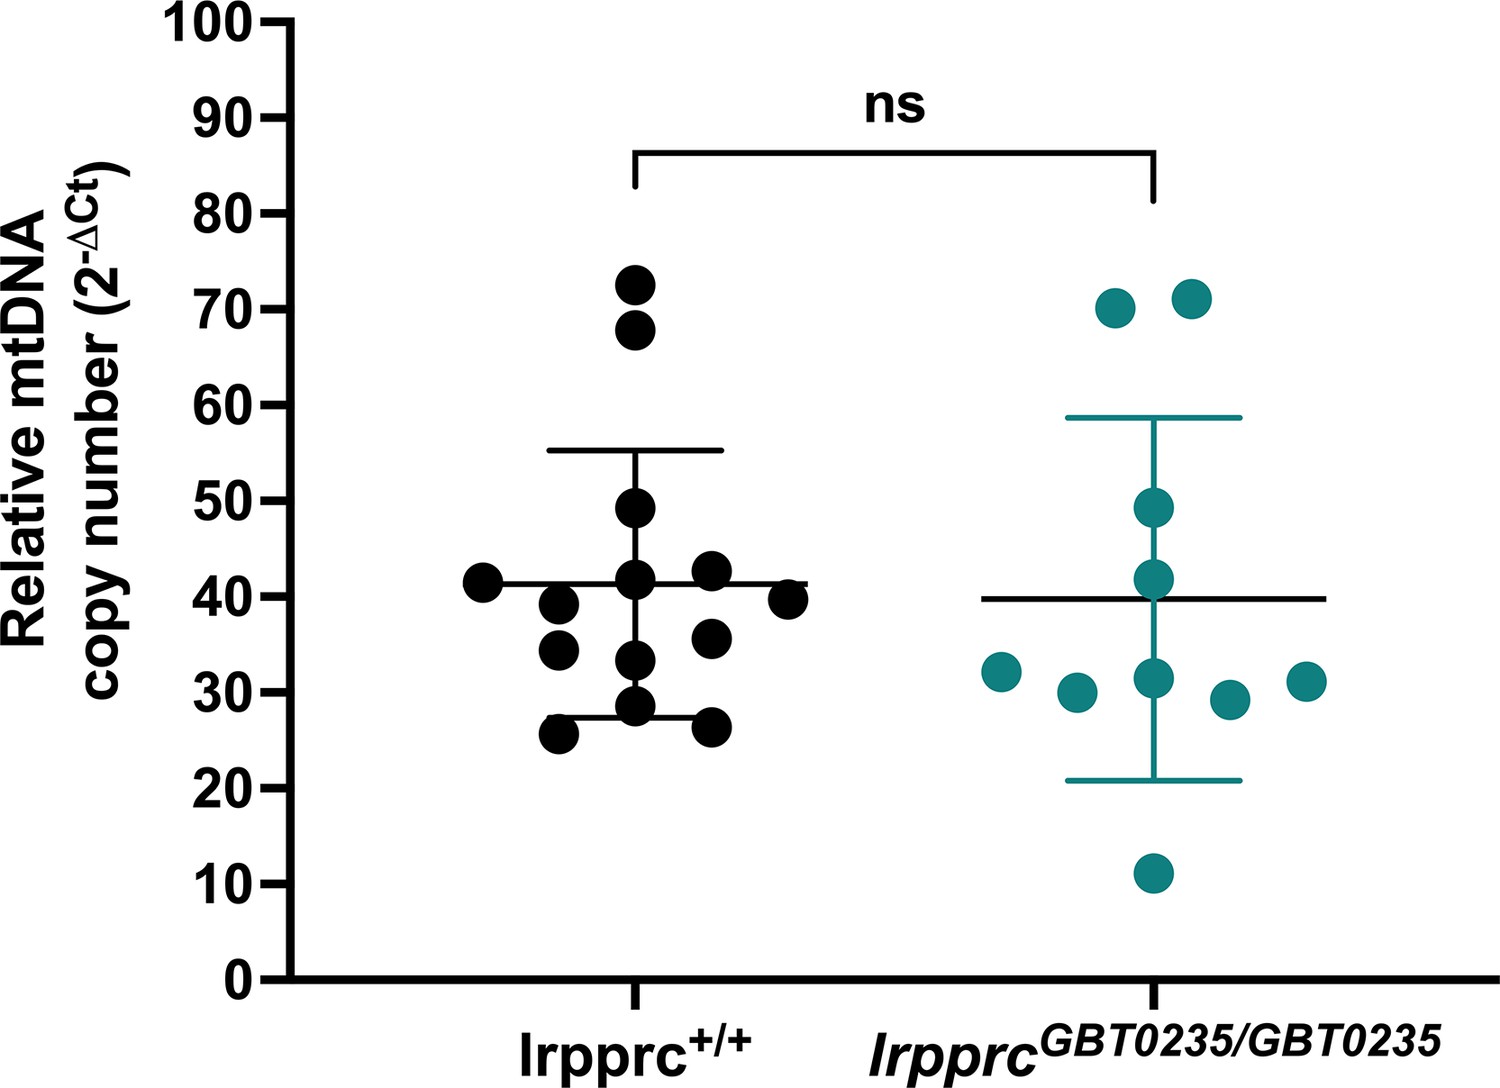
Relative mtDNA copy number in lrpprc homozygous mutants: No significant change was observed in the homozygous mutants as compared to wild-type siblings (lrpprc+/+ vs lrpprcGBT0235/GBT0235; p-value = 0.8263).
Each data point represents a genotyped individual animal. mt-nd1 and polg were used as mitochondrial and nuclear control respectively. p-Value was estimated by the unpaired t-test. Error bars represent the standard deviation (Figure 4—source data 1).
Figure 5 with 2 supplements
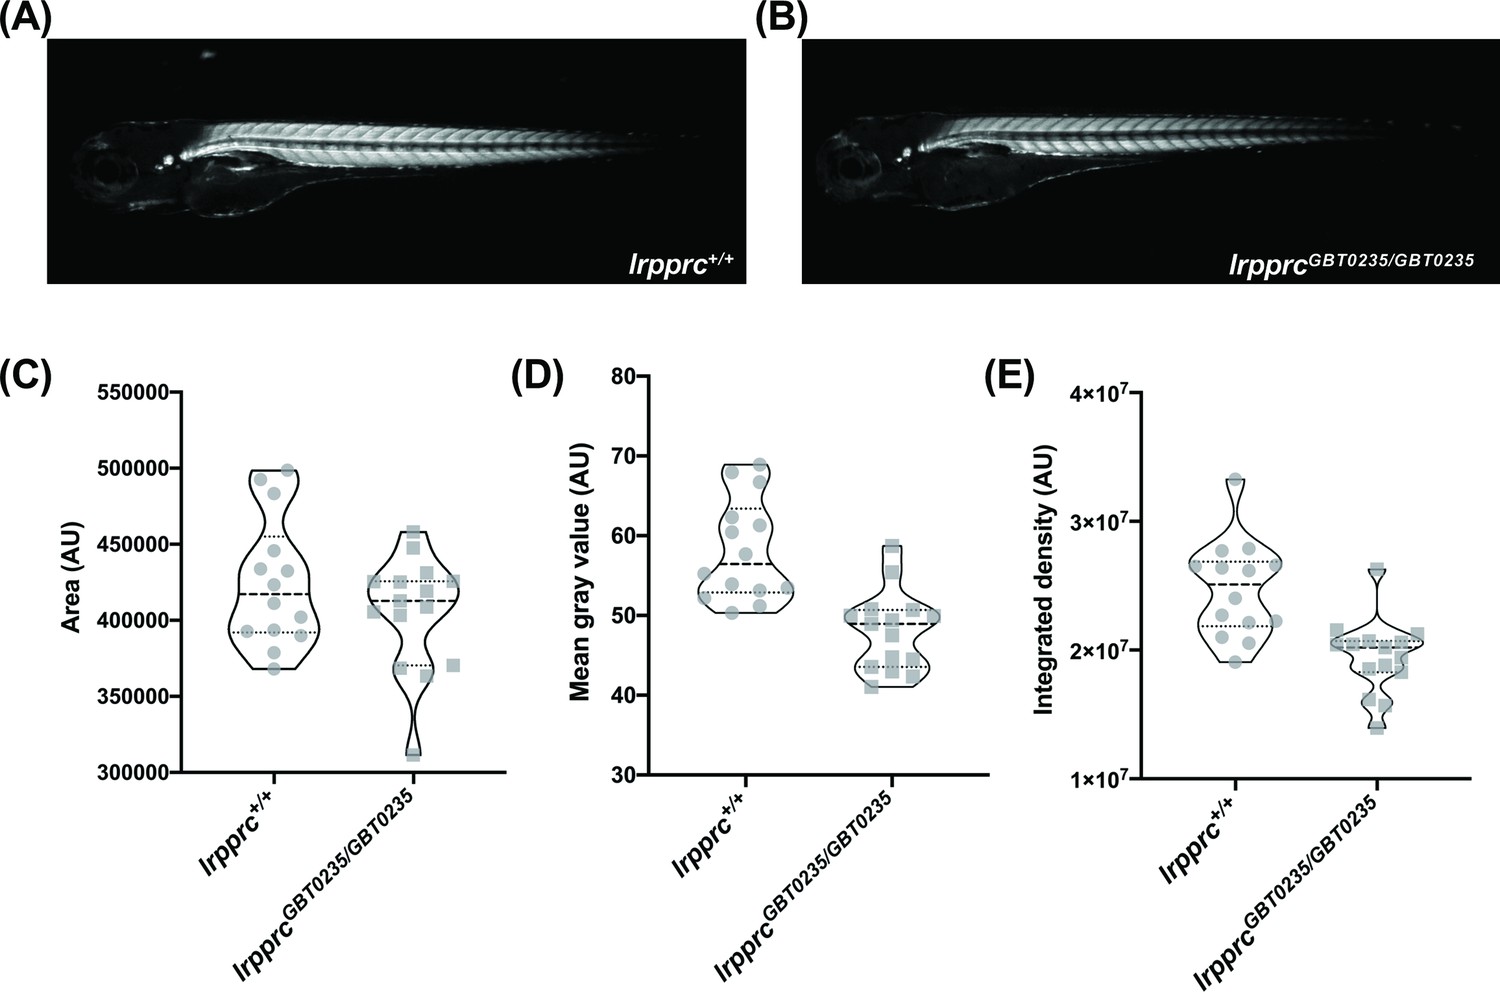
lrpprcGBT0235/GBT0235 mutants display decreased birefringence.
(A–B) Representative Birefringence images of lrpprc+/+ (A) and lrpprcGBT0235/GBT0235 mutants (B). (C–E) The images and graphs in the figure show the birefringence area of the region of interest (ROI) (C), mean gray value (D), and integrated density (E) between lrpprc+/+ and lrpprcGBT0235/GBT0235 mutants. lrpprcGBT0235/GBT0235 mutants display similar birefringence area (p-value = 0.4773) but a decrease in mean gray value (p-value < 0.0001) and integrated density (p-value = 0.0001). Each individual data point represents a single embryo (For lrpprc+/+; N=14 and lrpprcGBT0235/GBT0235; N=15). Each parental pair represents a biological replicate. p-Values were determined using the Mann-Whitney test. (Figure 5—source data 1) (magnification- 5×).
-
Figure 5—source data 1
(A) Numeric data for the birefringence measurements in lrpprc+/+ and homozygous mutant larvae, lrpprcGBT0235/GBT0235; (B) numeric data for the birefringence measurements in 4 dpf lrpprc+/+, homozygous mutant larvae, lrpprcGBT0235/GBT0235, and liver-specific rescued larvae, Tg(fabp10:Cre)lrpprcGBT0235/GBT0235 ; (C) number of acridine orange particle counts across lrpprc homozygous mutants and wild-type siblings.
- https://cdn.elifesciences.org/articles/65488/elife-65488-fig5-data1-v3.xlsx
Figure 5—figure supplement 1

lrpprcGBT0235/GBT0235 and Tg(fabp10:Cre)lrpprcGBT0235/GBT0235 mutants display decreased birefringence at 4 dpf.
Graphs displaying the birefringence area of the region of interest (ROI), mean gray value, and integrated density between lrpprc+/+, lrpprcGBT0235/GBT0235, and Tg(fabp10:Cre)lrpprcGBT0235/GBT0235 mutants at 4 dpf. lrpprcGBT0235/GBT0235 mutants display a decrease in mean gray value (p-value = 0.0003) and integrated density (p-value = 0.0002) as compared to wild type, whereas no significant difference in the birefringence area is observed (p-value = 0.1280). Tg(fabp10:Cre)lrpprcGBT0235/GBT0235 mutants do not display significant difference in the birefringence area (p-value = 0.1254), mean gray value (p-value = 0.7623) and integrated density (p-value = 0.3622) as compared to lrpprcGBT0235/GBT0235 mutants. Each individual data point represents a single animal (For lrpprc+/+; N=28, lrpprcGBT0235/GBT0235; N=13 and Tg(fabp10:Cre)lrpprcGBT0235/GBT0235; N=13). p-Values were determined using the Mann-Whitney test. (Figure 5—source data 1).
Figure 5—figure supplement 2
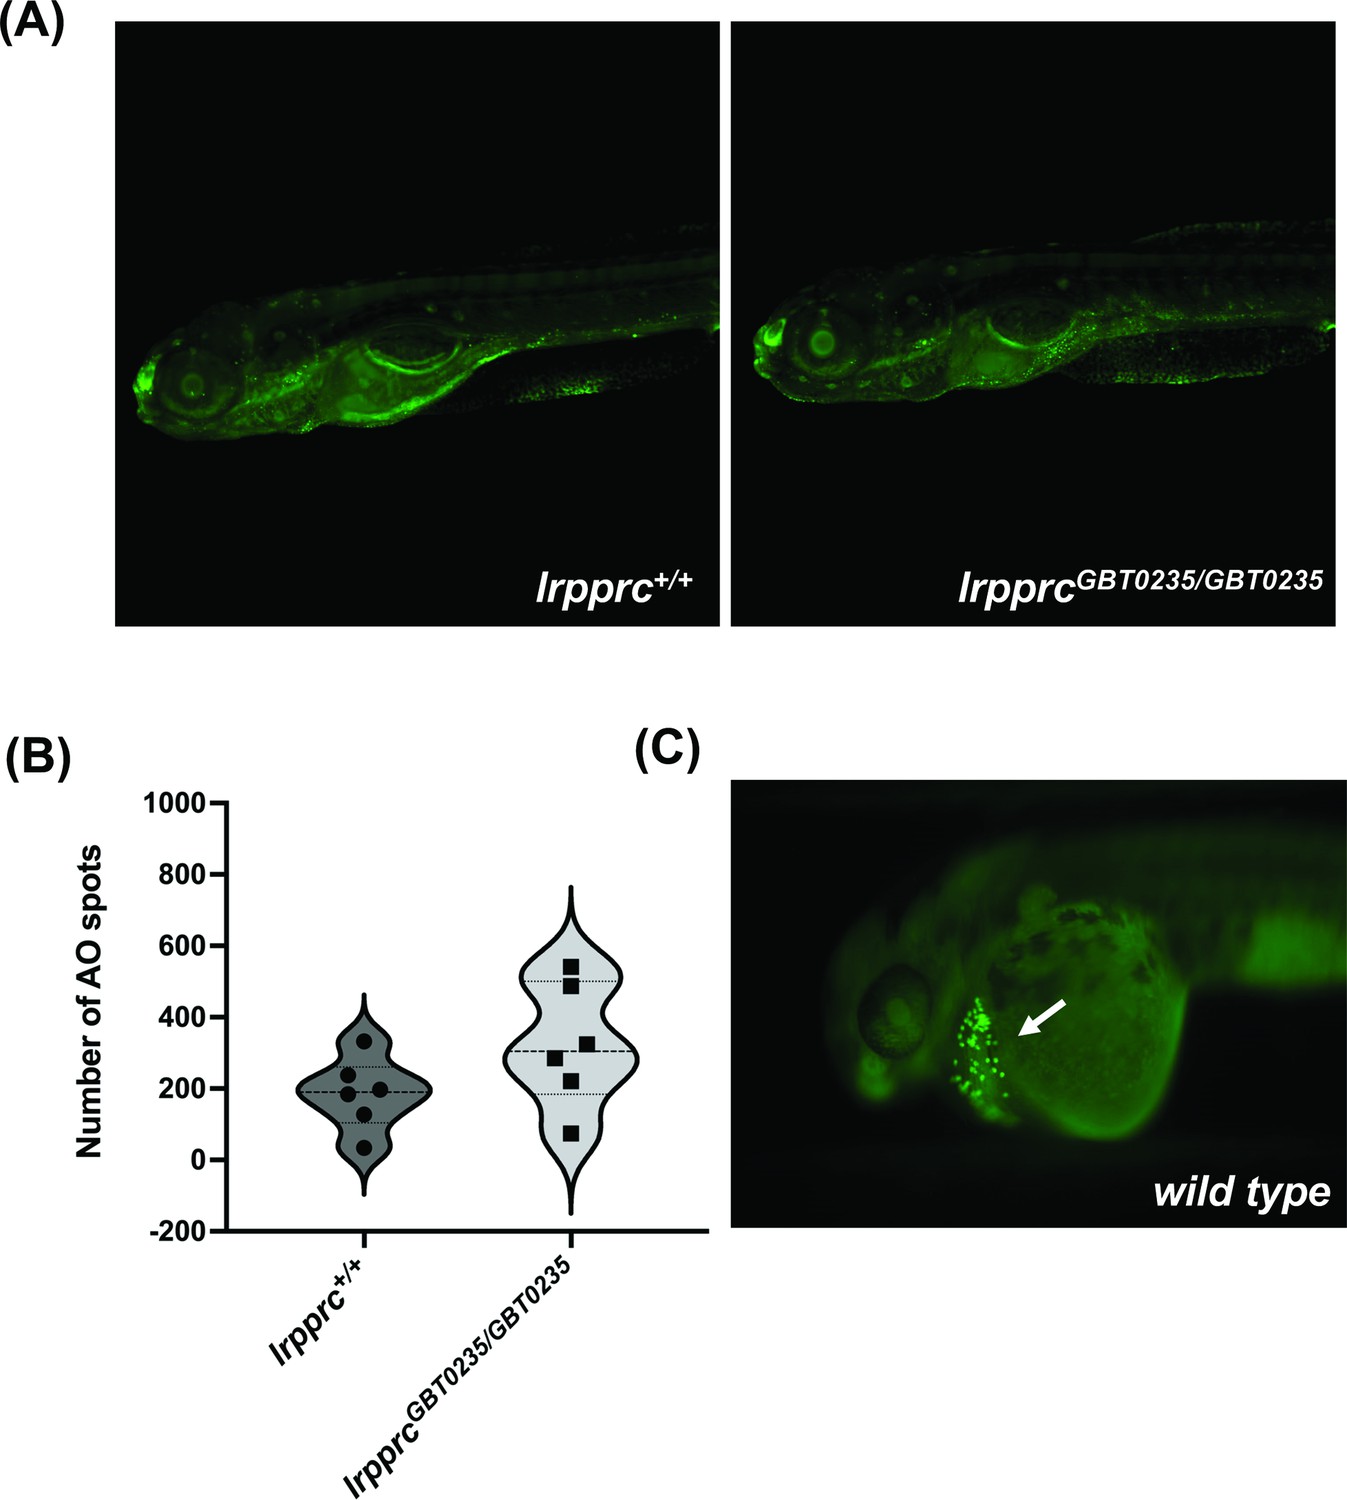
lrpprc homozygous mutants do not display neuronal necrosis.
(A) Representative images of 6 dpf wild-type and lrpprcGBT0235/GBT0235 mutants. Background neuronal necrosis was observed in the wild type as well as lrpprc homozygous siblings (magnification- 5×). (B) Individual spots were quantified in the neuronal region of interest across a series of images (blinded images) obtained from both genotypes and the number of such particle counts was not significant (p-value = 0.1797). Each individual data point represents a single embryo. p-Values were determined using the Mann-Whitney U test. (C) Hatching gland displaying programmed apoptosis during organogenesis at 2 dpf zebrafish embryo (Positive control for the AO assay; Figure 5—source data 1).
Figure 6
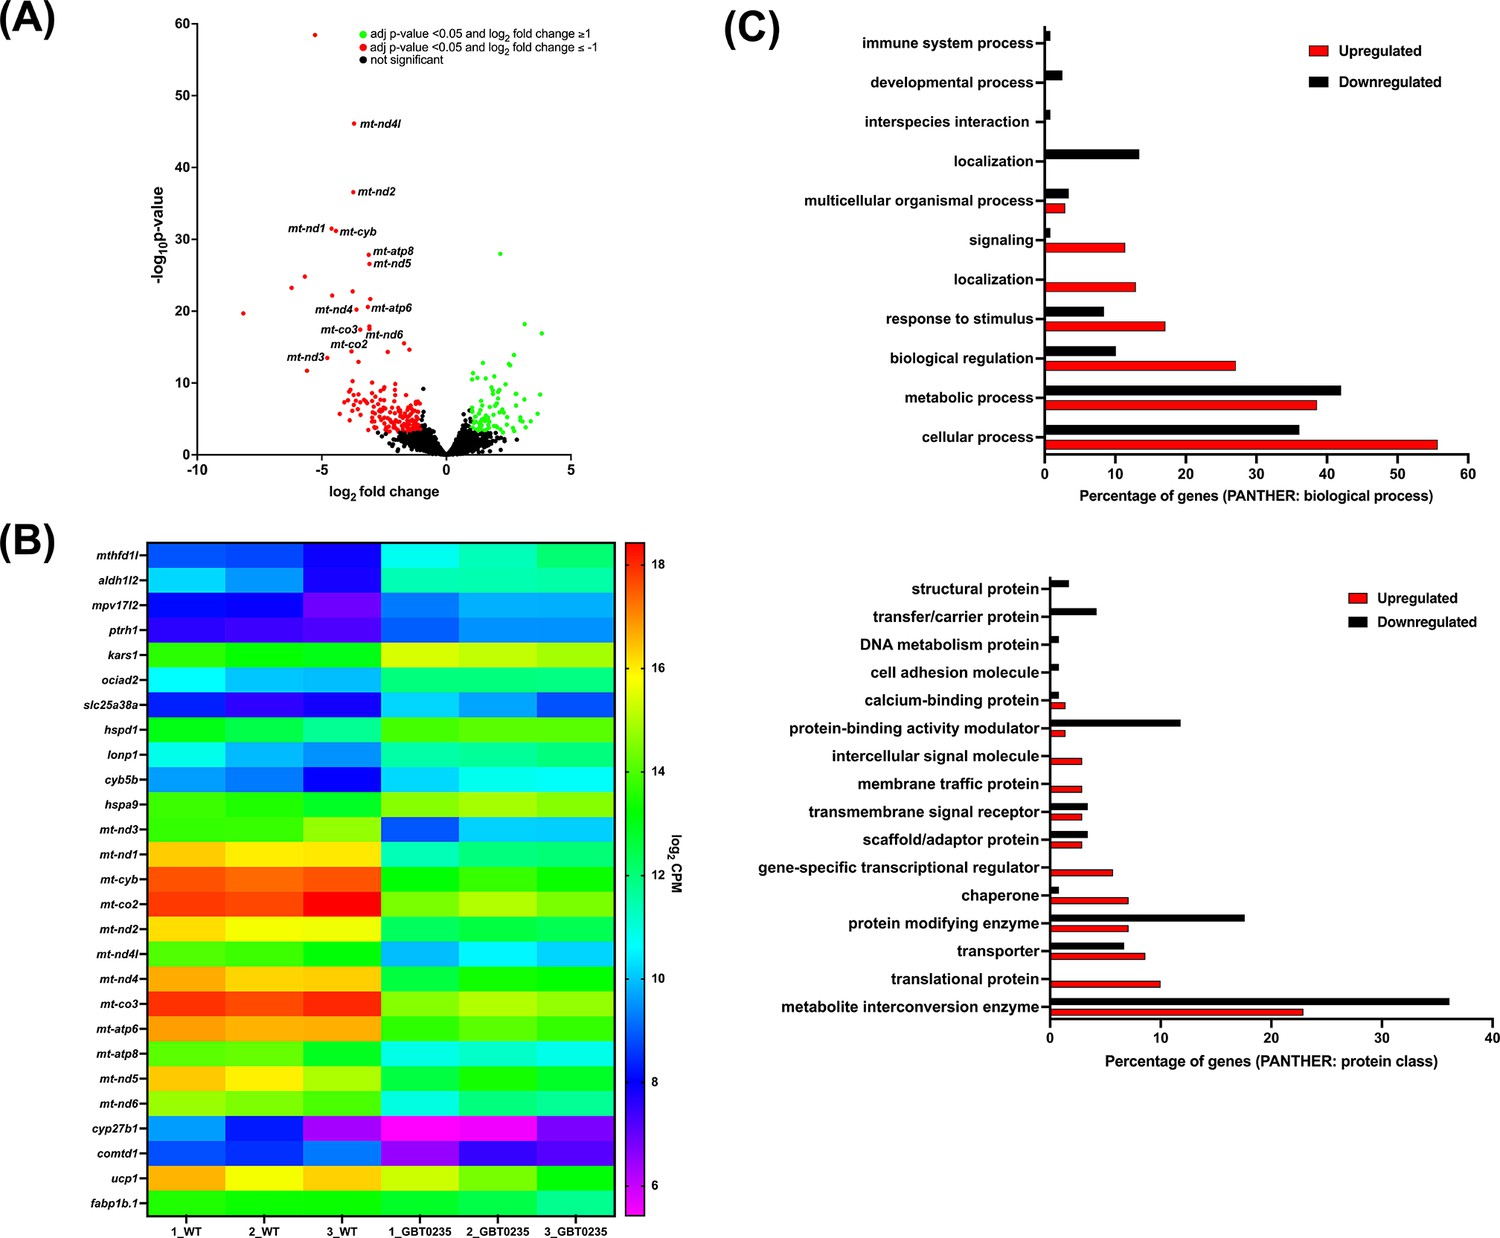
RNAseq of lrpprcGBT0235/GBT0235 homozygous mutants.
(A) Volcano plot of differentially expressed genes in the homozygous mutants. log2 of fold change and minus of log10 of p-value is represented on the x-axis and y-axis, respectively. The red dots signify the significantly downregulated genes and the green dots represent the significantly upregulated genes between the 6 dpf lrpprcGBT0235/GBT0235 and lrpprc+/+ larvae. Non-significant genes are represented by black dots (B) Heat map visualization of expression of zebrafish orthologs for human Mitocarta genes. The gradient color scale represents the log2CPM value obtained for each of the zebrafish mitochondrial orthologs across the biological replicates for each genotype. (C) PANTHER classification for all the significantly differentially expressed genes in the homozygous mutant according to protein class and biological process. Each histogram represents the percentage of genes having hits in the PANTHER database that fall in each of the categories, that is, biological process, and protein class.
Figure 7 with 1 supplement
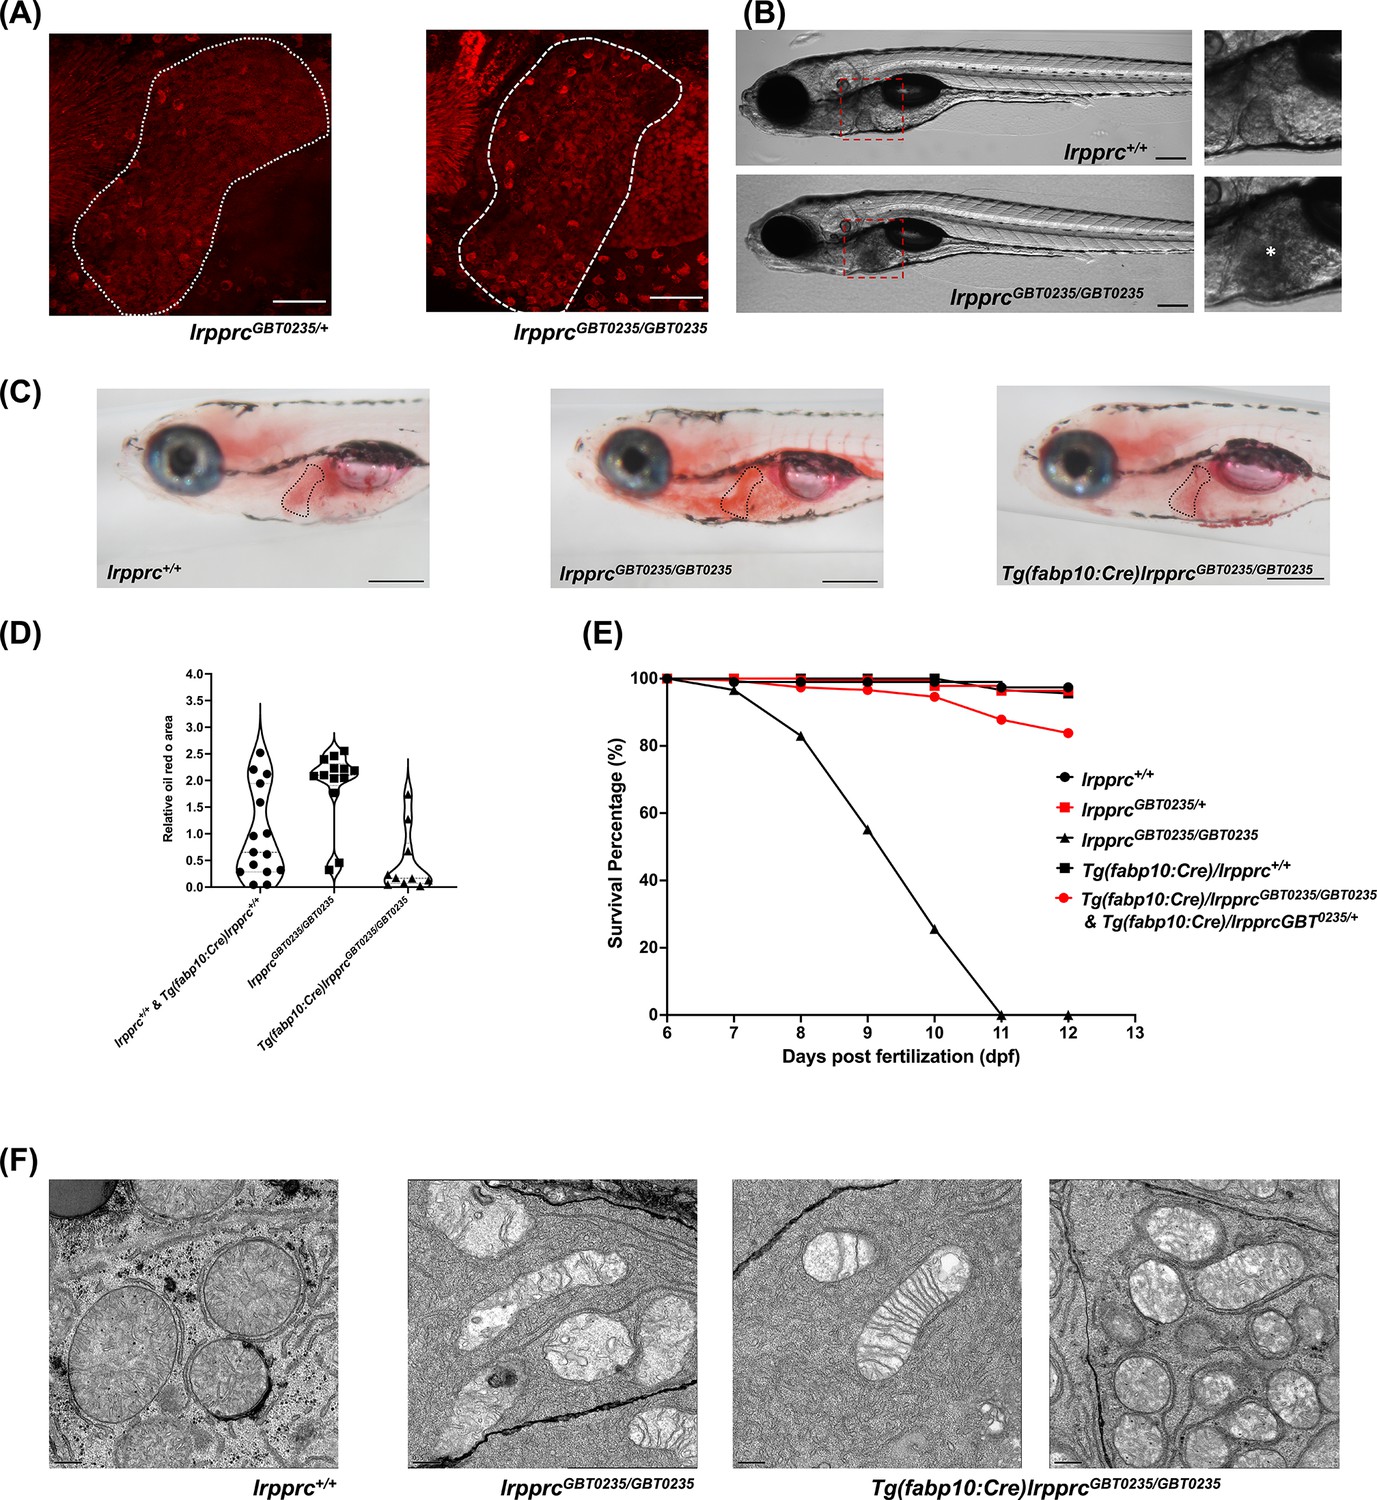
The liver plays an important role in the pathology of LSFC and genetic liver-specific rescue rescues the lipid defect and mortality in lrpprc homozygous mutant larvae.
(A) Representative images of the livers of 6 dpf old lrpprcGBT0235/+and lrpprcGBT0235/GBT0235 mutants at 40× (scale bar: 50 µm). (B) Brightfield image of 6 dpf lrpprc+/+ and lrpprcGBT0235/GBT0235 mutants. Homozygous mutants display a dark liver phenotype as compared to the wild-type controls. The region showing dark liver has been marked by an asterisk (scale bar: 150 µm). (C) Oil red O staining for assessment of lipid accumulation in the 6 dpf mutants and rescued larvae. Increased lipid accumulation was observed in the homozygous mutants compared to wild-type larvae. In the liver-specific rescued homozygous lrpprc mutants, Tg(fabp10:Cre)lrpprcGBT0235/GBT0235, no accumulation of lipids was observed (scale bar: 200 µm). (D) The graph show increase in the relative area of the oil red stain for the accumulated lipids, between wild-types (non-rescued wild-type, lrpprc+/+ and liver-specific rescued wild-type Tg(fabp10:Cre)lrpprc+/+) and lrpprcGBT0235/GBT0235 mutants, indicating an increase in the lipid content (p-value = 0.0083). The levels are restored in homozygous rescued larvae, Tg(fabp10:Cre)lrpprcGBT0235/GBT0235 (p-value < 0.0001). There was no significant difference between wild-types (non-rescued wild-type, lrpprc+/+ and liver-specific rescued wild-type Tg(fabp10:Cre)lrpprc+/+) and liver-specific rescued mutants, Tg(fabp10:Cre)lrpprcGBT0235/GBT0235 (p-value = 0.0623). p-Values were determined by the Mann-Whitney test. Each data point represents a single embryo. For, lrpprc+/+ N = 8; Tg(fabp10:Cre)lrpprc+/+ N = 7; lrpprcGBT0235/GBT0235 N=13; Tg(fabp10:Cre)lrpprcGBT0235/GBT0235, N=10. (Figure 7—source data 1) (E) Liver-specific rescued mutants display an improved survival rate beyond 11 dpf (Figure 7—source data 1). (F) Representative electron micrographs of the mitochondria in hepatocytes for 8 dpf lrpprc wild type, lrpprc homozygous mutants, and liver-specific lrpprc rescued larvae. Altered mitochondrial morphology displayed by lrpprcGBT0235/GBT0235 was observed to be improved in the rescued mutants, Tg(fabp10:Cre)lrpprcGBT0235/GBT0235 (scale bar: 0.5 µm).
-
Figure 7—source data 1
(D) Numeric data for the oil red area in lrpprc+/+, homozygous mutant larvae, lrpprcGBT0235/GBT0235, and liver-specific rescued homozygous mutant larvae, Tg(fabp10:Cre)lrpprcGBT0235/GBT0235; (E) data for the survival percentage of lrpprc+/+, lrpprcGBT0235/GBT0235 and larvae, Tg(fabp10:Cre)lrpprcGBT0235/GBT0235.
- https://cdn.elifesciences.org/articles/65488/elife-65488-fig7-data1-v3.xlsx
Figure 7—figure supplement 1
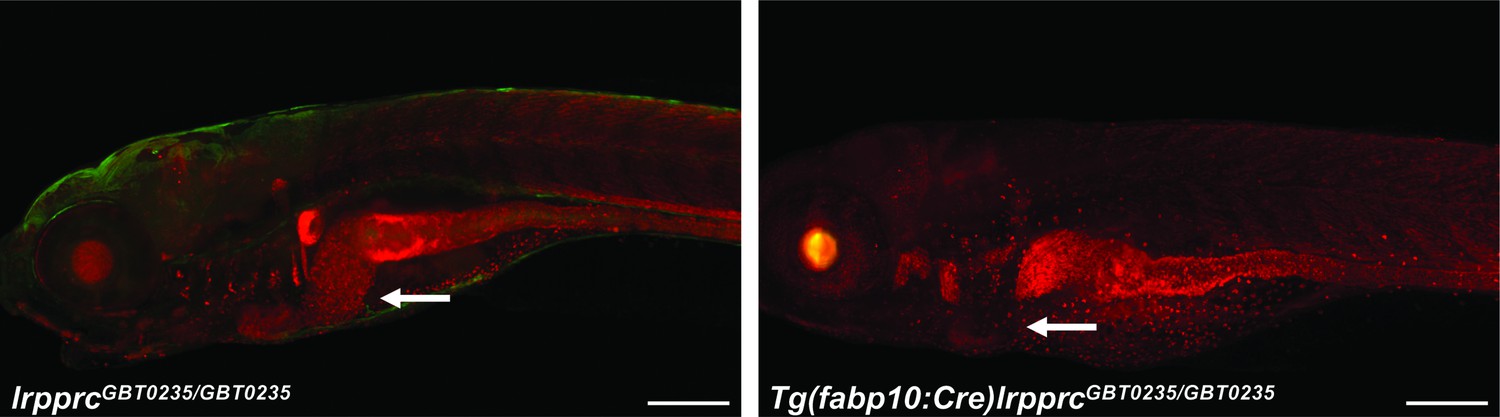
Irreversible liver-specific Cre recombinase-mediated rescue.
lrpprcGBT0235/+ adult zebrafish were crossed with Tg(−2.8fabp10:Cre;−0.8cryaa:Venus)S955 to obtain double transgenic adult zebrafish expressing both the GBT cassette and the fabp10 driven Cre recombinase. Tg(fabp10:Cre)lrpprcGBT0235/GBT0235 zebrafish larvae demonstrate a loss of RFP expression in the liver contributed by the reversion of mutagenicity RFP cassette mediated via liver-specific Cre recombinase (magnification- 5×; scale bar: 200 µm).
Figure 8

Genetic liver-specific rescue of altered dietary lipid metabolism in lrpprc homozygous mutant larvae.
(A) Representative chromatographs are shown: lipid extractions from whole wild-type larvae (top) and whole lrpprc homozygous mutant larvae (middle). Peaks represent different lipid species and are quantified by peak area. Liver-specific rescue of lrpprcGBT0235/GBT0235 mutants restores nonpolar lipid levels to wild-type levels in liver-specific rescued homozygous mutant larvae (bottom). All peaks were normalized to the amount of non-metabolizable fluorescent reagent ingested (NM). (B) Excerpts from representative chromatographs, wild-type larvae (top), and lrpprc homozygous mutant larvae (bottom). Peaks or peak areas (labeled as 1–4) were individually analyzed for contribution to the overall higher NPL level in lrpprc homozygous mutants compared to their wild-type siblings. (C) 95% CI plot: lrpprcGBT0235/GBT0235 generated 2.04 times more non-polar lipids compared to their wild-type siblings (lrpprcGBT0235/GBT0235/lrpprc+/+=2.040, p-value = 0.019). p-Value was obtained from the standard normal z-table. (D) 95% CI plot: Tg(fabp10:Cre)lrpprcGBT0235/GBT0235 restored the levels of non polar lipids as compared to lrpprcGBT0235/GBT0235 homozygous mutants. PL = phospholipids; NPL = nonpolar lipids (triglycerides, diglycerides); CE = cholesteryl ester; NM = normalizer for amount eaten. (Figure 8—source data 1).
-
Figure 8—source code 1
Code used to perform generalized estimated equations (gee) comparing total non polar lipid area as well as individual peaks/groups of peaks.
- https://cdn.elifesciences.org/articles/65488/elife-65488-fig8-code1-v3.zip
-
Figure 8—source data 1
Data for the peak areas per larval equivalent and normalized to the TopFluor cholesterol peak across lrpprc+/+, lrpprcGBT0235/GBT0235, and larvae, Tg(fabp10:Cre)lrpprcGBT0235/GBT0235.
- https://cdn.elifesciences.org/articles/65488/elife-65488-fig8-data1-v3.xlsx
Tables
Key resources table
| Reagent type (species) or resource | Designation | Source or reference | Identifiers | Additional information |
|---|---|---|---|---|
| Recombinant DNA reagent | pGBT-RP2.1 | Clark et al., 2011; Ichino et al., 2020 | Addgene: 31828; GenBank: HQ335170.1 | Figure 1 |
| Genetic reagent (Danio rerio) | Tg(−2.8fabp10:Cre; −0.8cryaa:Venus)S955 | Ni et al., 2012 | Provided by Dr. Wenbiao Chen, Vanderbilt University | Figure 7(C–F) and 8(A-D), Figure 7—figure supplement 1 |
| Genetic reagent (Danio rerio) | Tg(MLS: EGFP) | Kim et al., 2008 | Kind gift provided by Dr. Sridhar Sivasubbu (CSIR-IGIB) provided to him by Dr. Seok-Yong Choi, Chonnam National University | Figure 3C–D, Figure 3—figure supplement 1 |
| Software, algorithm | RoseTTAFold | Baek et al., 2021; https://github.com/RosettaCommons/RoseTTAFold | https://github.com/RosettaCommons/RoseTTAFold | Figure 2A–C |
| Software, algorithm | PyMOL (The PyMOL Molecular Graphics System, Version 2.5.2 Schrödinger, LLC) | https://pymol.org/2/ | Figure 2A–C | |
| Software, algorithm | CLUSTAL Omega v.1.2.4 | Sievers et al., 2011 http://www.clustal.org/omega/ | Figure 2—figure supplement 3 | |
| Software, algorithm | Jalview v.2.11.1.7 | Waterhouse et al., 2009 https://www.jalview.org/ | Figure 2—figure supplement 3 | |
| Software, algorithm | Pfam HMM database | https://pfam.xfam.org/ | Figure 2—figure supplement 3 | |
| Software, algorithm | TPRpred | Karpenahalli et al., 2007 https://toolkit.tuebingen.mpg.de/tools/tprpred | ||
| Software, algorithm | FIMO motif scanning program in the MEME Suite | Grant et al., 2011 https://meme-suite.org/meme/tools/fimo | Supplementary file 1B and Supplementary file 1C | |
| Other | Human reference mitochondrial genome (NC_012920.1) | https://www.ncbi.nlm.nih.gov/nuccore/251831106 | Supplementary file 1B | |
| Other | Zebrafish reference mitochondrial genome (NC_002333.2) | https://www.ncbi.nlm.nih.gov/nuccore/NC_002333.2 | Supplementary file 1C | |
| Instrument | Zebrafish embryonic genotyper | Lambert et al., 2018 https://www.wfluidx.com/ | ||
| Commercial assay or kit | MyTaq Red polymerase | Meridian Bioscience | Catalog no: BIO-21105 | |
| Chemical compound, drug | Agarose | VWR Life Science | Catalog no: 0710 | |
| Chemical compound, drug | Tween-20 | Bio-Rad | Catalog no: 170–6531 | |
| Chemical compound, drug | Sodium hydroxide anhydrous | MP Biomedicals | Catalog no: 153495 | |
| Chemical compound, drug | Tris base | Millipore-Sigma | Catalog no: 11814273001 | |
| Chemical compound, drug | Phenylthiocarbamide | Millipore-Sigma | Catalog no: P7629 | |
| Chemical compound, drug | Tricaine | Millipore-Sigma | Catalog no: A5040 | |
| Chemical compound, drug | Low-melting agarose | Fisher Scientific | Catalog no: BP1360 | |
| Recombinant DNA reagent | pT3TS-NLS-BFP | This paper | ||
| Commercial assay or kit | T3 mMessage mMachine transcription kit | Thermo Scientific | Catalog no: AM1348 | |
| Commercial assay or kit | NEB Monarch RNA cleanup kit | New England Biolabs | Catalog no: T2040L | |
| Chemical compound, drug | PstI (restriction enzyme) | New England Biolabs | Catalog no: R0140S | |
| Chemical compound, drug | N,O,-bis-(trimethylsilyl) trifluoroacetamide with 1% trimethylchlorosilane (BSTFA +TMCS) | Thermo Scientific | Catalog no: TS-38834 | |
| Chemical compound, drug | Ethyl acetate | EMD-Millipore | Catalog no: EX0245-1 | |
| Chemical compound, drug | Sodium Chloride | Fisher Scientific | Catalog no: S271 | |
| Chemical compound, drug | 6 N Hydrochloric acid | EMD-Millipore | Catalog no: HX0603-75 | |
| Chemical compound, drug | O-(2,3,4,5,6-Pentafluorobenzyl)hydroxylamine Hydrochloride | TCI America | Catalog no: P0822 | |
| Chemical compound, drug | TRIzol | Thermo Scientific | Catalog no: 15596026 | |
| Chemical compound, drug | Chloroform | Millipore-Sigma | Catalog no: C2432 | |
| Chemical compound, drug | Ethanol | Millipore-Sigma | Catalog no: E7023 | |
| Chemical compound, drug | Ethylenediaminetetraacetic acid disodium salt dihydrate (EDTA) | Millipore-Sigma | Catalog no: E5134 | |
| Chemical compound, drug | Potassium chloride | Millipore-Sigma | Catalog no: P5405 | |
| Chemical compound, drug | NP-40 permeating solution | Alfa Aesar | Catalog no: J60838 | |
| Chemical compound, drug | Proteinase K | Qiagen | Catalog no: 19133 | |
| Chemical compound, drug | Dnase I | Qiagen | Catalog no: 79254 | |
| Commercial assay or kit | RNeasy Mini Kit | Qiagen | Catalog no: 74104 | |
| Commercial assay or kit | SuperScript III Reverse Transcriptase | Thermo Scientific | Catalog no: 18080093 | |
| Commercial assay or kit | SensiFAST SYBR Lo-ROX kit | Meridian Bioscience | Catalog no: BIO-94005 | |
| Chemical compound, drug | Acridine orange | Millipore-Sigma | Catalog no: A8097 | |
| Software, algorithm | FIJI | https://imagej.net/software/fiji/ | ||
| Software, algorithm | GraphPad Prism 8 | https://www.graphpad.com/ | ||
| Commercial assay or kit | NEBNext Ultra RNA Library Prep Kit | New England BioLabs | Catalog no: E7530 | Library preparation performed at GENEWIZ, LLC (USA) |
| Software, algorithm | Trimmomatic | Bolger et al., 2014 | RNA sequencing analysis | |
| Software, algorithm | Kallisto | Bray et al., 2016 | RNA sequencing analysis | |
| Software, algorithm | Tximport | Soneson et al., 2015 | RNA sequencing analysis | |
| Software, algorithm | DESeq2 | Love et al., 2014 Differential gene expression analysis | RNA sequencing analysis | |
| Software, algorithm | Zebrafish Information Network (ZFIN) | https://zfin.org/ | ||
| Software, algorithm | Ensembl | http://useast.ensembl.org/Danio_rerio/Info/Index | ||
| Software, algorithm | PANTHER | Mi et al., 2019 http://www.pantherdb.org/geneListAnalysis.do | ||
| Software, algorithm | GeneTrail | Stöckel et al., 2016 https://genetrail2.bioinf.uni-sb.de/ | ||
| Chemical compound, drug | Oil red o stain | Millipore-Sigma | Catalog no: O1391 | |
| Chemical compound, drug | 4% Paraformaldehyde | Alfa Aesar | Catalog no: J61899 | |
| Chemical compound, drug | Phosphate buffer saline | Millipore-Sigma | Catalog no: | |
| Chemical compound, drug | BODIPY FL C12 | Thermo Scientific | Catalog no: D3822 | |
| Chemical compound, drug | TopFluor Cholesterol | Avanti Polar Lipids | Catalog no: 810255 | |
| Software, algorithm | R | https://www.r-project.org/ |
Additional files
-
Supplementary file 1
Supplementary tables.
(A) List of oligonucleotides used in the study. (B) Prediction of Human LRPPRC binding sites within the human mitochondrial genome (NC_012920.1). The top twenty matches among both strands of the complete mitochondrial genome are shown. The p-values were calculated with the FIMO program and were used for ranking. (C) Prediction of zebrafish Lrpprc binding sites within the zebrafish mitochondrial genome (NC_002333.2). The top twenty matches among both strands of the complete mitochondrial genome are shown. The p-values were calculated with the FIMO program and were used for ranking.
- https://cdn.elifesciences.org/articles/65488/elife-65488-supp1-v3.docx
-
Supplementary file 2
Gene set enrichment analysis for lrpprc homozygous mutants.
- https://cdn.elifesciences.org/articles/65488/elife-65488-supp2-v3.xls
-
Transparent reporting form
- https://cdn.elifesciences.org/articles/65488/elife-65488-transrepform1-v3.docx
Download links
A two-part list of links to download the article, or parts of the article, in various formats.
Downloads (link to download the article as PDF)
Open citations (links to open the citations from this article in various online reference manager services)
Cite this article (links to download the citations from this article in formats compatible with various reference manager tools)
Genetic therapy in a mitochondrial disease model suggests a critical role for liver dysfunction in mortality
eLife 11:e65488.
https://doi.org/10.7554/eLife.65488


