Maternally inherited piRNAs direct transient heterochromatin formation at active transposons during early Drosophila embryogenesis
- CRUK Cambridge Institute, University of Cambridge, Li Ka Shing Centre, United Kingdom
Figures
Figure 1 with 2 supplements
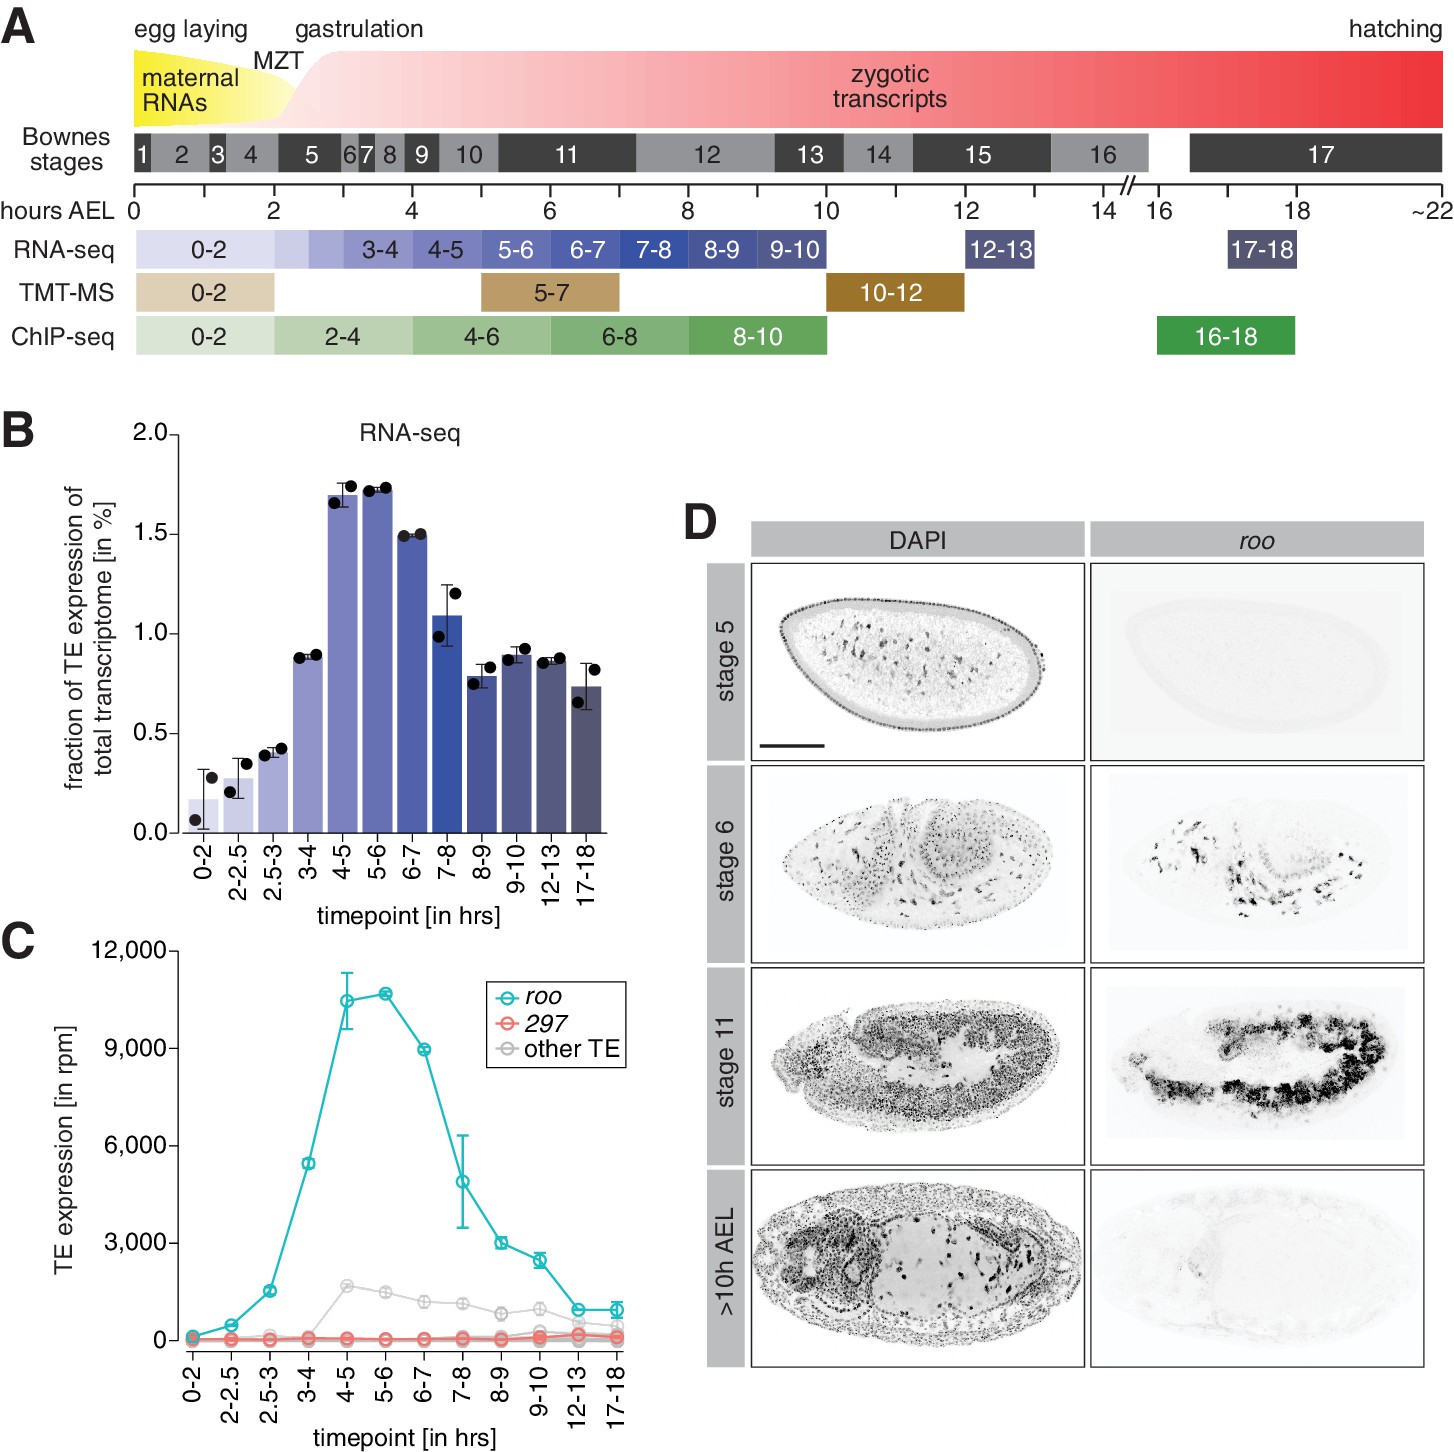
A transient burst of transposon expression during Drosophila embryogenesis.
(A) Schematic of Drosophila embryogenesis indicating Bownes stages and collected time points. (B) Bar graphs showing contribution of transposon derived reads to the transcriptome of control w1118 embryos at the indicated time points in percent. Error bars show standard deviation (n = 2). (C) Line graphs showing the RNA expression (in rpm) for the 30 most expressed transposons during the indicated time points of embryogenesis. Error bars show standard deviation (n = 2). (D) Confocal fluorescent microscopy images of control w1118 embryos showing nuclei stained with DAPI and roo transcripts by RNA-FISH at the indicated embryonic stages (also see Figure 1—figure supplement 2B). Scale bar = 100 µm.
Figure 1—figure supplement 1
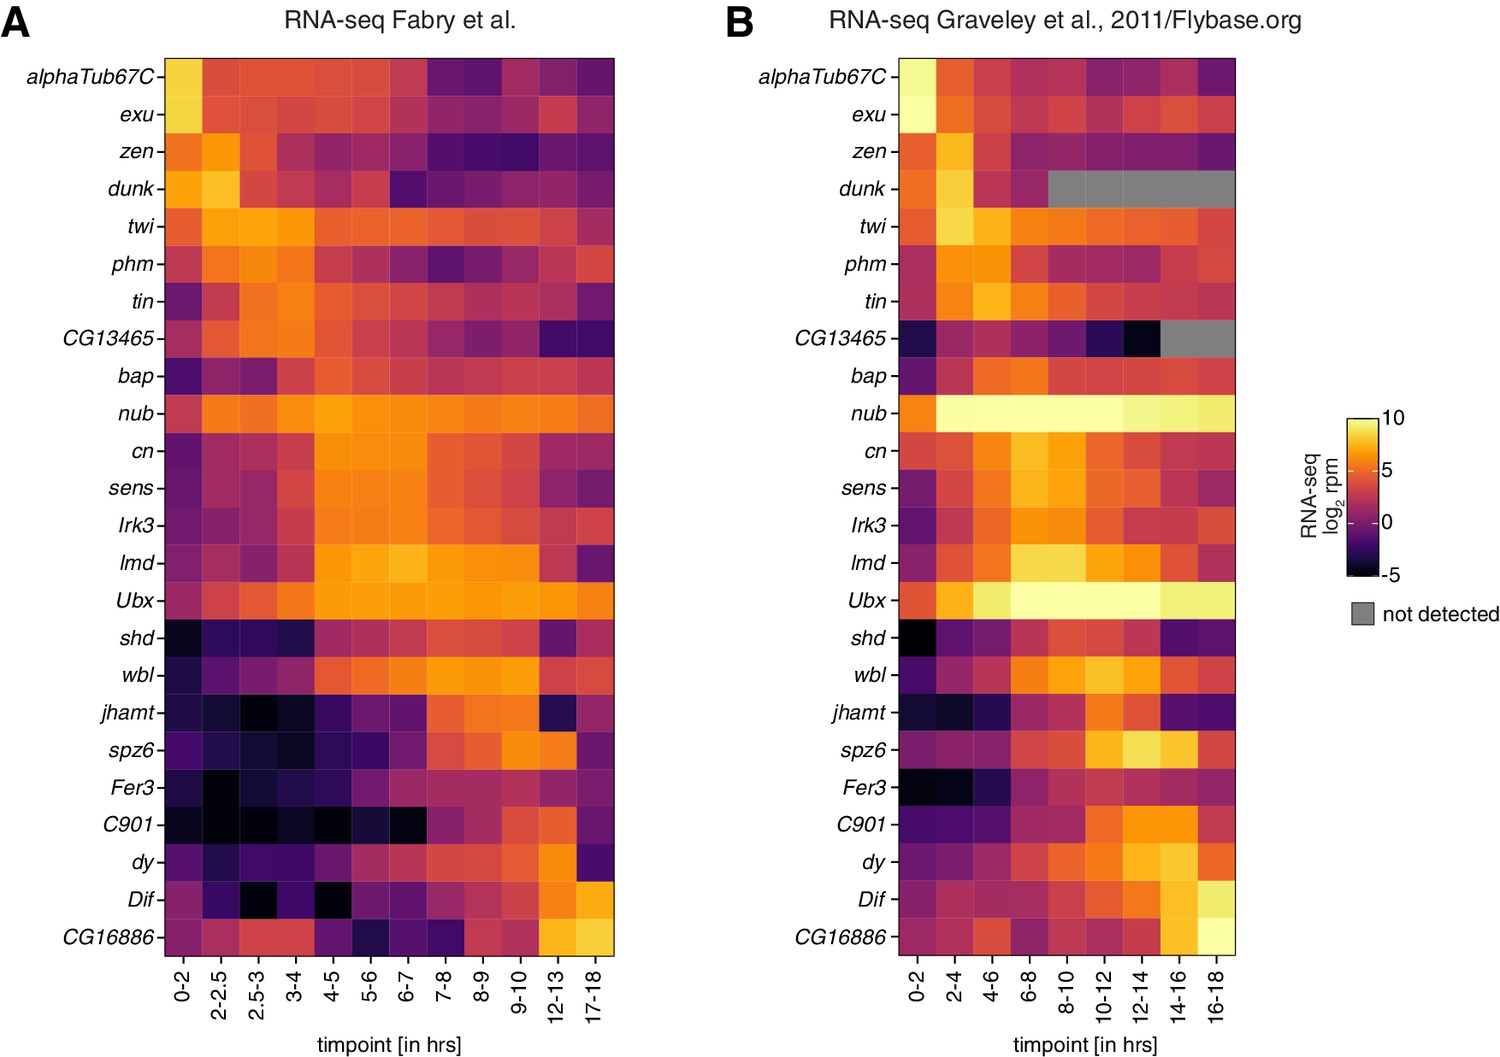
Correlation of embryo collection time points between datasets.
(A) Heatmaps showing expression changes in RNA-seq (in log2 reads per million; n = 2) of control w1118 embryos for the indicated time points and selected genes with dynamic expression during embryogenesis. (B) As in (A) but showing reanalyzed datasets published by Graveley and colleagues (Graveley et al., 2011). Gray squares = not detected.
-
Figure 1—figure supplement 1—source data 1
Gene- and transposable element-mapping reads per million across embryogenesis RNA-seq time points for plots shown in Figure 1B, C, Figure 1—figure supplement 1A, B, Figure 1—figure supplement 2A, F, Figure 2A, and Figure 2—figure supplement 1H, J.
- https://cdn.elifesciences.org/articles/68573/elife-68573-fig1-figsupp1-data1-v2.txt
-
Figure 1—figure supplement 1—source data 2
Signal intensity of genes and transposon open reading frames in TMT-MS time-course experiment for plots shown in Figure 1—figure supplement 2A, C, D, F, Figure 2B, and Figure 2—figure supplement 1I, K.
- https://cdn.elifesciences.org/articles/68573/elife-68573-fig1-figsupp1-data2-v2.txt
Figure 1—figure supplement 2
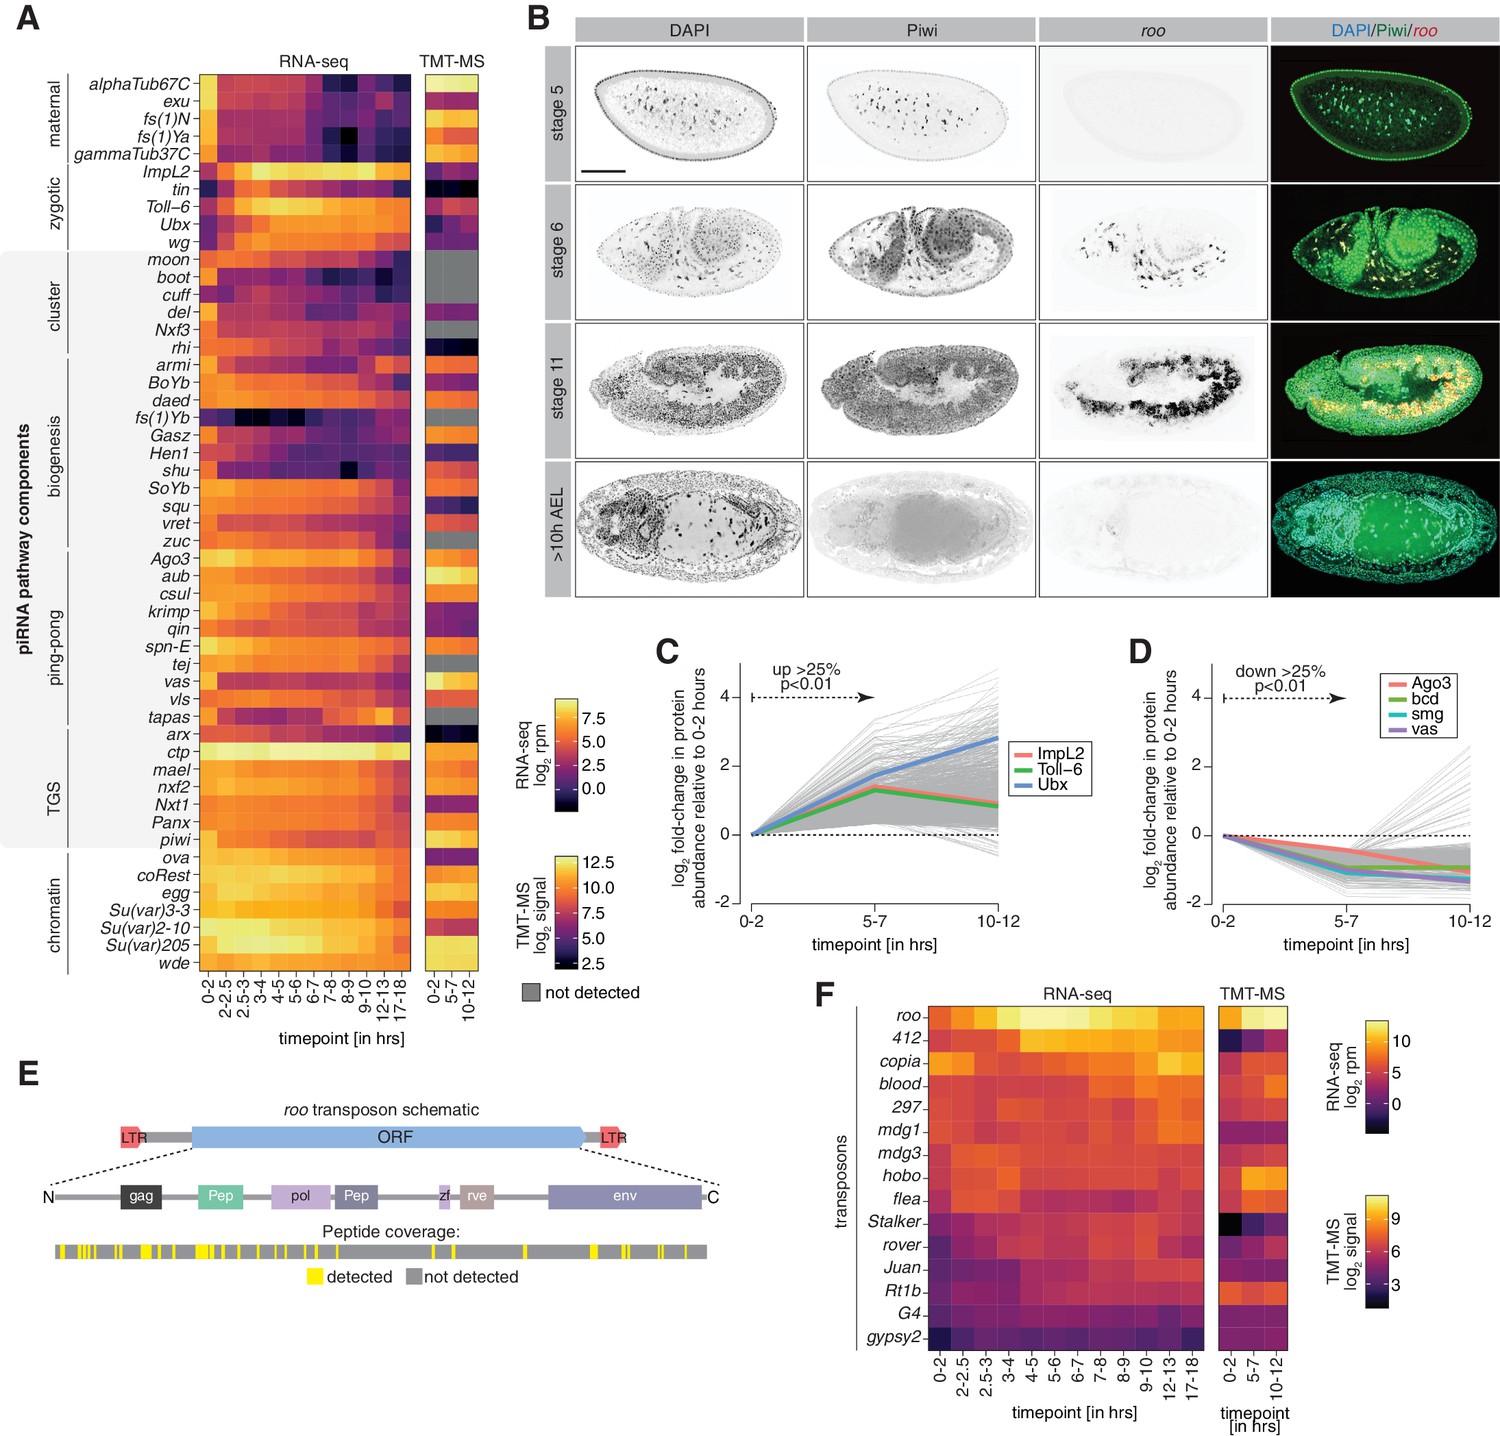
Transposon protein and the known cohort of piRNA co-transcriptional gene silencing (coTGS) factors are present during embryogenesis.
(A) Heatmaps showing expression changes in RNA-seq (left; in log2 reads per million; n = 2) and protein abundance in TMT-MS (right; log2 signal intensity; n = 3) of control w1118 embryos for indicated time points and selected maternal/zygotic genes, chromatin factors, and the indicated piRNA pathway components. Gray squares = not detected. (B) Confocal fluorescent microscopy images of embryos showing immunofluorescence staining for Piwi protein, roo transcripts by RNA-FISH and nuclei with DAPI at the indicated embryonic stages. Scale bar = 100 µm. (C) Line graphs showing fold-changes in protein abundance (relative to 0–2 hr after egg laying [AEL]) measured by quantitative mass spectrometry for indicated time points of control w1118 embryos. Shown are genes with increasing protein abundance (over 25% with p<0.01) between 0–2 hr and 5–7 hr AEL. (D) As in (C) but showing genes with protein abundance decreasing (over 25% with p<0.01). (E) Schematic indicating the LTR-flanked 272 kDa open reading frame (ORF) of roo and its coding potential. Gag: group-specific antigen-like protein; pol: reverse transcriptase; env: envelope protein; Pep: two peptidases; zf: zinc finger-associated domain. Peptides detected by TMT-MS are indicated in yellow, regions not detected are shown in gray. (F) Heatmap showing protein signal intensity (arbitrary units) of the indicated transposons and time points in control w1118 embryos (n = 3).
Figure 2 with 1 supplement
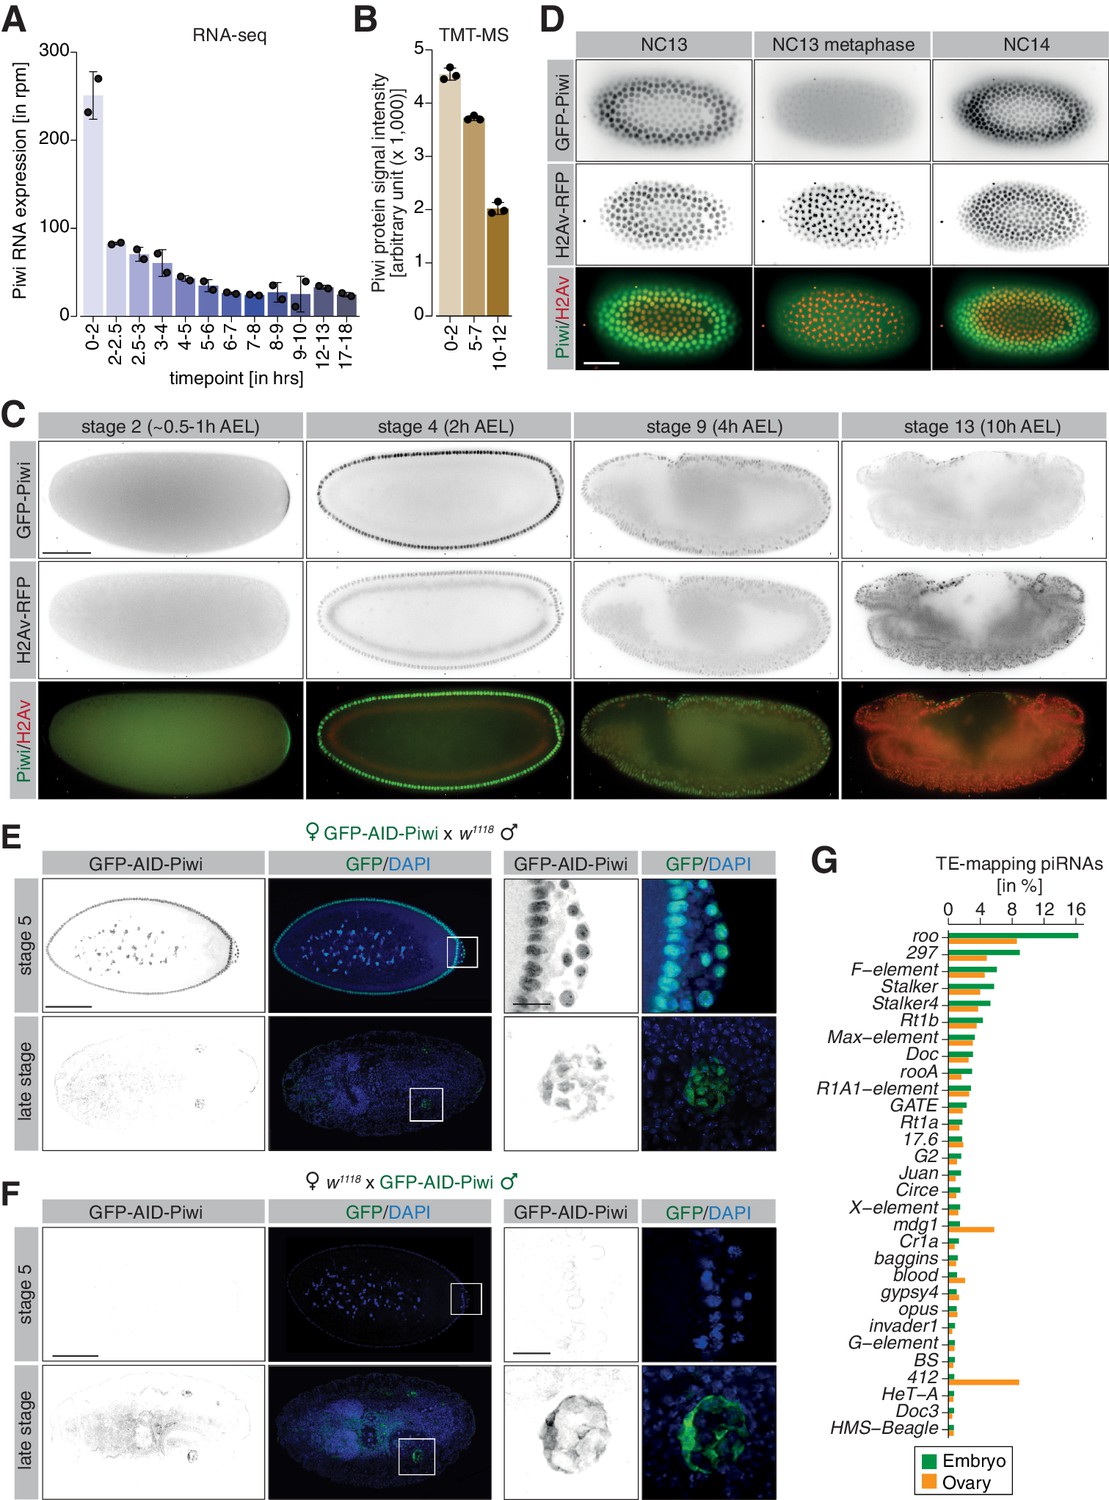
piRNA co-transcriptional gene silencing (coTGS) factors are maternally inherited and localize to somatic cells of the Drosophila embryo.
(A) Bar graphs showing Piwi RNA expression (in rpm) at the indicated time points in control w1118 embryos. Error bars show standard deviation (n = 2). (B) Bar graphs showing Piwi protein signal intensity (arbitrary units) at the indicated time points in control w1118 embryos. Error bars show standard deviation (n = 3). (C) Stand-still images from Video 1 obtained by light-sheet fluorescent live microscopy of embryos derived from parents expressing GFP-Piwi (green) and H2Av-RFP (red) for the indicated time points. Scale bar = 50 µm. (D) As in (C) but showing the transition from NC13 to NC14. Scale bar = 50 µm. (E) Confocal fluorescent microscopy images of embryos derived from females expressing GFP-AID-Piwi crossed to control w1118 males probing for GFP and DAPI. Shown are embryos at the blastoderm stage (stage 5) and late-stage embryos (>12 hr after egg laying). Scale bar = 100 µm. Zoom of the indicated regions showing developing germ cells. Scale bar = 10µm. (F) As in (E) but showing embryos derived from control w1118 females crossed to GFP-AID-Piwi males. (G) Bar graph showing small RNA-seq from Piwi immunoprecipitation of 0–8 hr control w1118 embryos (green, n = 1) or adult ovaries (orange, n = 1). Shown are antisense piRNAs of the 30 most abundant TE families in embryos as percentage of reads mapping to indicated transposons relative to all transposable element-mapping antisense piRNAs.
Figure 2—figure supplement 1

Maternally inherited co-transcriptional gene silencing (coTGS) factors localize to nuclei of pole and somatic cells during embryogenesis.
(A) Stand-still images from Video 2 obtained by light-sheet fluorescent live microscopy of embryos derived from parents expressing GFP-Panx (green) and H2Av-RFP (red) for the indicated time points. Scale bar = 50 µm. (B) As in (A) but showing stand-still images from Video 3 for GFP-Nxf2 (green) and H2Av-RFP (red) for the indicated time points. Scale bar = 50 µm. (C) Quantification of co-localization between GFP-Piwi and H2Av-RFP. Plot profile shows relative intensity of GFP-Piwi (green) and H2Av-RFP (red) protein for the indicated section (white line) of stage 4 (2 hr after egg laying ) embryos. (D) As in (C) but showing embryos expressing GFP-Panx and H2Av-RFP. (E) As in (C) but showing embryos expressing GFP-Nxf2 and H2Av-RFP. (F) As in (A) but showing the transition of GFP-Panx from NC13 to NC14. Scale bar = 50 µm. (G) As in (B) but showing the transition of GFP-Nxf2 from NC13 to NC14. Scale bar = 50 µm. (H) Bar graphs showing Panx RNA expression (in rpm) at the indicated time points in control w1118 embryos. Error bars show standard deviation (n = 2). (I) Bar graphs showing Panx protein signal intensity (arbitrary units) at the indicated time points in control w1118 embryos. Error bars show standard deviation (n = 3). (J) As in (H) but showing the Nxf2 RNA expression. (K) As in (I) but showing Nxf2 protein expression. (L) Confocal fluorescent microscopy images of developing germ cells of late-stage embryos derived from females expressing GFP-AID-Piwi crossed to control w1118 males probing for GFP and DAPI. Scale bar = 10 µm. (M) As in (L) but showing developing germ cells of late-stage embryos derived from control w1118 females crossed to GFP-AID-Piwi males. (N) Bar graph showing size distribution of Piwi-associated small RNAs (in rpm) from 0 to 8 hr w1118 embryos (n = 1). Blue = sense, red = antisense. (O) As in (N) but showing Piwi-associated small RNAs from adult w1118 ovaries (n = 1).
Figure 3 with 1 supplement
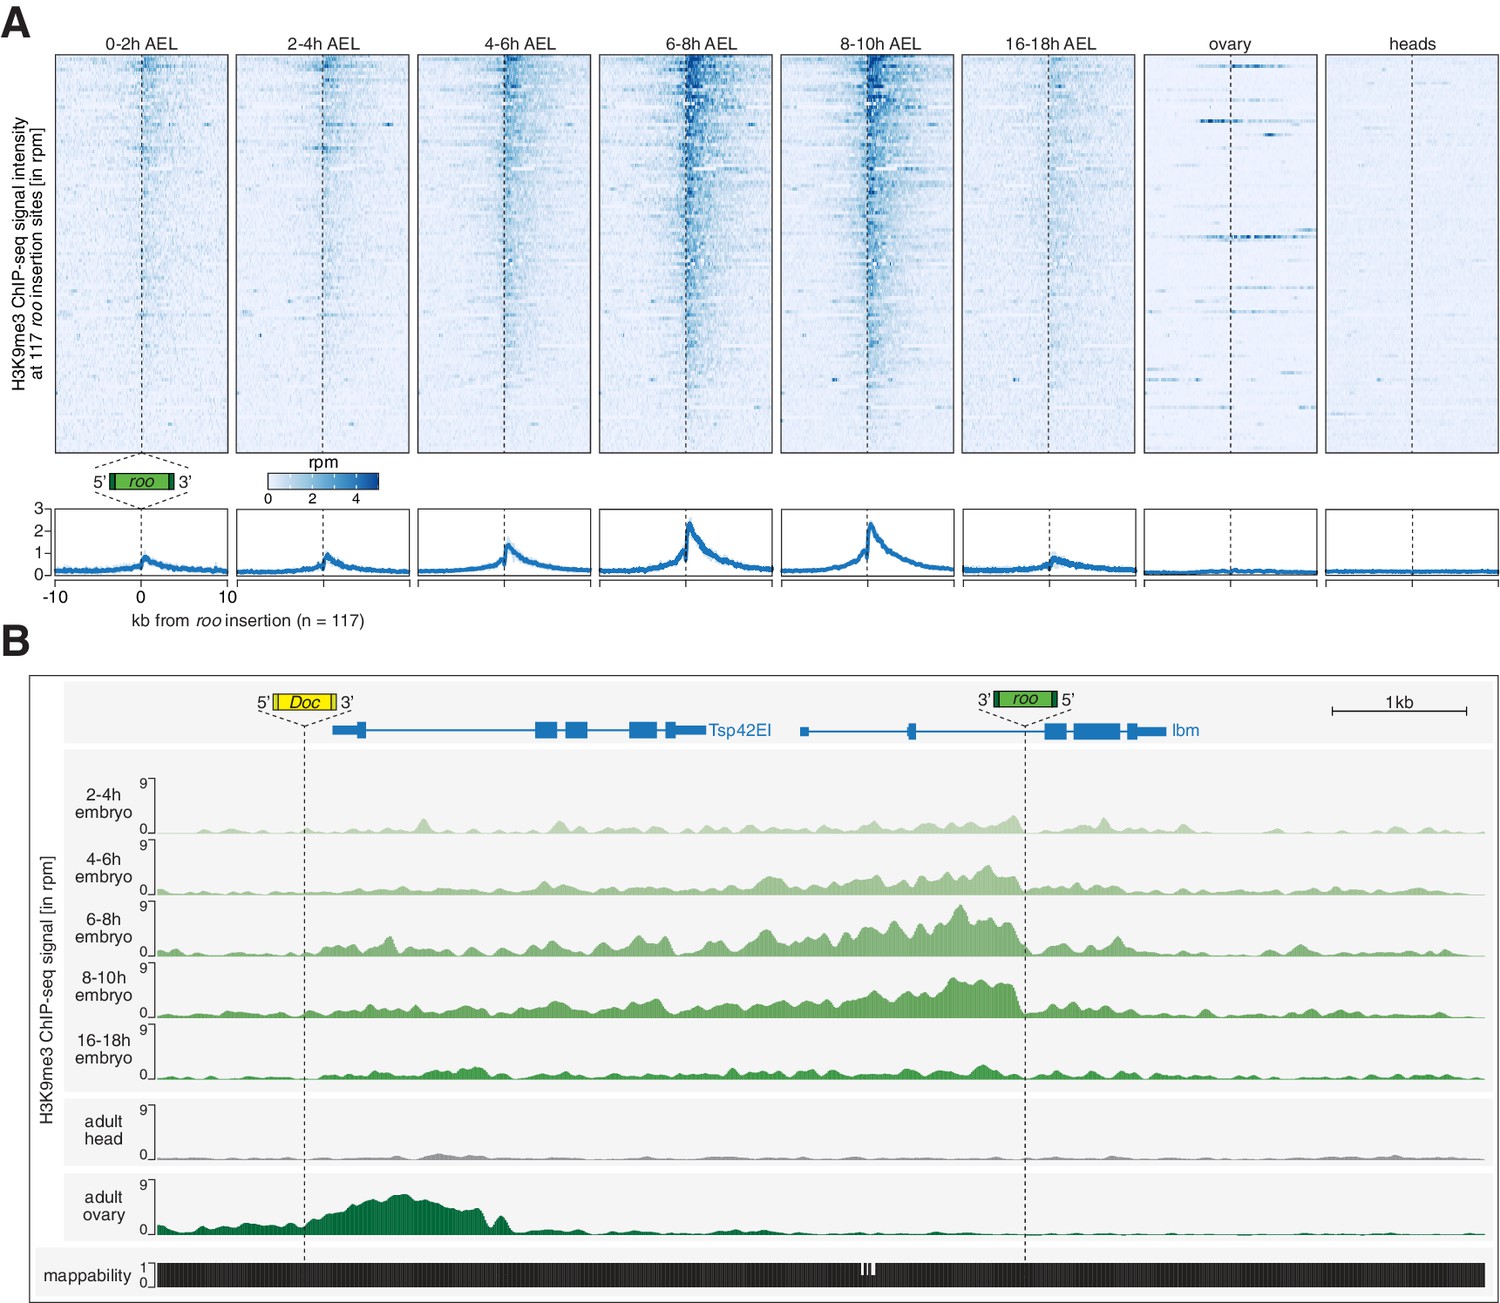
Transposon insertions targeted by piRNAs in embryos show epigenetic changes characteristic of co-transcriptional gene silencing.
(A) Heatmaps (top) and metaplots (bottom) showing H3K9me3 ChIP-seq signal (in rpm) for the indicated embryonic stages and adult tissues at 117 euchromatic, w1118-specific roo insertions (n = 2). Signal is shown within 10 kb from insertion site and sorted from 5′ to 3′. (B) UCSC genome browser screenshot showing H3K9me3 ChIP-seq signal for the indicated genes on chromosome 2R carrying w1118-specific roo and Doc insertions.
Figure 3—figure supplement 1
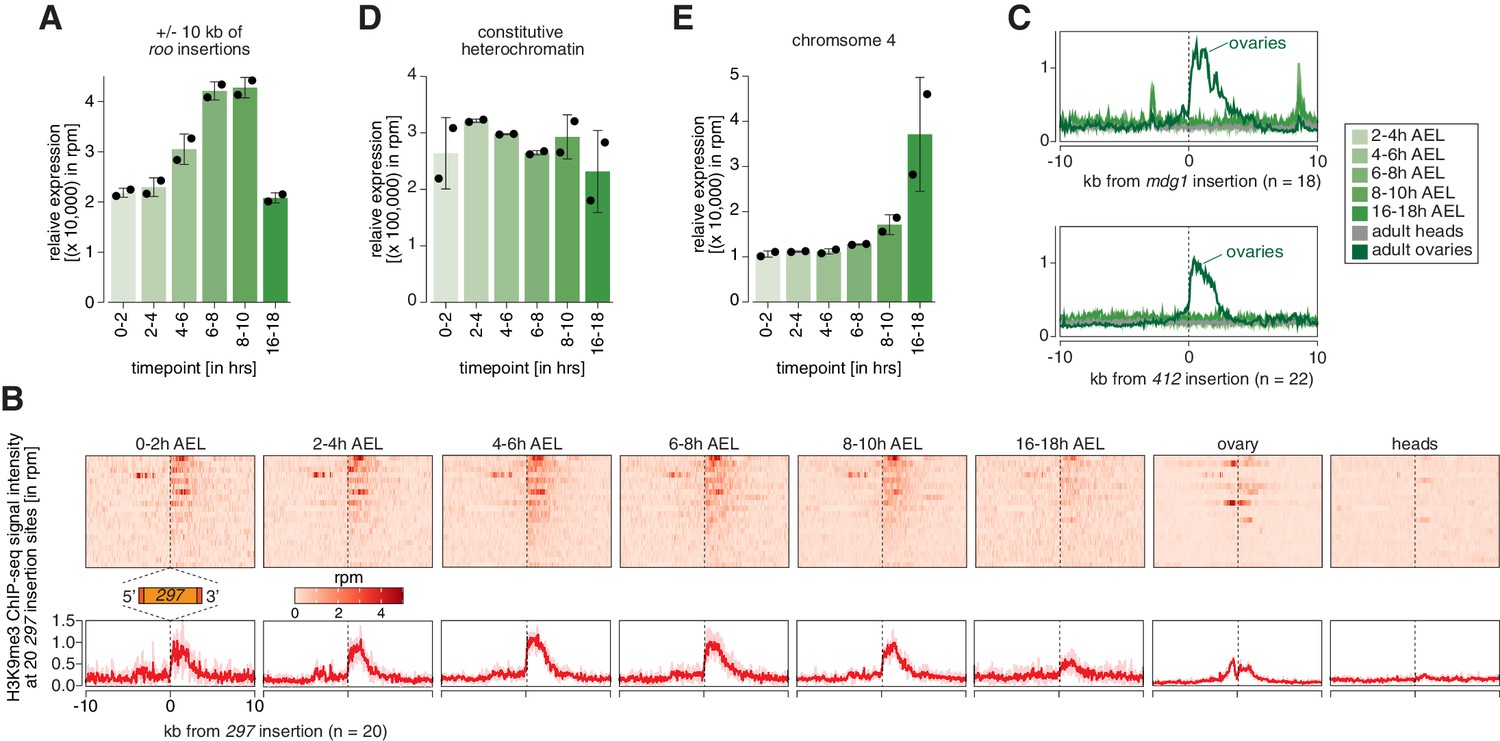
Transposons targeted by maternally inherited piRNAs show hallmarks of co-transcriptional gene silencing (coTGS).
(A) Bar graphs showing H3K9me3 signal intensity for the indicated time points at roo insertions. Error bars show standard deviation (n = 2). (B) Heatmaps (top) and metaplots (bottom) showing H3K9me3 ChIP-seq signal (in rpm) for the indicated embryonic stages and adult tissues at 20 euchromatic, w1118-specific 297 insertions (n = 2). Signal is shown within 10 kb from insertion site and sorted from 5′ to 3′. (C) Metaplots showing H3K9me3 ChIP-seq signal (in rpm) for the indicated embryonic stages and adult tissues at 18 euchromatic, w1118-specific mdg1 (top) and at 22 euchromatic, w1118-specific 412 insertions. Signal is shown within 10 kb from insertion site and sorted from 5′ to 3′ (n = 2). (D) Bar graphs showing H3K9me3 signal intensity for the indicated time points at constitutive heterochromatin. Error bars show standard deviation (n = 2). (E) As in (D) but showing chromosome 4 regions.
Figure 4 with 1 supplement

Degradation of Piwi protein in ovaries resembles mutant phenotypes.
(A) Cartoon illustrating the Piwi protein degradation strategy using the auxin-inducible AID-TIR1 system. (B) Confocal fluorescent microscopy images showing ovary egg chambers of GFP-AID-Piwi; OsTIR1 flies fed with yeast paste containing 5 mM auxin for the indicated time (also see Figure 4—figure supplement 1A). Blue = DAPI. Green = GFP-AID-Piwi. (C) Western blot of ovaries from females treated with 5 mM auxin-containing yeast paste for the indicated time period or control females probing for Piwi and Tubulin as a loading control. (D) Bar graphs showing rp49-normalized steady-state RNA levels of the indicated transposable elements and control genes in ovaries of GFP-AID-Piwi; OsTIR1 flies fed with yeast paste containing 5 mM auxin for the indicated time. Error bars show standard deviation (n = 3). Asterisk denotes significant changes compared to control (p<0.05, unpaired t-test). (E) Bar graphs showing the percentage of embryo deformation phenotypes laid by GFP-AID-Piwi; OsTIR1 females fed with yeast paste containing 5 mM auxin for the indicated time. (F) As in (E) but showing the hatching rate in percent.
Figure 4—figure supplement 1
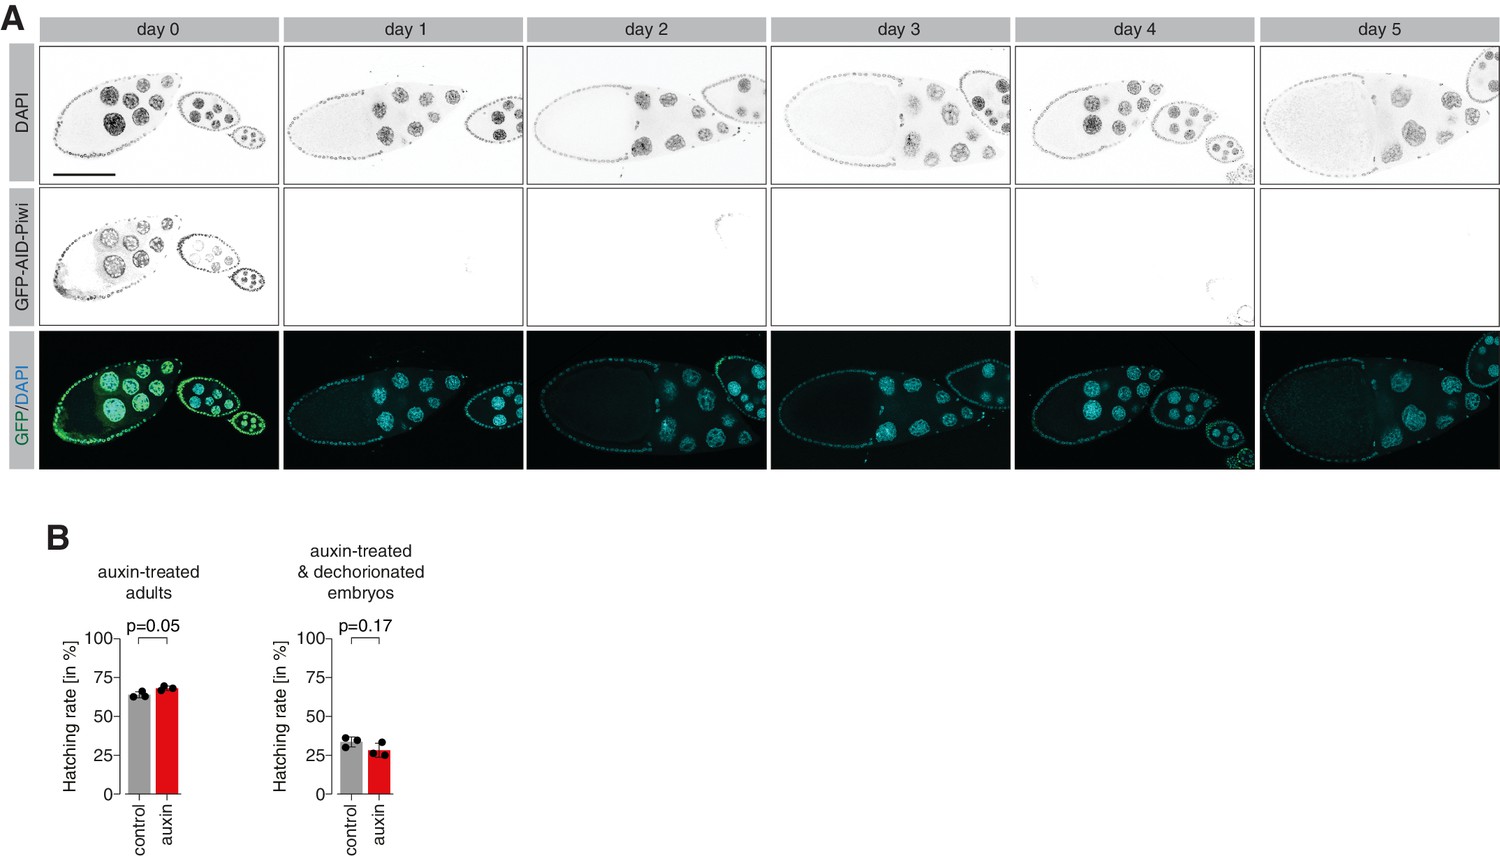
Piwi degradation in ovaries resembles knockdown and mutant phenotypes.
(A) Confocal fluorescent microscopy images showing ovary egg chambers of GFP-AID-Piwi; OsTIR1 flies fed with yeast paste containing 5 mM auxin for the indicated time. Blue = DAPI, green = GFP-AID-Piwi. (B) Bar graphs showing the percentage of hatched embryos laid by auxin- or control-treated females after 24 hr (left) and of embryos treated for 2.5 hr with 5 mM auxin following dechorionation (right). Statistical significance was determined by unpaired (two-sample) t-test.
Figure 5 with 1 supplement
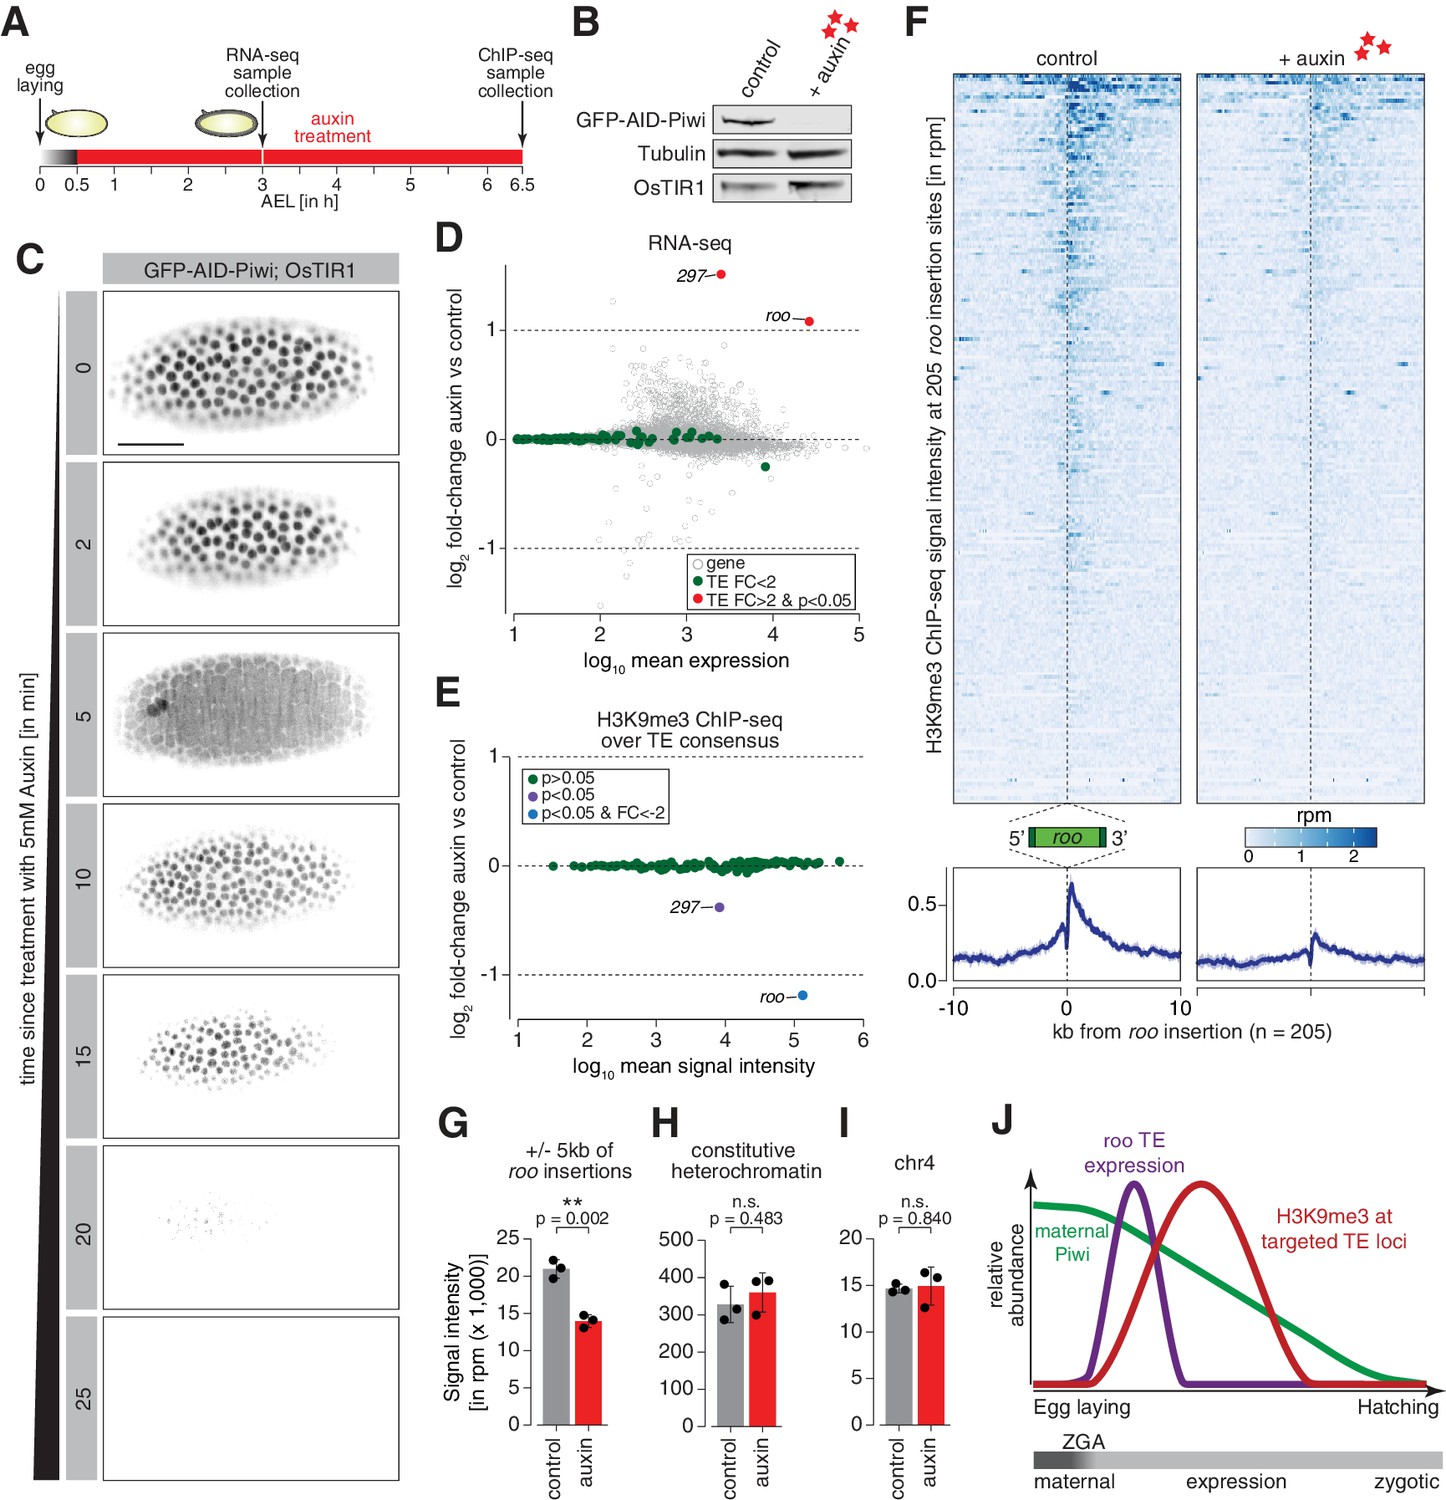
Degradation of maternally deposited Piwi in embryos leads to transposon deregulation.
(A) Schematic of embryo auxin treatments and sample collection for RNA-seq and ChIP-seq experiments. (B) Western blot showing abundance of GFP-AID-Piwi fusion protein in embryos treated with 5 mM auxin for 2 hr. OsTIR1 and tubulin expression are shown as loading control. (C) Stand-still images from Video 4 obtained by light-sheet fluorescent live microscopy of embryos derived from parents expressing GFP-AID-Piwi and OsTIR1 treated with 5 mM auxin for the indicated time intervals. Scale bar = 50 µm. (D) MA plot showing base mean expression (log10 scale) of transposon RNAs relative to their fold-change (log2 scale) in GFP-AID-Piwi; OsTIR1 embryos treated with 5 mM auxin versus control (n = 3). Gray = genes, green = TEs not changed (p<0.05), red = transposable elements (TEs) significantly changed (p<0.05) and fold-change > 2. (E) MA plot showing base mean signal intensity (log10 scale) of TEs relative to the H3K9me3 ChIP-seq signal enrichment (log2 scale) in GFP-AID-Piwi; OsTIR1 embryos treated with 5 mM auxin versus control (n = 3). Gray = TEs not significantly changed (p>0.05), purple = TEs significantly changed (p<0.05), blue = TEs significantly changed (p<0.05) and fold-change < –2. (F) Heatmaps (top) and metaplots (bottom) showing H3K9me3 ChIP-seq signal (in rpm) for control embryos and 5 mM auxin-treated embryos at 205 euchromatic, degron strain-specific roo insertions (n = 3). Signal is shown within 10 kb from insertion site and sorted from 5′ to 3′. (G) Bar graphs showing H3K9me3 signal intensity (in rpm) for the indicated treatments at roo loci. Error bars show standard deviation (n = 3). Statistics were calculated with unpaired (two-sample) t-test. (H) As in (G) but showing constitutive heterochromatin. (I) As in (G) but showing chromosome 4 regions. (J) Model of piRNA-guided chromatin modification at active transposons in somatic cells of the developing Drosophila embryo.
Figure 5—figure supplement 1
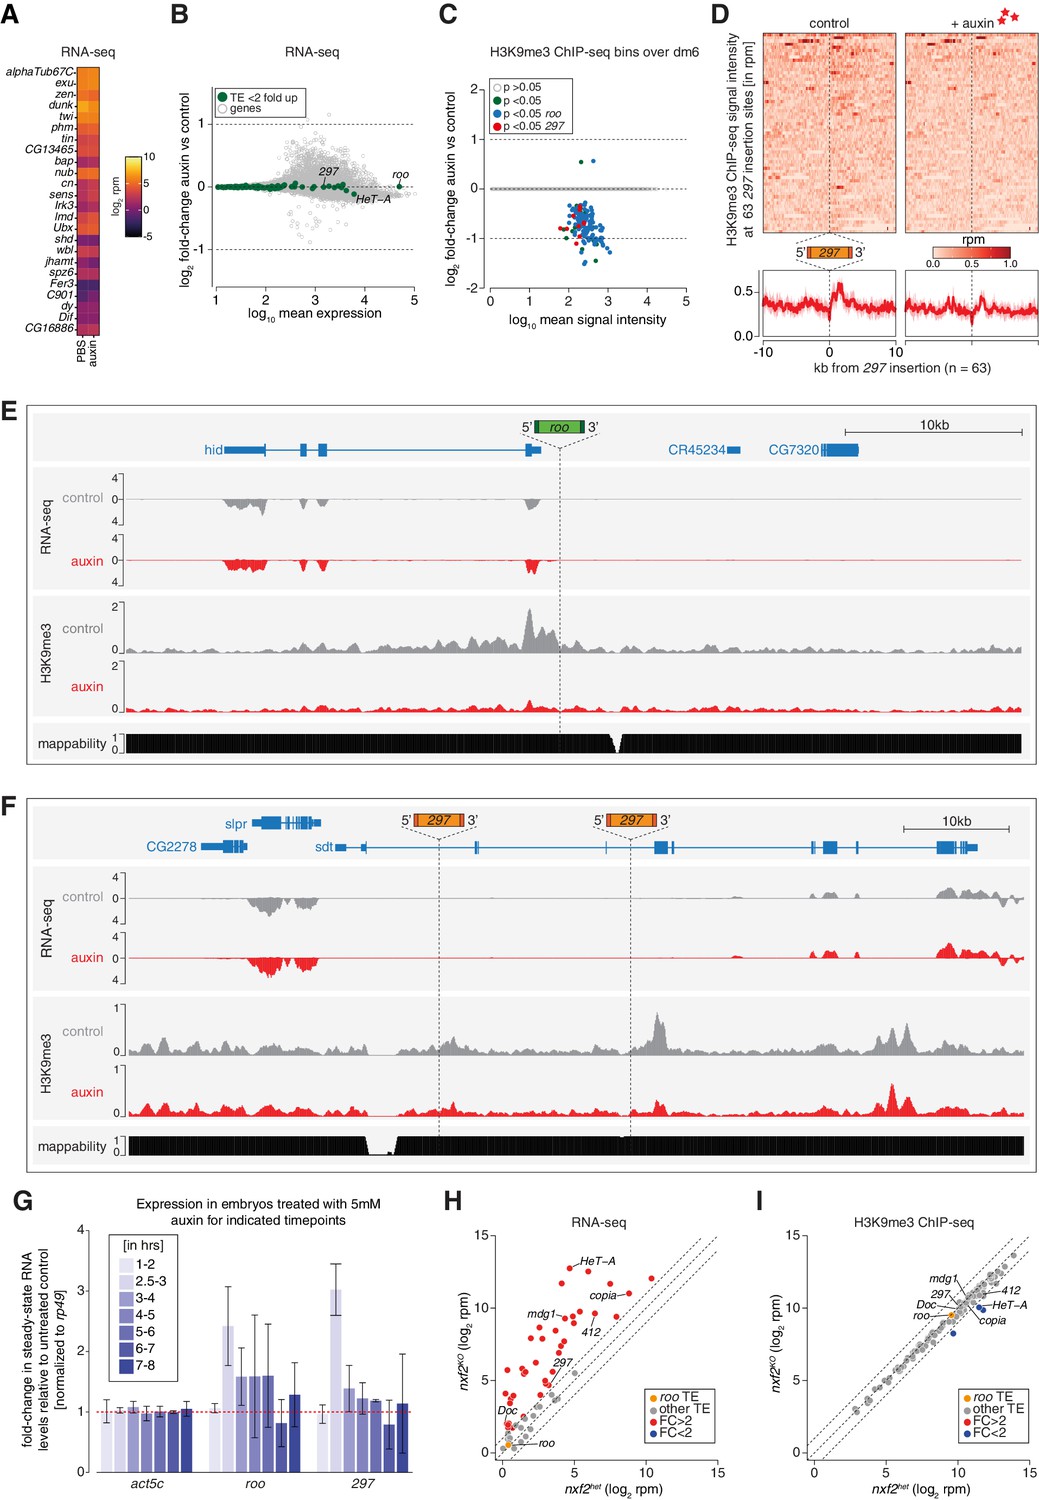
Piwi depletion in embryos leads to epigenetic changes at transposable element (TE) insertions targeted by maternally inherited piRNAs.
(A) Heatmap comparing expression profiles of selected genes (same as shown in Figure 1—figure supplement 1) in RNA-seq (in log2 reads per million) of 2.5–3 hr PBS or auxin-treated embryos of genotype GFP-AID-Piwi; OsTIR1 (n = 3). (B) MA plot showing base mean expression (log10 scale) of genes and transposons relative to their fold-change (log2 scale) in GFP-AID-Piwi embryos (without OsTIR1) treated with 5 mM auxin versus control (n = 3). Gray = genes, green = TEs not changed (p>0.05). (C) MA plot showing base mean signal intensity (log10 scale) of TEs relative to the H3K9me3 ChIP-seq signal within 5 kb genomic bins of GFP-AID-Piwi; OsTIR1 embryos treated with 5 mM auxin versus control (n = 3). Gray = unchanged (p>0.05), green = significantly changed (p<0.05), blue = significantly changed (p<0.05) within 5 kb of a roo insertion, red = significantly changed (p<0.05) within 5 kb of a 297 insertion. (D) Heatmaps (top) and metaplots (bottom) showing H3K9me3 ChIP-seq signal (in rpm) for control embryos and 5 mM auxin-treated embryos at 63 euchromatic, degron strain-specific 297 insertions (n = 3). Signal is shown within 10 kb from insertion site and sorted from 5′ to 3′. (E) UCSC genome browser screenshot showing RNA-seq and H3K9me3 ChIP-seq signal of control and auxin-treated embryos (derived from flies homozygous for GFP-AID-Piwi; OsTIR1) at the indicated, degron strain-specific roo insertion on chromosome 3L. (F) As in (E) but showing a genomic locus with two degron strain-specific 297 insertion sites. (G) Bar graphs showing rp49-normalized steady-state RNA levels of the indicated TEs and control gene in GFP-AID-Piwi; OsTIR1 embryos at the indicated time intervals (after egg laying [AEL]) treated with 5 mM auxin compared to PBS-treated control embryos. Error bars show standard deviation (n = 2). (H) Scatter plot showing RNA expression levels (in rpm, log2 scale) of transposons from ovaries of nxf2 heterozygote and homozygote mutants (n = 3). Transposons whose abundance change more than twofold compared to heterozygotes are highlighted in red, roo is shown in orange. Data reanalyzed from Fabry et al., 2019. (I) As in (H) but showing H3K9me3 ChIP-seq levels. Transposons with more than twofold reduced levels in the mutant compared to heterozygotes are shown in blue.
Author response image 1
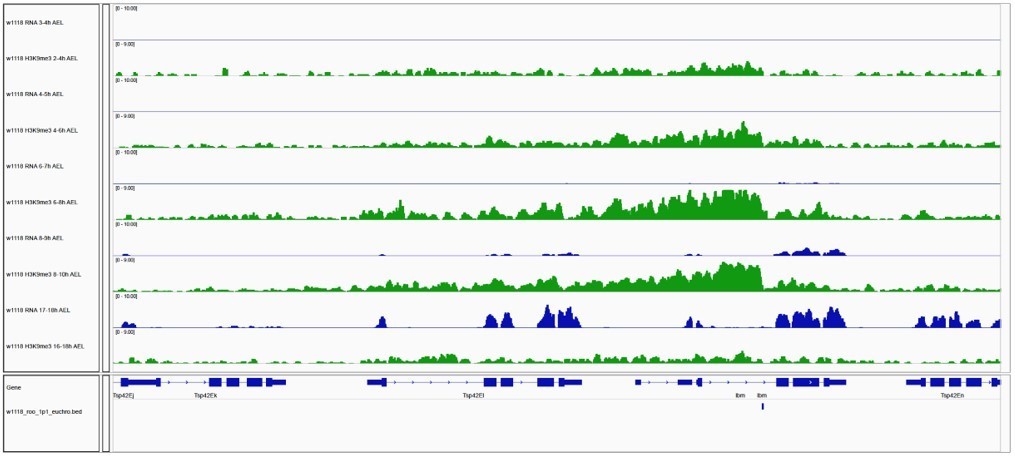
Gene expression and H3K9me3 occupancy of genes in proximity of euchromatic TE insertions.
IGV genome browser screenshot showing H3K9me3 ChIP-seq signal for the indicated genes on chromosome 2R carrying a w1118-specific roo insertion. Blue tracks show gene expression for indicated embryo time points (in rpm; n=2). Green tracks illustrate H3K9me3 occupancy at comparable time points (in rpm; n=2).
Author response image 2
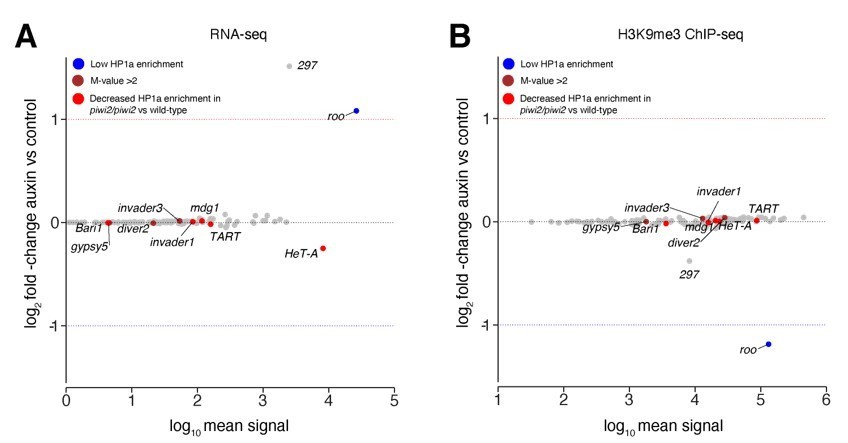
Transposons sensitive to Piwi reduction in larvae showed no change in our study.
(A) MA plot showing base mean expression (log10 scale) of transposon RNAs relative to their fold-change (log2 scale) in GFP-AID-Piwi; OsTIR1 embryos treated with 5mM auxin versus control (n=3). Blue=TE classes with low HP1a enrichment in wild type larvae as reported in Gu et al., 2013. Brown=TE classes with reported HP1a enrichment >2 fold over input in wild type larvae as reported in Gu et al., 2013. Red=TE classes with reported loss of HP1a enrichment in piwi2/piwi2 mutants vs control as reported in Gu et al., 2013. (B) MA plot showing base mean signal intensity (log10 scale) of TEs relative to the H3K9me3 ChIP-seq signal enrichment (log2 scale) in GFP-AID-Piwi; OsTIR1 embryos treated with 5mM auxin versus control (n=3). Colour scheme same as in (A).
Videos
Video 1
GFP-Piwi live imaging.
Light-sheet fluorescent live microscopy of embryos derived from parents expressing GFP-Piwi (green) and H2Av-RFP (red) in developing embryos for indicated time after egg laying.
Video 2
GFP-Panx live imaging.
Light-sheet fluorescent live microscopy of embryos derived from parents expressing GFP-Panx (green) and H2Av-RFP (red) in developing embryos for indicated time after egg laying.
Video 3
GFP-Nxf2 live imaging.
Light-sheet fluorescent live microscopy of embryos derived from parents expressing GFP-Nxf2 (green) and H2Av-RFP (red) in developing embryos for indicated time after egg laying.
Video 4
GFP-AID-Piwi live imaging.
Light-sheet fluorescent live microscopy of embryos derived from parents expressing GFP-AID-Piwi (green) and OsTIR1. Time course shows early embryo treated with 5 mM auxin for indicated time points.
Tables
Key resources table
| Reagent type (species) or resource | Designation | Source or reference | Identifiers | Additional information |
|---|---|---|---|---|
| Gene (Drosophila melanogaster) | nxf2 | FlyBase | FBgn0036640 | |
| Gene (Drosophila melanogaster) | panx | FlyBase | FBgn0034617 | |
| Gene (Drosophila melanogaster) | piwi | FlyBase | FBgn0004872 | |
| Gene (Drosophila melanogaster) | roo | FlyBase | FBgn0043856 | |
| Antibody | Anti-GFP (chicken polyclonal) | Abcam | Cat# ab13970 RRID:AB_300798 | WB (1:5000) IF (1:1000) |
| Antibody | Anti-Piwi (rabbit polyclonal) | DOI: 10.1016/j.cell.2007.01.043 | N/A | WB (1:1000) IF (1:500) |
| Antibody | Anti-Tubulin (mouse monoclonal) | Abcam | Cat# ab44928, RRID:AB_2241150 | WB (1:5000) |
| Antibody | Anti-Myc tag (rabbit polyclonal) | Abcam | Cat# ab9106, RRID:AB_307014 | WB (1:1000) |
| Antibody | Anti-H3K4me2 (rabbit polyclonal) | Merck Millipore | Cat# 07-030, RRID:AB_310342 (Lot# 2971019) | ChIP (1:50) |
| Antibody | Anti-H3K9me3 (rabbit polyclonal) | Active Motif | Cat# 39161, RRID:AB_2532132 (Lot# 15617003) | ChIP (1:50) |
| Antibody | Anti-Mouse IgG Alexa Fluor 488 (goat polyclonal) | Thermo Fisher Scientific | Cat# A-11029, RRID:AB_2534088 | IF (1:500) |
| Antibody | Anti-Mouse IgG Alexa Fluor 555 (goat polyclonal) | Thermo Fisher Scientific | Cat# A-21424, RRID:AB_141780 | IF (1:500) |
| Antibody | Anti-Rabbit IgG Alexa Fluor 647 (goat polyclonal) | Thermo Fisher Scientific | Cat# A-21245, RRID:AB_2535813 | IF (1:500) |
| Commercial assay or kit | RIPA Lysis and Extraction Buffer | Thermo Fisher Scientific | Cat# 89901 | |
| Commercial assay or kit | cOmplete, Mini, EDTA-free Protease Inhibitor Cocktail | Sigma-Aldrich | Cat#11836170001 | |
| Commercial assay or kit | RNasin Plus RNase Inhibitor | Promega | Cat# N2615 | |
| Commercial assay or kit | Blood and Cell Culture DNA Mini Kit | Qiagen | Cat# 13323 | |
| Commercial assay or kit | RNeasy Mini Kit | Qiagen | Cat# 74106 | |
| Commercial assay or kit | NEBNext Poly(A) mRNA Magnetic Isolation Module | NEB | Cat# E7490L | |
| Commercial assay or kit | NEBNext Ultra Directional RNA Library Prep Kit for Illumina | NEB | Cat# E7420L | |
| Commercial assay or kit | NEBNext Ultra II DNA Library Prep Kit for Illumina | NEB | Cat# E7645L | |
| Commercial assay or kit | Invitrogen SuperScript IV Reverse Transcriptase | Thermo Fisher Scientific | Cat# 18090050 | |
| Commercial assay or kit | Indole-3-acetic acid sodium salt | Sigma-Aldrich | Cat# I5148-10G | |
| Commercial assay or kit | Pierce 16% formaldehyde (w/v), methanol-free | Thermo Fisher Scientific | Cat# 28908 | |
| Commercial assay or kit | MinElute PCR Purification Kit | Qiagen | Cat# 28004 | |
| Software, algorithm | Fiji | ImageJ | RRID:SCR_002285 | |
| Software, algorithm | Zeiss ZEN Imaging Software | Zeiss | RRID:SCR_018163 | |
| Software, algorithm | Proteome Discoverer 2.1 | Thermo Fisher Scientific | RRID:SCR_014477 | |
| Software, algorithm | R | RCoreTeam | N/A | |
| Software, algorithm | STAR | DOI:10.1093/bioinformatics/bts635 | RRID:SCR_015899 | |
| Software, algorithm | TEMP | https://github.com/JialiUMassWengLab/TEMPZhuang et al., 2014 | RRID:SCR_001788 | |
| Software, algorithm | Prodigal | https://github.com/hyattpd/Prodigal | N/A | |
| Software, algorithm | DEseq2 | DOI:10.1186/s13059-014-0550-8 | RRID:SCR_015687 | |
| Software, algorithm | Image Studio Lite | LI-COR | RRID:SCR_013715 |
Additional files
-
Supplementary file 1
List of oligonucleotides for qRT-PCR and RNA-FISH.
- https://cdn.elifesciences.org/articles/68573/elife-68573-supp1-v2.xlsx
-
Transparent reporting form
- https://cdn.elifesciences.org/articles/68573/elife-68573-transrepform-v2.pdf
Download links
A two-part list of links to download the article, or parts of the article, in various formats.
Downloads (link to download the article as PDF)
Open citations (links to open the citations from this article in various online reference manager services)
Cite this article (links to download the citations from this article in formats compatible with various reference manager tools)
Maternally inherited piRNAs direct transient heterochromatin formation at active transposons during early Drosophila embryogenesis
eLife 10:e68573.
https://doi.org/10.7554/eLife.68573


