Allele-specific gene expression can underlie altered transcript abundance in zebrafish mutants
- Cambridge Institute of Therapeutic Immunology & Infectious Disease (CITIID), Department of Medicine, University of Cambridge, United Kingdom
- Department of Cell and Developmental Biology, University College London, United Kingdom
- School of Biological and Behavioural Sciences, Faculty of Science and Engineering, Queen Mary University of London, United Kingdom
Figures
Figure 1
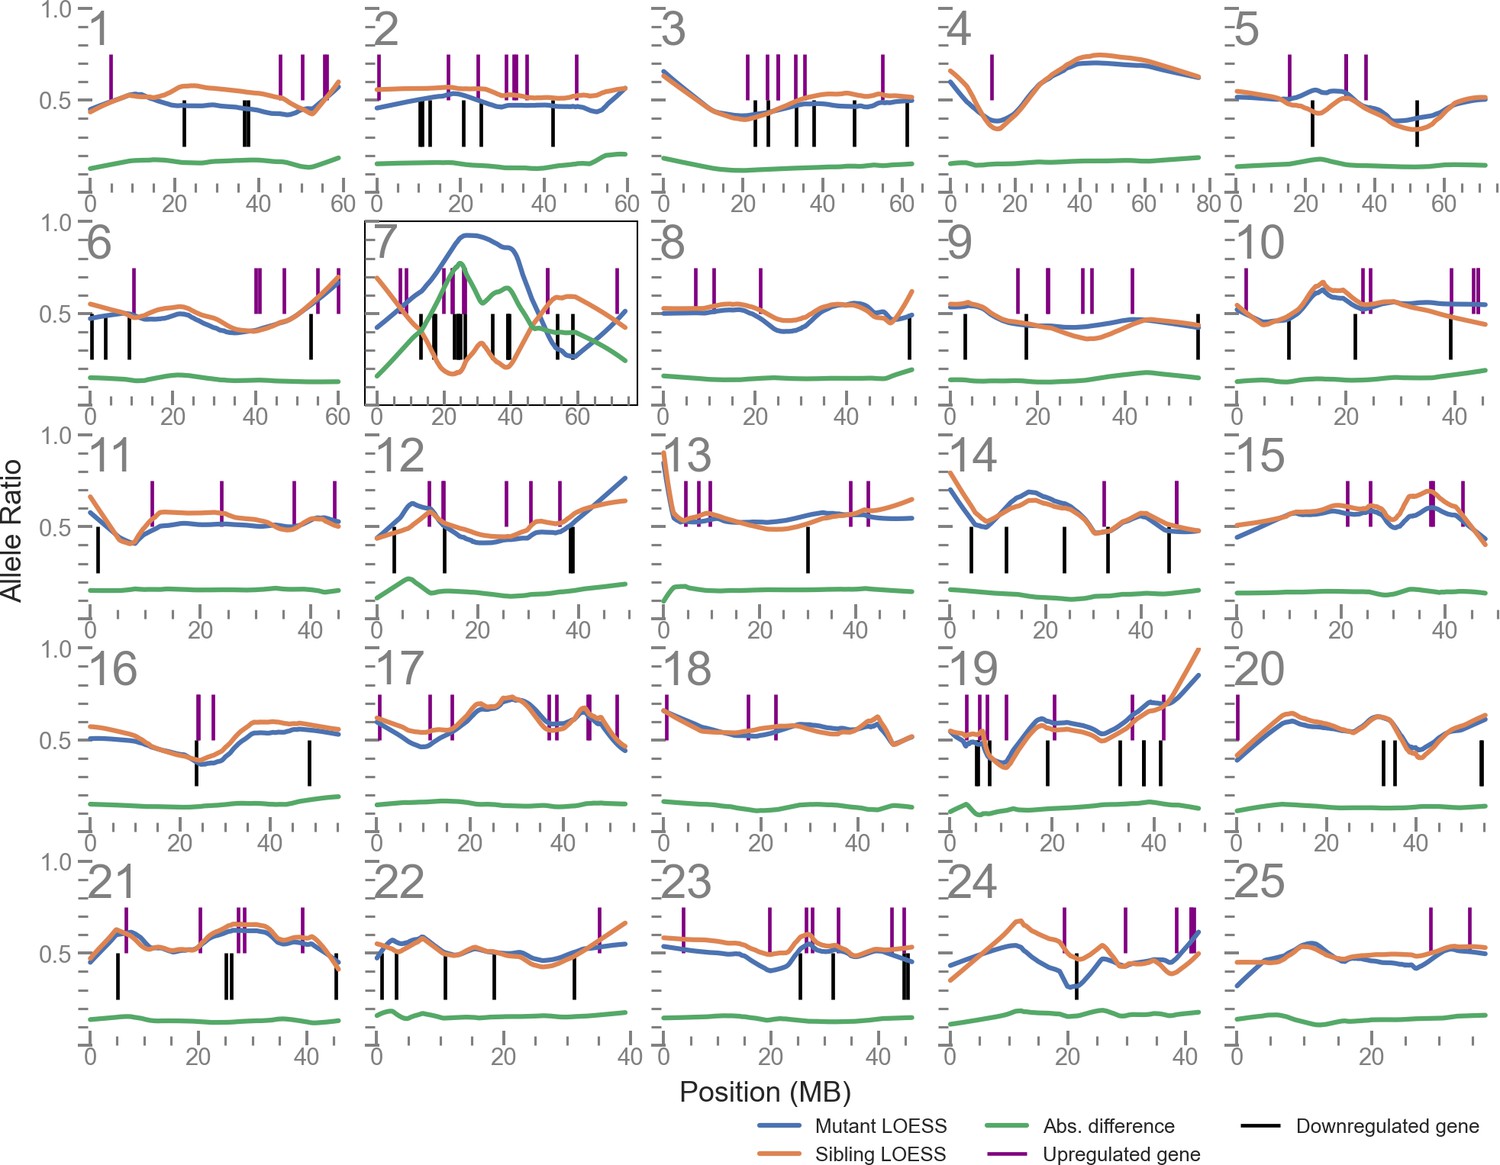
Linkage disequilibrium (LD) mapping plot of up- and downregulated genes in u426 mutants shows a cluster of such genes local to the mutation site on chromosome 7.
The plots for each of the 25 chromosomes shows the allele balance (proportion of reads containing the alternative allele) of each single nucleotide polymorphism (SNP) locus along with its physical position. The blue and orange lines are LOESS-smoothed averages of the data. The green line is the absolute difference of the mutant and sibling samples and is used to identify the region of highest LD. Vertical lines indicate the position of differentially expressed genes.
Figure 2

Enrichment of differentially expressed (DE) genes on the mutant chromosome.
(A) Ideogram showing the locations of the DE genes in a mitfaw2 incross. Circles represent DE genes and are coloured red if the gene is upregulated in the mutant embryos and blue if it is downregulated. (B) Distribution of the total number of DE genes in experiments according to whether there is an enrichment on the mutant chromosome (orange) or not (blue), plotted on a log10 scale. (C) Plot of normalised counts according to genotype in an intercross of two different sox10 alleles. Yellow = wild type (+/+), orange = sox10 t3 heterozygotes (t3/+), blue = sox10 baz1 heterozygotes (+/baz1), purple = sox10 t3, baz1 compound heterozygotes (t3/baz1). The schematic below the plot shows the chromosomes contributing to each genotype. Embryos that share the wild-type allele inherited from the baz1/+ parent (yellow chromosome) show higher expression levels.
-
Figure 2—source data 1
Genomic positions of differentially expressed (DE) genes.
Position of DE genes in w2 (mitfa) mutant at Prim-5 (24 hr post-fertilisation [hpf]).
- https://cdn.elifesciences.org/articles/72825/elife-72825-fig2-data1-v2.txt
-
Figure 2—source data 2
DeTCT differentially expressed (DE) genes data.
Number of DE genes for each experiment and whether the mutant chromosome shows an enrichment of DE genes.
- https://cdn.elifesciences.org/articles/72825/elife-72825-fig2-data2-v2.xlsx
-
Figure 2—source data 3
Counts for si:ch73-308m11.1.
Normalised counts for si:ch73-308m11.1 (ENSDARG00000039752) in sox10 t3/baz1 incross at Prim-5 (24 hr post-fertilisation [hpf]).
- https://cdn.elifesciences.org/articles/72825/elife-72825-fig2-data3-v2.xlsx
Figure 3 with 1 supplement
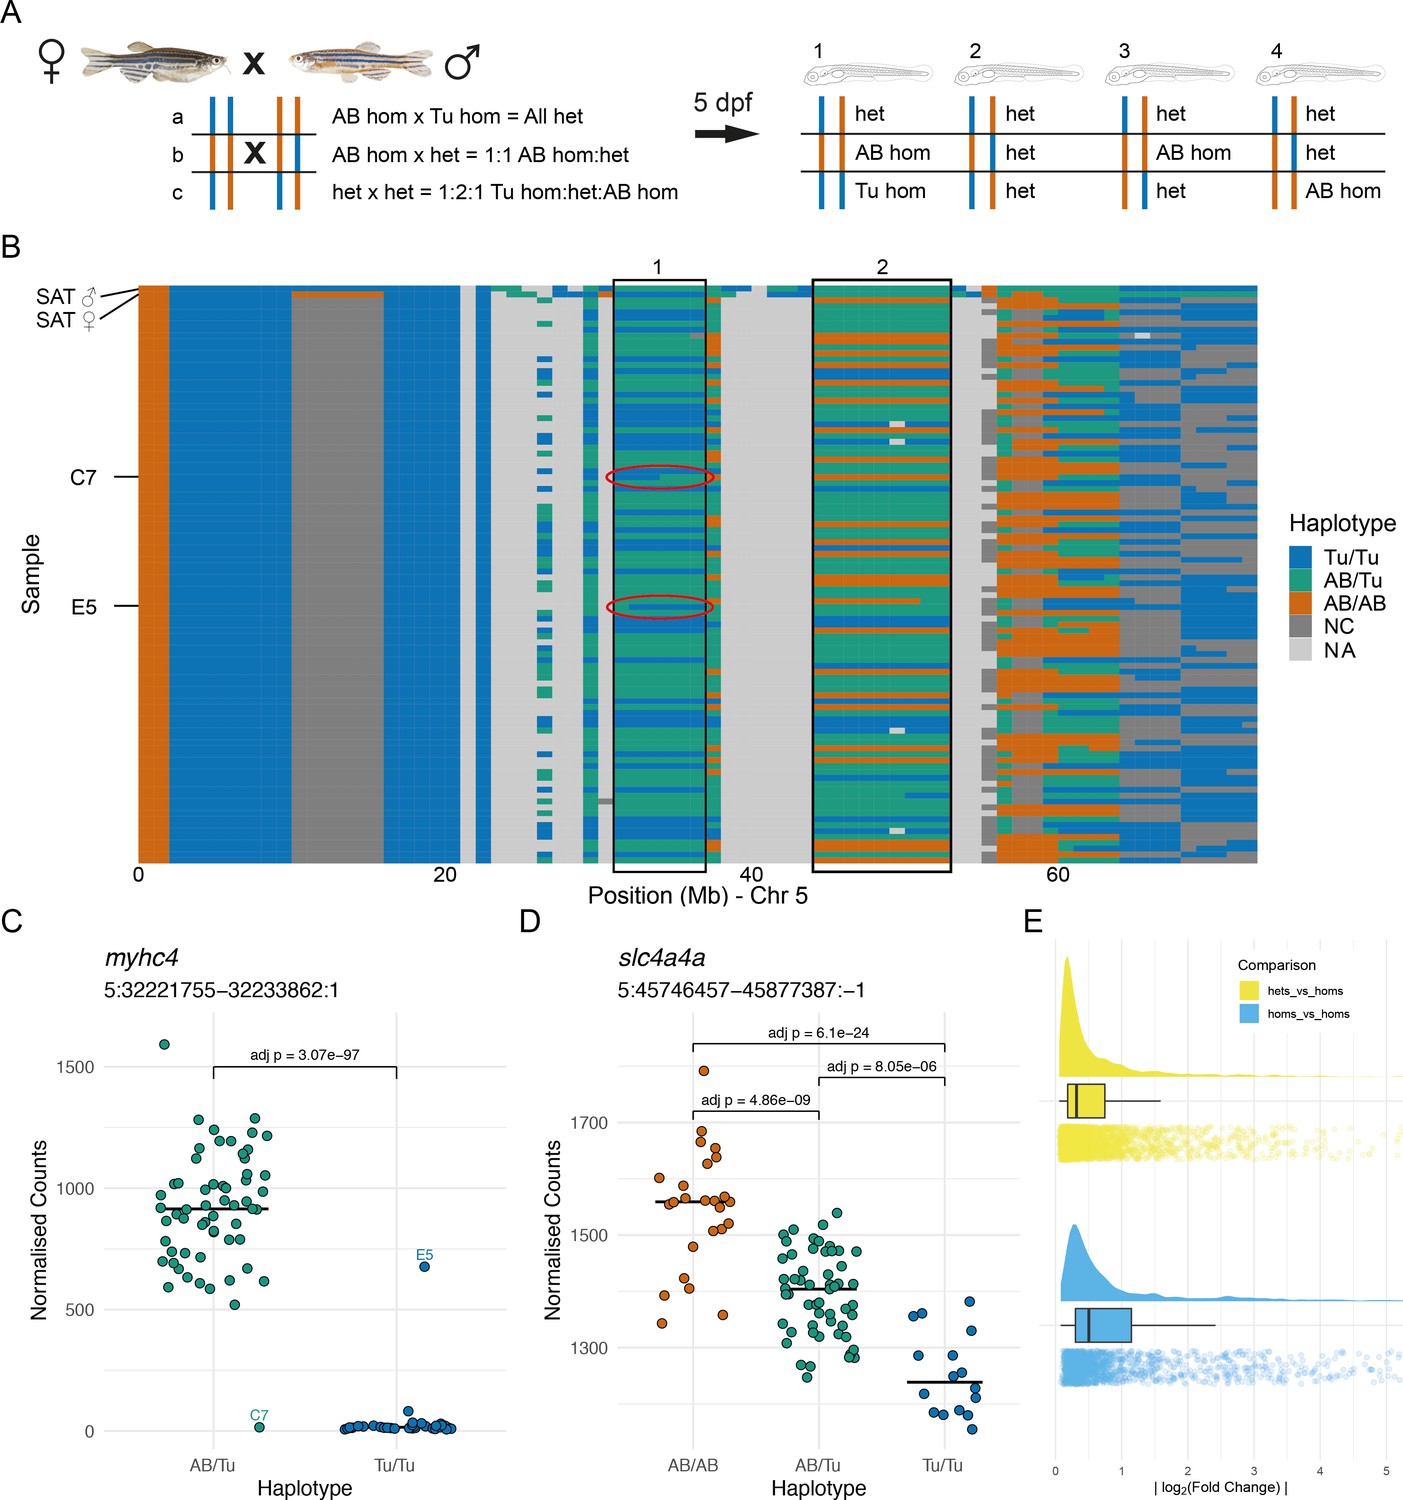
Allele-specific expression is common in wild-type embryos.
(A) Experimental design. Two wild-type SAT fish were incrossed and 96 embryos were collected for RNA-sequencing (RNA-seq) at 5 days post-fertilisation (dpf). Depending on the haplotypes of the parents, different combinations of genotype are possible in specific regions in the offspring. (B) The haplotypes of the collected embryos were determined in 1 Mbp bins using the RNA-seq reads and the embryos were grouped according to the haplotypes in specific regions. Chromosome 5 is shown with chromosomal position along the x-axis and samples on the y-axis. 1 Mbp bins are coloured according to the haplotype in that region. Blue = homozygous Tübingen (Tu/Tu), green = heterozygous AB/Tübingen (AB/Tu), orange = homozygous AB (AB/AB), dark grey = not consistent with parental haplotypes (NC), light grey = no haplotype call (NA), due to, for example, low coverage. Examples of regions used to group the embryos are boxed. Red ovals indicate regions containing recombination breakpoints in the samples labelled in (C). (C–D) Examples of differentially expressed genes from two different groupings. (C) Counts for the myhc4 gene, grouped according to the haplotypes in the region 5:31–37 Mbp (region 1 in B). The Tübingen allele is expressed at very low levels, with much higher expression in the heterozygotes. There are two examples of embryos with recombinations within the region. Compare to red ovals in the haplotype plot in (B). (D) Example of a differentially expressed gene (slc4a4a) in a region where all three genotypes are present (5:44–53 Mbp, region 2 in B). As in (C), the Tübingen allele has lower expression, with the heterozygotes showing intermediate levels. (E) Distribution of absolute log2(fold change) values found between wild-type alleles. Differences when comparing homozygous embryos (blue) are generally larger than when comparing heterozygotes to homozygotes (yellow).
-
Figure 3—source data 1
Chr5 haplotype data in the wild-type SAT cross.
- https://cdn.elifesciences.org/articles/72825/elife-72825-fig3-data1-v2.xlsx
-
Figure 3—source data 2
Counts for myhc4.
Normalised counts for myhc4 (ENSDARG00000035438) in wild-type SAT cross.
- https://cdn.elifesciences.org/articles/72825/elife-72825-fig3-data2-v2.xlsx
-
Figure 3—source data 3
Counts for slc4a4a.
Normalised counts for slc4a4a (ENSDARG00000013730) in wild-type SAT cross.
- https://cdn.elifesciences.org/articles/72825/elife-72825-fig3-data3-v2.xlsx
-
Figure 3—source data 4
Log2 fold Change data.
Log2 fold change data for differentially expressed genes in wild-type SAT cross.
- https://cdn.elifesciences.org/articles/72825/elife-72825-fig3-data4-v2.xlsx
Figure 3—figure supplement 1
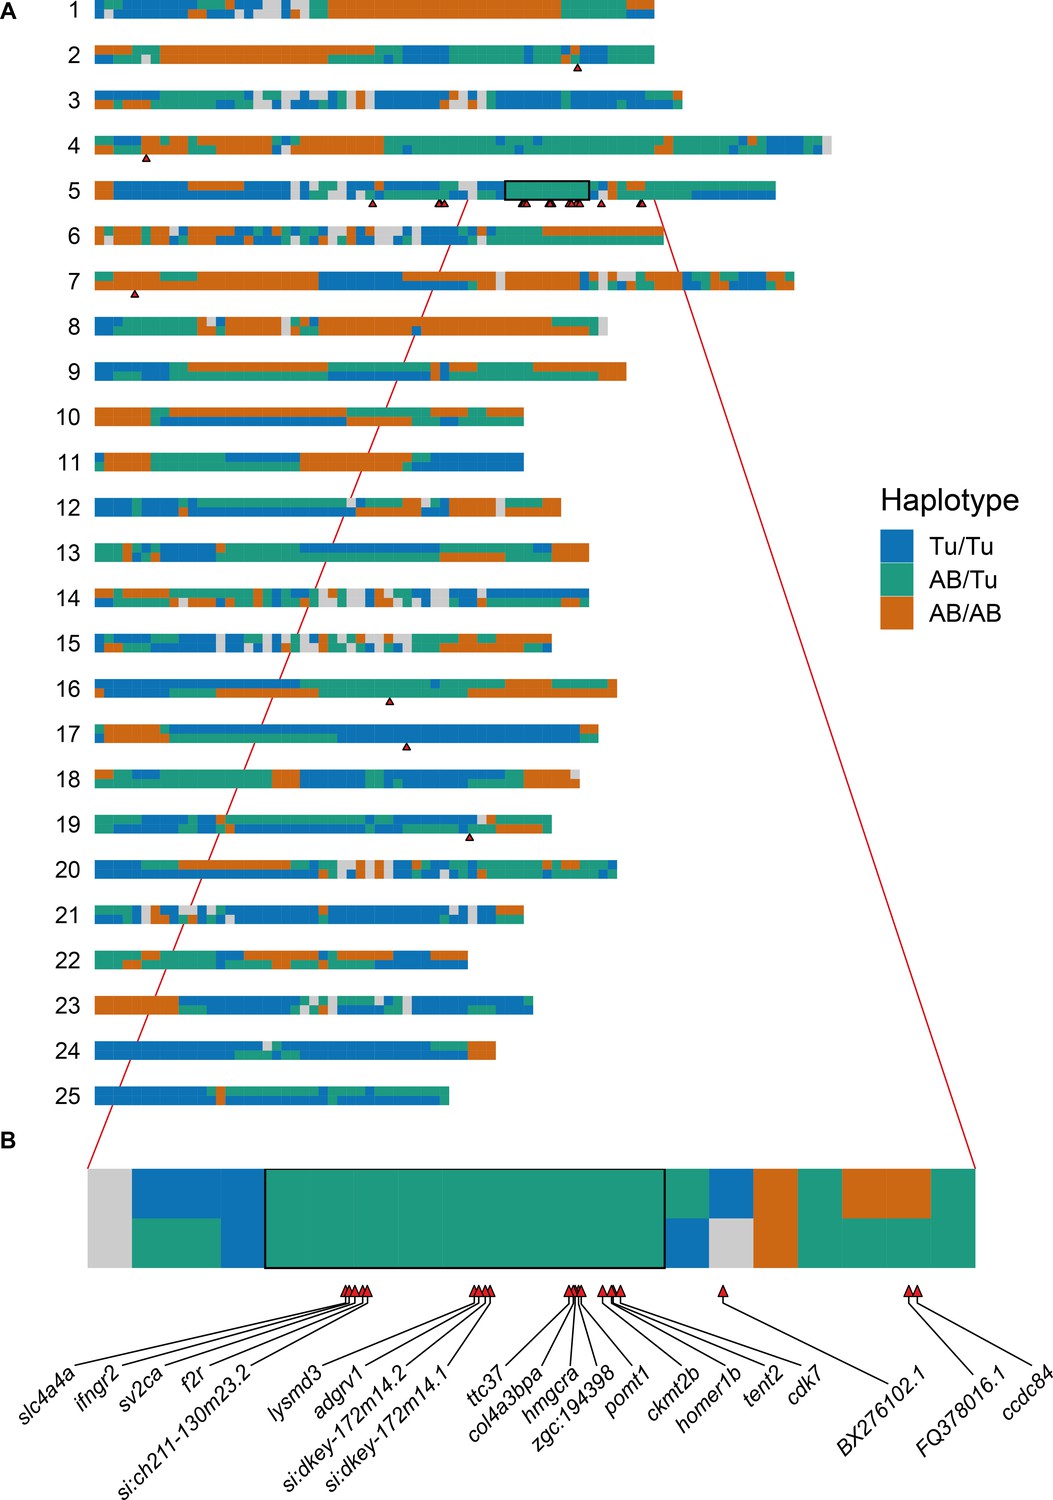
Allele-specific expression is linked to the region used to define the sample groupings.
(A) Representation of the parental haplotypes of the SAT cross across all 25 chromosomes (blue = Tu/Tu, green = AB/Tu, orange = AB/AB). The black box shows the region (Chr5:44–53 Mb) that was used to define the groups of embryos compared using DESeq2. The red triangles show the positions of the genes that are differentially expressed when using this sample grouping, most of which are in or close to the region. (B) Expanded plot of chromosome 5 from 40 to 60 Mb. The differentially expressed genes are labelled.
Figure 4

Effect of removing differentially expressed (DE) genes linked to the mutation under investigation.
(A) Distribution of the overlap between the Gene Ontology (GO) terms enriched when DE genes linked to the mutation are removed. GO term enrichment was done on both the DE gene list and the list with the genes on the same chromosome as the mutation removed (excluding the mutated gene itself). The lists of enriched GO terms were then compared and the Jaccard similarity coefficient (number of GO terms enriched in both sets/total number of enriched GO terms) calculated. Each point represents one experiment. Experiments are split according to whether the chromosome with the mutated gene has an enrichment of DE genes or not. Points are coloured by the number of DE genes identified in the experiment (log10 scale). (B) Plot showing the changes in GO term enrichment for a single experiment (sox10t3/baz1 incross at 36 hr post-fertilisation). Each point is an enriched GO term ranked by p-value (highest ranked terms at the top) and the lines connect the same terms if they are enriched using both gene lists (all genes or genes linked to the mutation removed). Unconnected points are terms that are only enriched for either the ‘all genes’ list (open circles) or for the ‘linked genes removed list’ (open squares). (C) Network diagram representation of the same GO enrichments as in (B). Each node represents a GO term, and the nodes are connected by an edge if the genes annotated to the term overlap sufficiently (Cohen’s kappa > 0.4). GO term nodes are coloured by whether they are enriched in both lists (orange) or just one (blue = all genes only, green = linked genes removed only). The shape of the nodes represents the GO term domain of the term (circle = biological process, square = cellular component, hexagon = molecular function).
-
Figure 4—source data 1
Gene Ontology (GO) enrichments overlaps.
Jaccard index for each experiment represented in the boxplot.
- https://cdn.elifesciences.org/articles/72825/elife-72825-fig4-data1-v2.xlsx
-
Figure 4—source data 2
Gene Ontology (GO) enrichments for sox10t3/baz1 incross at 36 hr post-fertilisation (hpf).
Enriched GO terms and their position in the list of GO terms by p-value.
- https://cdn.elifesciences.org/articles/72825/elife-72825-fig4-data2-v2.xlsx
Figure 5 with 1 supplement
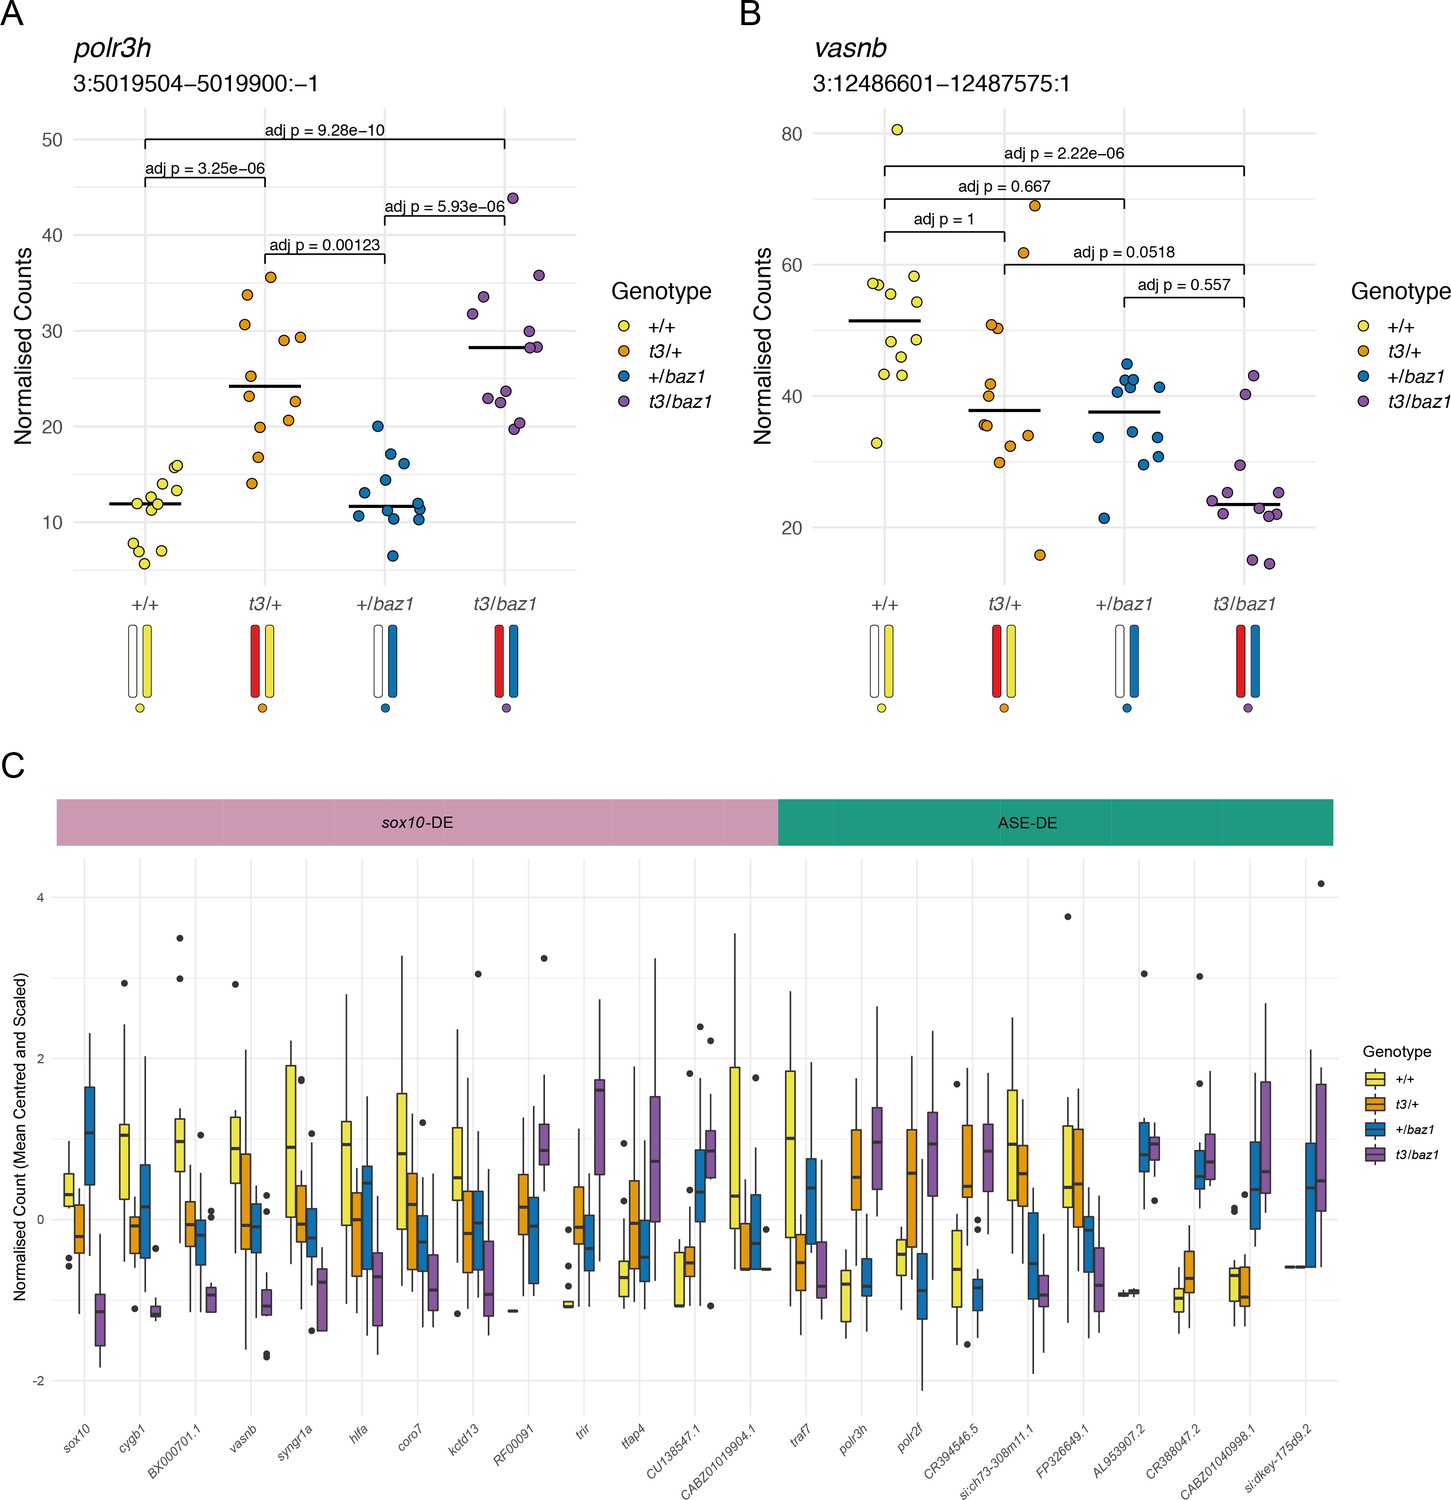
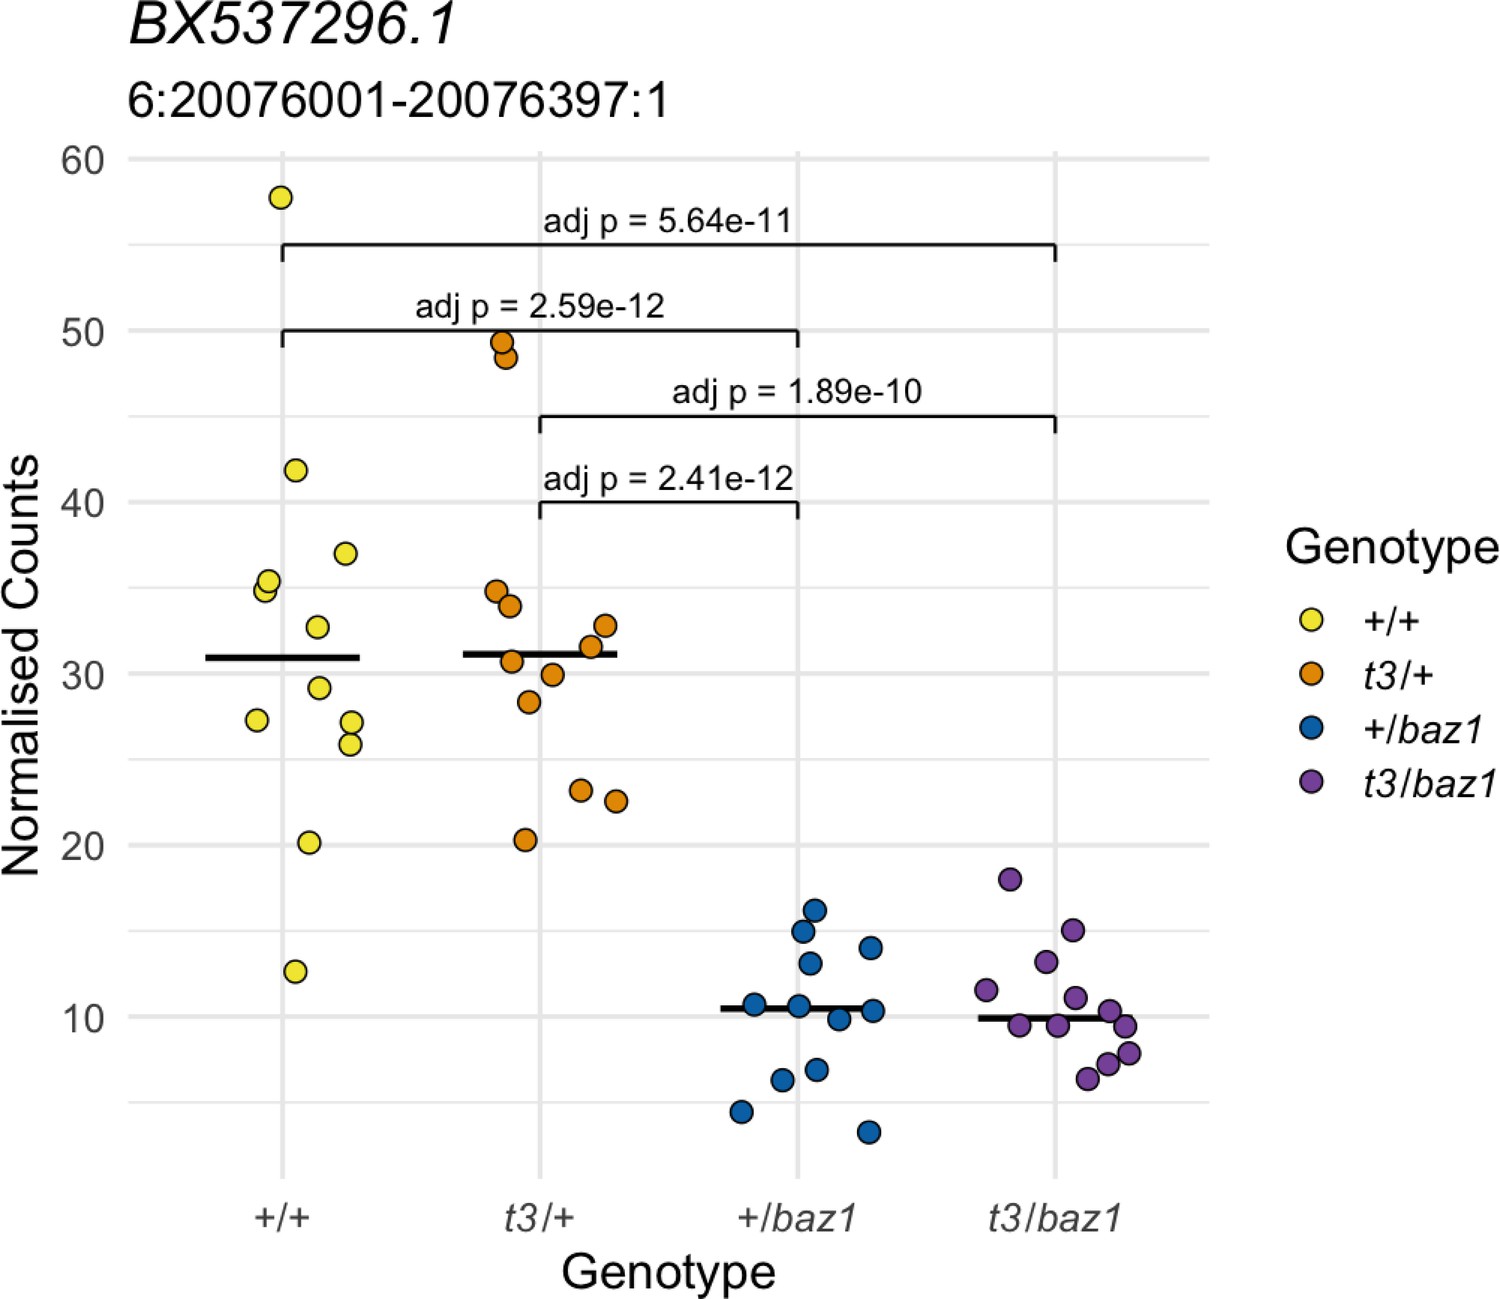
Distinguishing mutation-dependent gene expression changes from allele-specific expression (ASE).
(A) Plot of normalised counts consistent with ASE. This shows either reduced expression from the allele on one of the wild-type chromosomes (white chromosome in the diagram under the plot) or increased expression from the allele on the t3 chromosome (red chromosome). Yellow = wild-types (+/+), orange = t3 heterozygotes (t3/+), blue = baz1 heterozygotes (+/baz1), purple = compound heterozygotes (t3/baz1). (B) Normalised counts consistent with a response to the sox10 mutations. The compound heterozygotes have reduced expression and the other two groups of heterozygotes are intermediate between the compound heterozygotes and the wild types. (C). Boxplots of the expression of all the differentially expressed (DE) genes on chromosome 3. These are split into two groups, those that are consistent with being downstream of sox10 (sox10-DE) and those that appear to be driven by allele-specific expression unrelated to sox10 (ASE-DE).
-
Figure 5—source data 1
Counts for polr3h.
Normalised counts for polr3h (ENSDARG00000102590) in sox10t3/baz1 incross at Prim-5 (24 hr post-fertilisation [hpf]).
- https://cdn.elifesciences.org/articles/72825/elife-72825-fig5-data1-v2.xlsx
-
Figure 5—source data 2
Counts for vasnb.
Normalised counts for vasnb (ENSDARG00000102565) in sox10t3/baz1 incross at Prim-5 (24 post-fertilisation [hpf]).
- https://cdn.elifesciences.org/articles/72825/elife-72825-fig5-data2-v2.xlsx
-
Figure 5—source data 3
Counts for the genes represented in Figure 5C.
Normalised counts for the genes represented by the boxplots in Figure 5C (sox10t3/baz1 incross at Prim-5/24 hr post-fertilisation [hpf]).
- https://cdn.elifesciences.org/articles/72825/elife-72825-fig5-data3-v2.xlsx
Figure 5—figure supplement 1
Allele-specific expression not linked to the homozygous region.
The expression of this gene according to genotype is not consistent with a response to a recessive mutation. Yellow = wild types (+/+), orange = t3 heterozygotes (t3/+), blue = baz1 heterozygotes (+/baz1), purple = compound heterozygotes (t3/baz1).
Tables
Table 1
Summary of logistic regression results for RNA-sequencing (RNA-seq) analysed mutant lines.
Causative mutation shows the gene and location of the mutation site in lines where this has been confirmed empirically, otherwise the location is estimated from linkage disequilibrium (LD) data. Significance column indicates adjusted p-value (***: < 0.001, **: < 0.01; *: < 0.05). Odds ratio compares DE likelihood at maximum LD versus site of median LD. The nearby genes column shows the number of DE genes lying within a 20 Mbp window centred on the mutation site, and the percentage of these genes out of the total DE genes. In-table citations: 1(Barlow et al., 2020), 2(Miesfeld et al., 2015), 3(Armant et al., 2016). nl14 line kindly provided by Alex Nechiporuk.
| Allele | Causative mutation | DE genes/total | Coefficient ± SEM | Sig. | Odds ratio | Nearby genes (%) |
|---|---|---|---|---|---|---|
| nl14 | lama1 unpublished(chr24, 41.6Mbp) | 12/31,664 | 9.09 ± 1.56 | *** | 118.5 | 3 (25%) |
| la0155771 | dmist (chr5, 19.9 Mbp) | 157/31,199 | 6.84 ± 0.46 | *** | 55.8 | 23 (15%) |
| u5051 | dmist (chr5, 19.9 Mbp) | 71/31,199 | 8.72 ± 0.72 | *** | 44.0 | 13 (18%) |
| u757 | Unpublished (chr23, 22 Mbp) | 33/31,199 | 6.31 ± 2.13 | ** | 7.8 | 1 (3%) |
| u534 | Not known (chr1, ~25 Mbp) | 87/31,664 | 4.83 ± 1.05 | *** | 5.4 | 4 (5%) |
| u426 | Not known (chr7, ~22 Mbp) | 209/31,664 | 2.67 ± 0.48 | *** | 5.3 | 15 (7%) |
| nl132 | yap1 (chr18, 37.2 Mbp) | 140/31,199 | 2.58 ± 1.57 | – | 2.3 | 4 (3%) |
| sb553 | ache (chr 7, 26.0 Mbp) | 348/24,558 | 3.77 ± 1.67 | * | 2.0 | 14 (4%) |
| u535 | Not known (chr13, ~25 Mbp) | 294/31,663 | 0.35 ± 1.04 | – | 1.1 | 4 (1%) |
Key resources table
| Reagent type (species) or resource | Designation | Source or reference | Identifiers | Additional information |
|---|---|---|---|---|
| Gene (zebrafish, Danio rerio) | mitfa | Ensembl | ENSDARG00000003732 | |
| Gene (zebrafish, Danio rerio) | sox10 | Ensembl | ENSDARG00000077467 | |
| Gene (zebrafish, Danio rerio) | si:ch73-308m11.1 | Ensembl | ENSDARG00000039752 | |
| Gene (zebrafish, Danio rerio) | myhc4 | Ensembl | ENSDARG00000035438 | |
| Gene (zebrafish, Danio rerio) | slc4a4a | Ensembl | ENSDARG00000013730 | |
| Gene (zebrafish, Danio rerio) | polr3h | Ensembl | ENSDARG00000102590 | |
| Gene (zebrafish, Danio rerio) | vasnb | Ensembl | ENSDARG00000102565 | |
| Gene (zebrafish, Danio rerio) | gata3 | Ensembl | ENSDARG00000016526 | |
| Gene (zebrafish, Danio rerio) | ahsa1a | Ensembl | ENSDARG00000028664 | |
| Gene (zebrafish, Danio rerio) | BX537296.1 | Ensembl | ENSDARG00000110416 | |
| Gene (zebrafish, Danio rerio) | cygb1 | Ensembl | ENSDARG00000099371 | |
| Gene (zebrafish, Danio rerio) | BX000701.1 | Ensembl | ENSDARG00000099172 | |
| Gene (zebrafish, Danio rerio) | syngr1a | Ensembl | ENSDARG00000002564 | |
| Gene (zebrafish, Danio rerio) | hlfa | Ensembl | ENSDARG00000074752 | |
| Gene (zebrafish, Danio rerio) | coro7 | Ensembl | ENSDARG00000089616 | |
| Gene (zebrafish, Danio rerio) | kctd13 | Ensembl | ENSDARG00000044769 | |
| Gene (zebrafish, Danio rerio) | RF00091 | Ensembl | ENSDARG00000084991 | |
| Gene (zebrafish, Danio rerio) | trir | Ensembl | ENSDARG00000104178 | |
| Gene (zebrafish, Danio rerio) | tfap4 | Ensembl | ENSDARG00000103923 | |
| Gene (zebrafish, Danio rerio) | CU138547.1 | Ensembl | ENSDARG00000074231 | |
| Gene (zebrafish, Danio rerio) | CABZ01019904.1 | Ensembl | ENSDARG00000104193 | |
| Gene (zebrafish, Danio rerio) | traf7 | Ensembl | ENSDARG00000060207 | |
| Gene (zebrafish, Danio rerio) | polr2f | Ensembl | ENSDARG00000036625 | |
| Gene (zebrafish, Danio rerio) | CR394546.5 | Ensembl | ENSDARG00000112755 | |
| Gene (zebrafish, Danio rerio) | FP326649.1 | Ensembl | ENSDARG00000088820 | |
| Gene (zebrafish, Danio rerio) | AL953907.2 | Ensembl | ENSDARG00000113960 | |
| Gene (zebrafish, Danio rerio) | CR388047.2 | Ensembl | ENSDARG00000109888 | |
| Gene (zebrafish, Danio rerio) | CABZ01040998.1 | Ensembl | ENSDARG00000111638 | |
| Gene (zebrafish, Danio rerio) | si:dkey-175d9.2 | Ensembl | ENSDARG00000093476 | |
| Strain, strain background (zebrafish, Danio rerio) | AB | ZIRC | ZDB-GENO-960809–7 | |
| Strain, strain background (zebrafish, Danio rerio) | Tübingen | ZIRC | ZDB-GENO-990623–3 | |
| Strain, strain background (zebrafish, Danio rerio) | SAT | ZIRC | ZDB-GENO-100413–1 | |
| Genetic reagent (zebrafish, Danio rerio) | ENSDAR G00000089358sa19600 | PMID:23594742 | ZDB-ALT-190501–298 | |
| Genetic reagent (zebrafish, Danio rerio) | bace2hu3332 | PMID:23594742 | ZDB-ALT-100723–4 | |
| Genetic reagent (zebrafish, Danio rerio) | bmp7asa1343 | PMID:23594742 | ZDB-ALT-120411–112 | |
| Genetic reagent (zebrafish, Danio rerio) | cacna1csa6050 | PMID:23594742 | ZDB-ALT-161003–17955 | |
| Genetic reagent (zebrafish, Danio rerio) | capza1bta253a | PMID:23594742 | Allele not cryopreserved | |
| Genetic reagent (zebrafish, Danio rerio) | capzbhi1858bTg | PMID:23594742 | ZDB-ALT-040907–2 | |
| Genetic reagent (zebrafish, Danio rerio) | cax1sa10712 | PMID:23594742 | ZDB-ALT-130411–634 | |
| Genetic reagent (zebrafish, Danio rerio) | cdan1sa5902 | PMID:23594742 | ZDB-ALT- 161003–17833 | |
| Genetic reagent (zebrafish, Danio rerio) | cep192sa875 | PMID:23594742 | ZDB-ALT-120411–491 | |
| Genetic reagent (zebrafish, Danio rerio) | clp1sa6358 | PMID:23594742 | ZDB-ALT- 161003–18184 | |
| Genetic reagent (zebrafish, Danio rerio) | copb1sa3636 | PMID:23594742 | Allele not cryopreserved | |
| Genetic reagent (zebrafish, Danio rerio) | cyfip2sa1556 | PMID:23594742 | ZDB-ALT-120411–193 | |
| Genetic reagent (zebrafish, Danio rerio) | cyldasa21010 | PMID:23594742 | ZDB-ALT-161003–11078 | |
| Genetic reagent (zebrafish, Danio rerio) | dag1hu3072 | PMID:23594742 | ZDB-ALT-070315–1 | |
| Genetic reagent (zebrafish, Danio rerio) | dhx15sa7108 | PMID:23594742 | ZDB-ALT- 161003–18741 | |
| Genetic reagent (zebrafish, Danio rerio) | dmdta222a | PMID:23594742 | ZDB-ALT-980413–693 | |
| Genetic reagent (zebrafish, Danio rerio) | dnmt3aasa3105 | PMID:23594742 | Allele not cryopreserved | |
| Genetic reagent (zebrafish, Danio rerio) | dnmt3aasa617 | PMID:23594742 | ZDB-ALT-120411–432 | |
| Genetic reagent (zebrafish, Danio rerio) | dnmt3basa14480 | PMID:23594742 | ZDB-ALT-130411–3189 | |
| Genetic reagent (zebrafish, Danio rerio) | dnmt3bb.1sa15458 | PMID:23594742 | ZDB-ALT-130411–4030 | |
| Genetic reagent (zebrafish, Danio rerio) | frem2asa21742 | PMID:23594742 | ZDB-ALT- 161003–11257 | |
| Genetic reagent (zebrafish, Danio rerio) | glra1sa3896 | PMID:23594742 | Allele not cryopreserved | |
| Genetic reagent (zebrafish, Danio rerio) | gmdsp31erb | PMID:23594742 | ZDB-ALT-051012–8 | |
| Genetic reagent (zebrafish, Danio rerio) | gpaa1sa2042 | PMID:23594742 | ZDB-ALT- 161003–10931 | |
| Genetic reagent (zebrafish, Danio rerio) | greb1sa1260 | PMID:23594742 | ZDB-ALT-120411–60 | |
| Genetic reagent (zebrafish, Danio rerio) | grin2b (2 of 2)sa19927 | PMID:23594742 | ZDB-ALT-190501–603 | |
| Genetic reagent (zebrafish, Danio rerio) | hsp90aa1.1u45 | PMID:18256191 | ZDB-ALT-080401–1 | |
| Genetic reagent (zebrafish, Danio rerio) | jak2bsa20578 | PMID:23594742 | ZDB-ALT-161003–10984 | |
| Genetic reagent (zebrafish, Danio rerio) | kdm2aasa898 | PMID:23594742 | ZDB-ALT-120727–213 | |
| Genetic reagent (zebrafish, Danio rerio) | kdm2aasa9360 | PMID:23594742 | ZDB-ALT-161003–20015 | |
| Genetic reagent (zebrafish, Danio rerio) | kitlgatc244b | PMID:23364329 | ZDB-ALT-980203–1317 | |
| Genetic reagent (zebrafish, Danio rerio) | lamb2tm272a | PMID:19736328 | ZDB-ALT-980203–1438 | |
| Genetic reagent (zebrafish, Danio rerio) | lamc1sa379 | PMID:23594742 | ZDB-ALT-120411–351 | |
| Genetic reagent (zebrafish, Danio rerio) | las1lsa674 | PMID:23594742 | ZDB-ALT-120727–150 | |
| Genetic reagent (zebrafish, Danio rerio) | ldlrsa16375 | PMID:23594742 | ZDB-ALT-130411–4850 | |
| Genetic reagent (zebrafish, Danio rerio) | maptasa22009 | PMID:23594742 | ZDB-ALT-161003–11315 | |
| Genetic reagent (zebrafish, Danio rerio) | mdn1sa1349 | PMID:23594742 | ZDB-ALT-120411–117 | |
| Genetic reagent (zebrafish, Danio rerio) | megf10sa6166 | PMID:23594742 | ZDB-ALT-161003–18049 | |
| Genetic reagent (zebrafish, Danio rerio) | meis1sa9839 | PMID:23594742 | ZDB-ALT-130411–5422 | |
| Genetic reagent (zebrafish, Danio rerio) | mitfaw2 | PMID:10433906 | ZDB-ALT-990423–22 | |
| Genetic reagent (zebrafish, Danio rerio) | nebhu2849 | PMID:23594742 | ZDB-ALT-070730–10 | |
| Genetic reagent (zebrafish, Danio rerio) | bufti209 | PMID:9007258 | ZDB-ALT-980203–1049 | |
| Genetic reagent (zebrafish, Danio rerio) | nod2sa18880 | PMID:23594742 | ZDB-ALT-161003–10423 | |
| Genetic reagent (zebrafish, Danio rerio) | nol9sa1022 | PMID:23594742 | ZDB-ALT-120411–10 | |
| Genetic reagent (zebrafish, Danio rerio) | nol9sa1029 | PMID:23594742 | ZDB-ALT-160721–33 | |
| Genetic reagent (zebrafish, Danio rerio) | nup88sa2206 | PMID:23594742 | ZDB-ALT-120727–92 | |
| Genetic reagent (zebrafish, Danio rerio) | pax2asa24936 | PMID:23594742 | ZDB-ALT-161003–12106 | |
| Genetic reagent (zebrafish, Danio rerio) | pcnasa8962 | PMID:23594742 | ZDB-ALT-161003–19656 | |
| Genetic reagent (zebrafish, Danio rerio) | pla2g12bsa659 | PMID:23594742 | ZDB-ALT-161003–18374 | |
| Genetic reagent (zebrafish, Danio rerio) | pld1sa1311 | PMID:23594742 | ZDB-ALT-120411–91 | |
| Genetic reagent (zebrafish, Danio rerio) | polr1asa1376 | PMID:23594742 | ZDB-ALT-120411–135 | |
| Genetic reagent (zebrafish, Danio rerio) | ptf1asa126 | PMID:23594742 | ZDB-ALT-100506–17 | |
| Genetic reagent (zebrafish, Danio rerio) | rpl13sa638 | PMID:23594742 | ZDB-ALT-161003–18201 | |
| Genetic reagent (zebrafish, Danio rerio) | rps24sa2681 | PMID:23594742 | ZDB-ALT-161003–12995 | |
| Genetic reagent (zebrafish, Danio rerio) | ryr1sa23341 | PMID:23594742 | ZDB-ALT-161003–11675 | |
| Genetic reagent (zebrafish, Danio rerio) | ryr1sa6529 | PMID:23594742 | ZDB-ALT-161003–18326 | |
| Genetic reagent (zebrafish, Danio rerio) | sh3gl2sa19508 | PMID:23594742 | ZDB-ALT-161003–10694 | |
| Genetic reagent (zebrafish, Danio rerio) | si:ch211-168k14.2sa6115 | PMID:23594742 | ZDB-ALT-161003–18015 | |
| Genetic reagent (zebrafish, Danio rerio) | slc22a7bsa365 | PMID:23594742 | ZDB-ALT-120411–342 | |
| Genetic reagent (zebrafish, Danio rerio) | slc2a11bsa1577 | PMID:23594742 | ZDB-ALT-120411–200 | |
| Genetic reagent (zebrafish, Danio rerio) | smarce1sa18758 | PMID:23594742 | Allele not cryopreserved | |
| Genetic reagent (zebrafish, Danio rerio) | sox10baz1 | PMID:17065232 | ZDB-ALT-070131–1 | |
| Genetic reagent (zebrafish, Danio rerio) | sox10t3 | PMID:11684650 | ZDB-ALT-980203–1827 | |
| Genetic reagent (zebrafish, Danio rerio) | srpk3sa18907 | PMID:23594742 | ZDB-ALT-161003–10436 | |
| Genetic reagent (zebrafish, Danio rerio) | sucla2sa20646 | PMID:23594742 | ZDB-ALT-161003–11003 | |
| Genetic reagent (zebrafish, Danio rerio) | tcf7l1am881 | PMID:11057671 | ZDB-ALT-001107–2 | |
| Genetic reagent (zebrafish, Danio rerio) | tfap2asa24445 | PMID:23594742 | ZDB-ALT-131217–17748 | |
| Genetic reagent (zebrafish, Danio rerio) | tfap2csa18857 | PMID:23594742 | Allele not cryopreserved | |
| Genetic reagent (zebrafish, Danio rerio) | tfip11sa3219 | PMID:23594742 | ZDB-ALT-120727–140 | |
| Genetic reagent (zebrafish, Danio rerio) | tmod4hu3530 | PMID:23594742 | ZDB-ALT-070914–1 | |
| Genetic reagent (zebrafish, Danio rerio) | top1lsa2597 | PMID:23594742 | ZDB-ALT-161003–12704 | |
| Genetic reagent (zebrafish, Danio rerio) | ttnasa1029 | PMID:23594742 | ZDB-ALT-160721–33 | |
| Genetic reagent (zebrafish, Danio rerio) | ttnasa787 | PMID:23594742 | ZDB-ALT-120411–459 | |
| Genetic reagent (zebrafish, Danio rerio) | ttnbsa5562 | PMID:23594742 | Allele not cryopreserved | |
| Genetic reagent (zebrafish, Danio rerio) | vps16sa7027 | PMID:23594742 | ZDB-ALT-161003–18689 | |
| Genetic reagent (zebrafish, Danio rerio) | vps16sa7028 | PMID:23594742 | ZDB-ALT-161003–18690 | |
| Genetic reagent (zebrafish, Danio rerio) | vps51p9emcf | PMID:16581006 | ZDB-ALT-060602–2 | |
| Genetic reagent (zebrafish, Danio rerio) | wu:fj82b07sa24599 | PMID:23594742 | ZDB-ALT-161003–20235 | |
| Genetic reagent (zebrafish, Danio rerio) | yap1sa25458 | PMID:23594742 | ZDB-ALT-200207–2 | |
| Genetic reagent (zebrafish, Danio rerio) | zgc:171,763sa22031 | PMID:23594742 | ZDB-ALT-161003–11320 | |
| Software, algorithm | HISAT2 | PMID:31375807 | RRID:SCR_015530version 2.1.0 | https://github.com/DaehwanKimLab/hisat2 |
| Software, algorithm | featureCounts | PMID:24227677 | ||
| Software, algorithm | DESeq2 | PMID:25516281 | ||
| Software, algorithm | BCFTools | PMID:33590861 | RRID:SCR_002105version 1.4 | https://samtools.github.io/bcftools/bcftools.html |
| Software, algorithm | statsmodels | http://conference.scipy.org/proceedings/scipy2010/pdfs/seabold.pdf | https://www.statsmodels.org/stable/index.html | |
| Software, algorithm | DeTCT | PMID:26238335 | ||
| Software, algorithm | BWA | https://arxiv.org/abs/1303.3997 | ||
| Software, algorithm | biobambam | https://gitlab.com/german.tischler/biobambam2 | ||
| Software, algorithm | mpileup | PMID:21903627 | ||
| Software, algorithm | QCALL | PMID:20980557 | ||
| Software, algorithm | GATK | PMID:21478889 | ||
| Software, algorithm | Tophat | PMID:23618408 | ||
| Software, algorithm | QoRTs | PMID:26187896 |
Additional files
-
Supplementary file 1
Linkage disequilibrium (LD) mapping plots for the remaining eight lines.
- https://cdn.elifesciences.org/articles/72825/elife-72825-supp1-v2.pdf
-
Supplementary file 2
Chromosome enrichment results.
Binomial test results for each chromosome in each experiment.
- https://cdn.elifesciences.org/articles/72825/elife-72825-supp2-v2.xlsx
-
Supplementary file 3
Differentially expressed genes on chromosome 9 from seven experiments that show an enrichment of differentially expressed genes on chromosome 9.
- https://cdn.elifesciences.org/articles/72825/elife-72825-supp3-v2.xlsx
-
Supplementary file 4
Summary of differential expression numbers by genomic region in wild-type SAT RNA-sequencing (RNA-seq).
- https://cdn.elifesciences.org/articles/72825/elife-72825-supp4-v2.xlsx
-
Supplementary file 5
Summary information of DeTCT experiments.
- https://cdn.elifesciences.org/articles/72825/elife-72825-supp5-v2.xlsx
-
Transparent reporting form
- https://cdn.elifesciences.org/articles/72825/elife-72825-transrepform1-v2.docx
Download links
A two-part list of links to download the article, or parts of the article, in various formats.
Downloads (link to download the article as PDF)
Open citations (links to open the citations from this article in various online reference manager services)
Cite this article (links to download the citations from this article in formats compatible with various reference manager tools)
Allele-specific gene expression can underlie altered transcript abundance in zebrafish mutants
eLife 11:e72825.
https://doi.org/10.7554/eLife.72825


