Hyperphosphatemia increases inflammation to exacerbate anemia and skeletal muscle wasting independently of FGF23-FGFR4 signaling
- Division of Nephrology and Hypertension, Department of Medicine, The University of Alabama at Birmingham, United States
- Department of Medicine, David Geffen School of Medicine at UCLA, United States
- Division of Nephrology, Program in Membrane Biology, Massachusetts General Hospital, Harvard Medical School, United States
- Department of Pediatrics, David Geffen School of Medicine at UCLA, United States
Figures
Figure 1 with 1 supplement

FGF23-FGFR4 signaling does not contribute to functional iron deficiency in adenine-induced CKD.
Blood urea nitrogen (BUN), serum creatinine (A), serum FGF23 and serum phosphate (Pi) levels (B). Quantitative polymerase chain reaction (qPCR) analysis of Il1b, Il6, Saa1 (C, D) and Hamp (E) expression levels in liver tissue. (F) Complete blood count (CBC) analysis. (G) Representative gross pathology of Perls’ Prussian blue-stained spleen sections (scale bar, 50 μm). Larger magnification is shown in supplementary figure and legends. (H) Liver Pi levels. All values are mean ± standard error of the mean (SEM; n = 8–9 mice/group; *p ≤ 0.05 vs. Fgfr4+/+ + control diet, #p ≤ 0.05 vs. Fgfr4−/− + control diet, $p ≤ 0.05 vs. Fgfr4+/+ + adenine diet) where statistical analyses were calculated by two-way analysis of variance (ANOVA) followed by Tukey’s multiple comparison post hoc test. Dotted lines indicate median Fgfr4+/+ + control diet measurements.
Figure 1—figure supplement 1
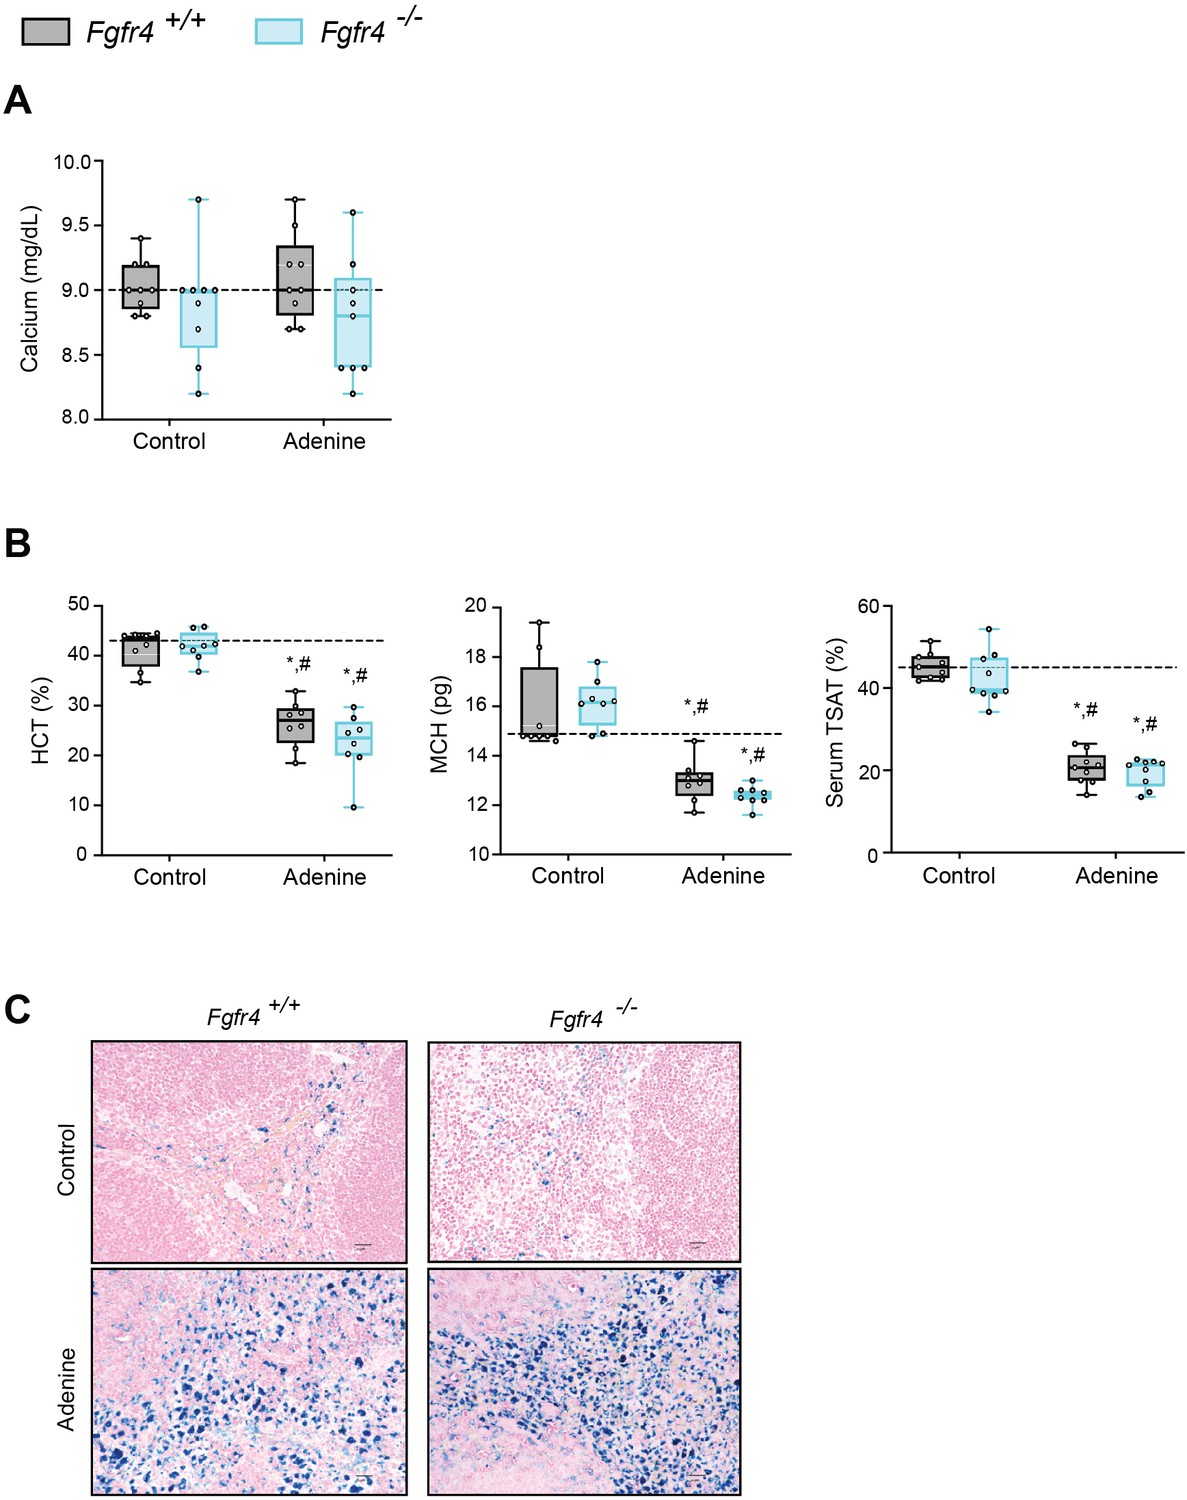
FGF23-FGFR4 signaling does not contribute to functional iron deficiency in adenine-induced CKD.
(A) Serum calcium analysis from Fgfr4+/+ and Fgfr4−/− mice, fed either control or adenine diet. (B) Hematocrit percentage (HCT%), mean corpuscular hematocrit (MCH), and serum transferrin saturation percentage (TSAT%) analysis in Fgfr4+/+ and Fgfr4−/− mice, fed either control or adenine diet. (C) Representative gross pathology of Perls’ Prussian blue-stained spleen sections (original magnification, ×40; scale bar, 20 μm). All values are mean ± standard error of the mean (SEM; n = 8–9 mice/group; *p ≤ 0.05 vs. Fgfr4+/+ + control diet, #p ≤ 0.05 vs. Fgfr4−/− + control diet) where statistical analyses were calculated by two-way analysis of variance (ANOVA) followed by Tukey’s multiple comparison post hoc test. Dotted lines indicate corresponding median measurements from Fgfr4+/+ mice on control diet.
Figure 2 with 2 supplements
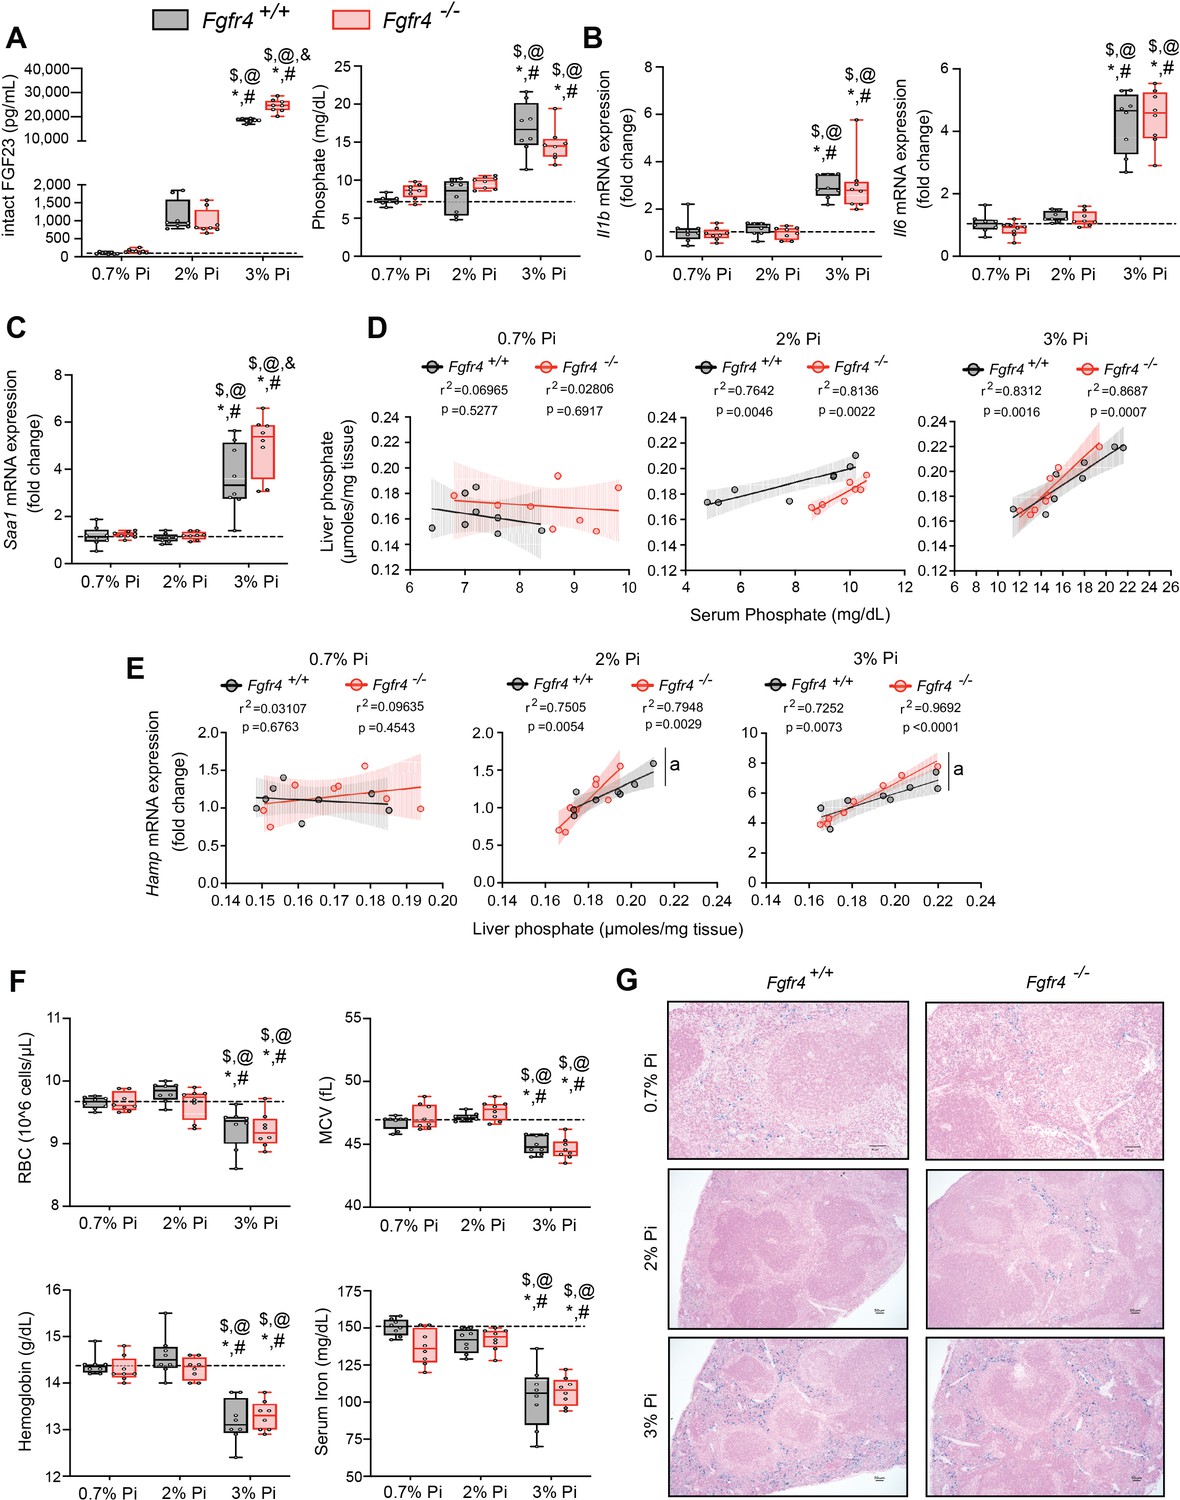
FGF23-FGFR4 signaling does not contribute to hypoferremia following dietary Pi overload.
(A) Serum FGF23 and serum Pi levels. (B, C) Quantitative polymerase chain reaction (qPCR) analysis of Il1b, Il6, and Saa1 expression levels in liver tissue. (D) Scatter plots showing correlations between liver Pi and serum Pi levels. (E) Scatter plots showing correlations between liver Hamp expression and liver Pi levels (a = slopes are significantly different from each other). (F) CBC analysis. (G) Representative gross pathology of Perls’ Prussian blue-stained spleen sections (scale bar, 50 μm). Larger magnification is shown in supplementary figure and legends. All values are mean ± standard error of the mean (SEM; n = 8 mice/group; *p ≤ 0.05 vs. Fgfr4+/+ + 0.7% Pi diet, #p ≤ 0.05 vs. Fgfr4−/− + 0.7% Pi diet, $p ≤ 0.05 vs. Fgfr4+/+ + 2% Pi diet, @p ≤ 0.05 vs. Fgfr4−/− + 2% Pi diet, &p ≤ 0.05 vs. Fgfr4+/+ + 3% Pi diet) where statistical analyses were calculated by two-way analysis of variance (ANOVA) followed by Tukey’s multiple comparison post hoc test. Dotted lines indicate median Fgfr4+/+ + 0.7% Pi diet measurements. Scatter plot shadows indicate 95% confidence interval.
Figure 2—figure supplement 1
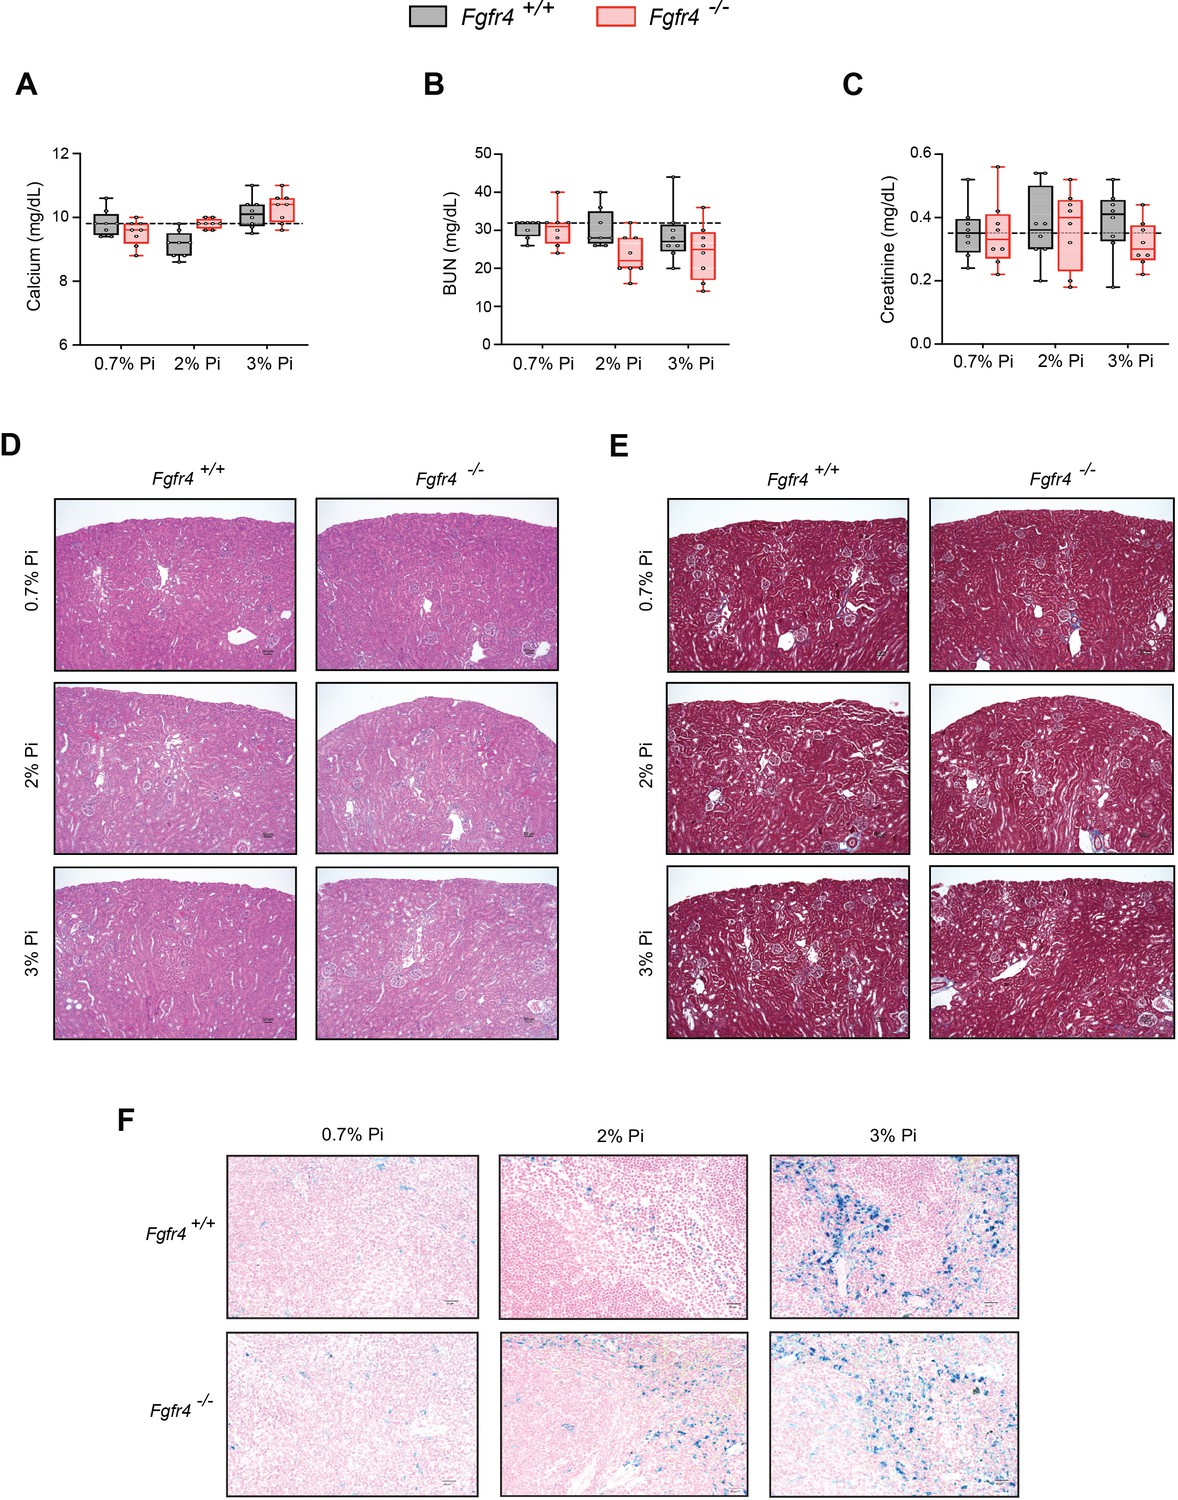
FGF23-FGFR4 signaling does not contribute to hypoferremia following dietary Pi overload.
(A) Serum calcium analysis from Fgfr4+/+ and Fgfr4−/− mice, fed either a 0.7% Pi diet or an escalating Pi diet (2% Pi diet or 3% Pi diet). (B, C) BUN and serum creatinine analysis from Fgfr4+/+ and Fgfr4−/− mice, fed either a 0.7% Pi diet or an escalating Pi diet (2% Pi diet or 3% Pi diet). (D) Representative gross pathology of H&E-stained kidney sections (original magnification, ×20; scale bar, 50 μm) from Fgfr4+/+ and Fgfr4−/− mice, fed either a 0.7% Pi diet or an escalating Pi diet (2% Pi diet or 3% Pi diet). No pathologic changes were detected in sections stained with H&E, as Fgfr4+/+ and Fgfr4−/− mice on a 2% Pi or 3% Pi diet display similar results to Fgfr4+/+ mice fed a 0.7% Pi diet. (E) Representative gross pathology of Masson’s trichrome-stained kidney sections (original magnification, ×20; scale bar, 50 μm) from Fgfr4+/+ and Fgfr4−/− mice, fed either a 0.7% Pi diet or an escalating Pi diet (2% Pi diet or 3% Pi diet). No interstitial fibrosis was detected in sections stained with Masson’s trichrome, as Fgfr4+/+ and Fgfr4−/− mice on a 2% Pi or 3% Pi diet display similar results to Fgfr4+/+ mice fed a 0.7% Pi diet. (F) Representative gross pathology of Perls’ Prussian blue-stained spleen sections (original magnification, ×40; scale bar, 20 μm). All values are mean ± standard error of the mean (SEM; n = 8 mice/group). Dotted lines indicate corresponding median measurements from Fgfr4+/+ mice on 0.7% Pi diet.
Figure 2—figure supplement 2
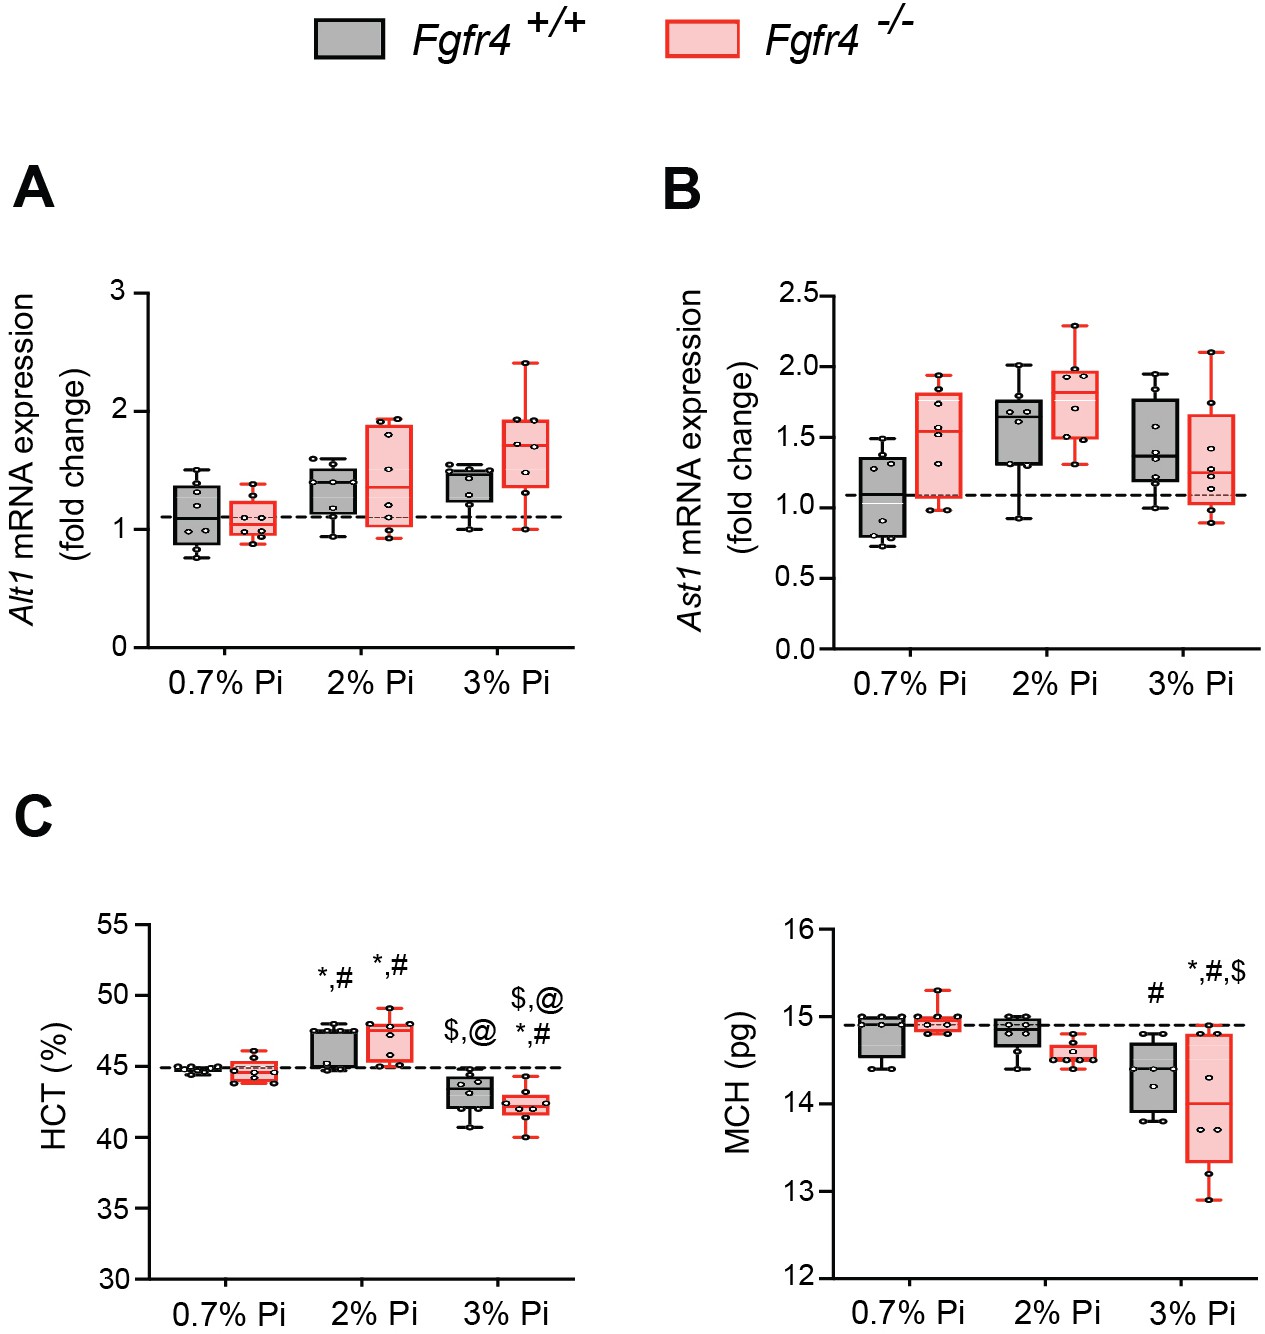
Liver injury marker and hematological analyses in Fgfr4+/+ and Fgfr4−/− mice fed a graded Pi diet.
(A, B) Quantitative polymerase chain reaction (qPCR) analysis of liver tissue shows expression levels of alanine aminotransferase (Alt1) and aspartate aminotransferase (Ast1) are not significantly elevated in Fgfr4+/+ and Fgfr4−/− mice, fed either a 2% Pi diet or 3% Pi diet, when compared to Fgfr4+/+ mice on a 0.7% Pi diet. (C) Hematocrit percentage (HCT%) and mean corpuscular hematocrit (MCH) analysis in Fgfr4+/+ and Fgfr4−/− mice, fed either a 0.7% Pi diet or an escalating Pi diet (2% Pi diet or 3% Pi diet). All values are mean ± standard error of the mean (SEM; n = 8 mice/group; *p ≤ 0.05 vs. Fgfr4+/+ + 0.7% Pi diet, #p ≤ 0.05 vs. Fgfr4−/− + 0.7% Pi diet, #p ≤ 0.05 vs. Fgfr4+/+ + 2% Pi diet, @p ≤ 0.05 vs. Fgfr4−/− + 2% Pi diet) where statistical analyses were calculated by two-way analysis of variance (ANOVA) followed by Tukey’s multiple comparison post hoc test. Dotted lines indicate corresponding median measurements from Fgfr4+/+ mice on 0.7% Pi diet.
Figure 3 with 1 supplement
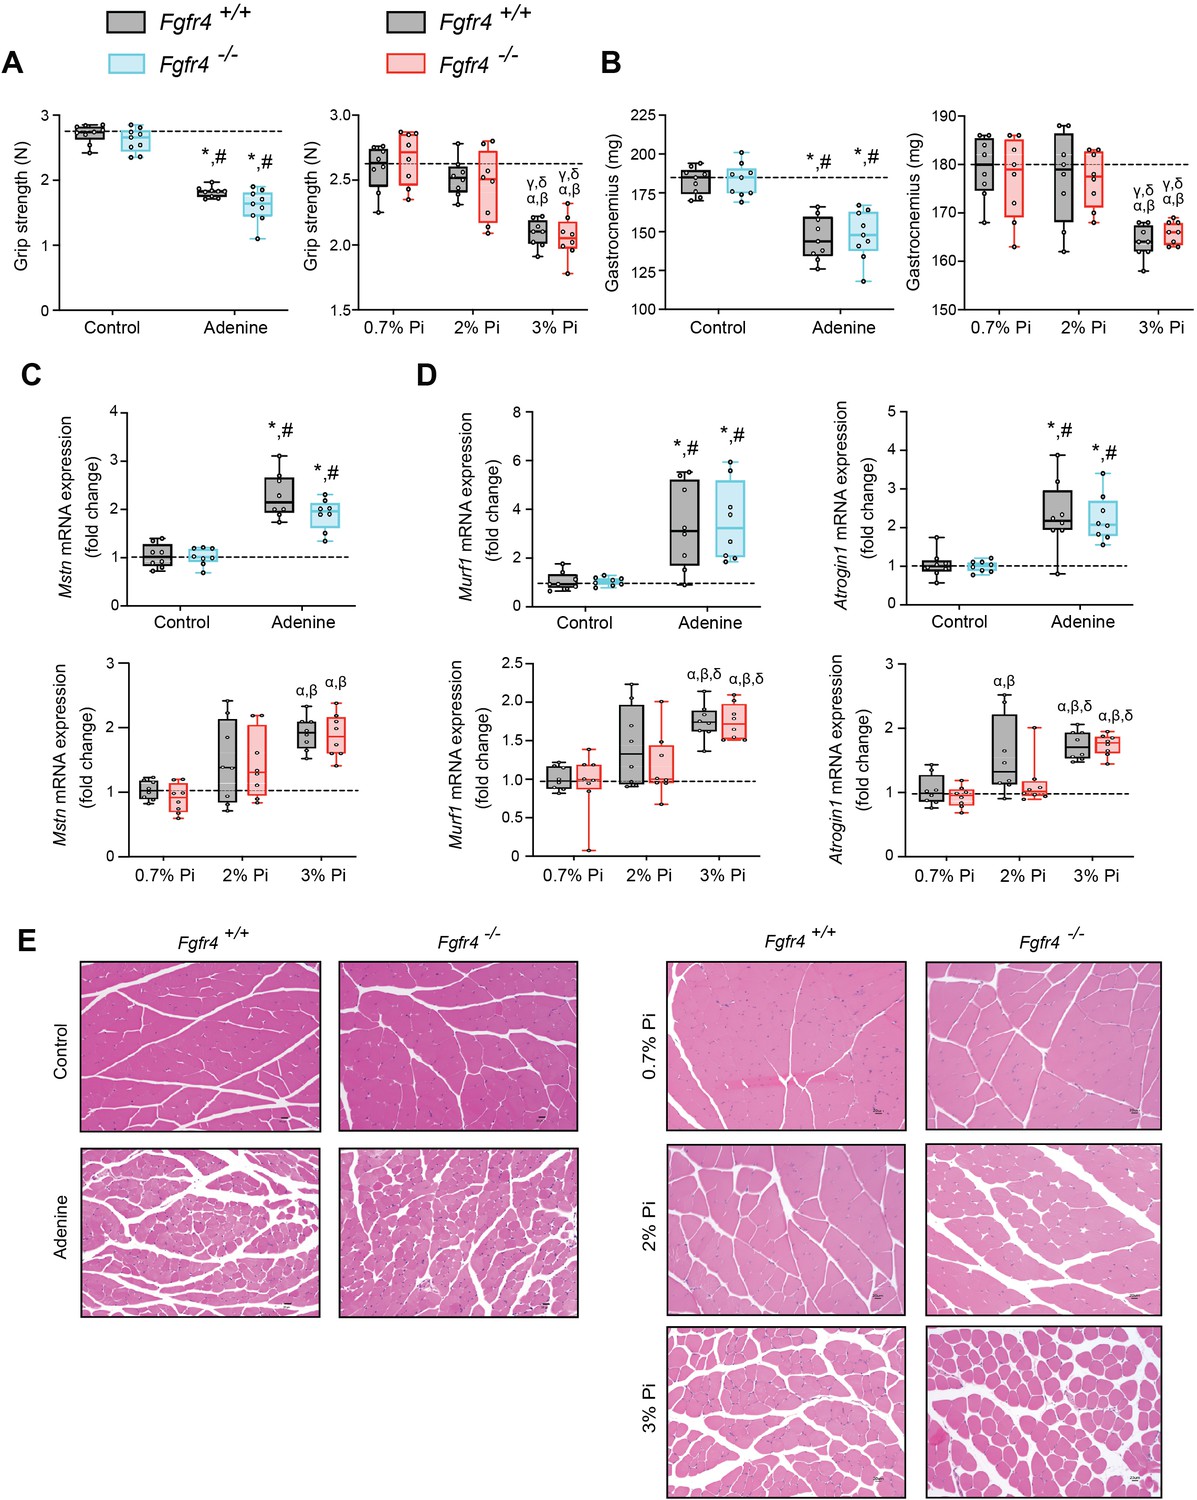
Mouse models of hyperphosphatemia exhibit signs of skeletal muscle wasting which are independent of FGF23-FGFR4 signaling.
(A) Grip strength. (B) Gastrocnemius weight. Quantitative polymerase chain reaction (qPCR) analysis of Mstn (C), Murf1 and Atrogin1 (D) expression levels in gastrocnemius tissue. (E) Representative gross pathology of H&E-stained gastrocnemius sections (scale bar, 20 μm). All values are mean ± standard error of the mean (SEM) ((n = 8–9 mice/group; *p ≤ 0.05 vs. Fgfr4+/+ + control diet, #p ≤ 0.05 vs. Fgfr4−/− + control diet); (n = 8 mice/group; αp ≤ 0.05 vs. Fgfr4+/+ + 0.7% Pi diet, βp ≤ 0.05 vs. Fgfr4−/− + 0.7% Pi diet, γp ≤ 0.05 vs. Fgfr4+/+ + 2% Pi diet, δp ≤ 0.05 vs. Fgfr4−/− + 2% Pi diet)) where statistical analyses were calculated by two-way analysis of variance (ANOVA) followed by Tukey’s multiple comparison post hoc test. Dotted lines indicate median Fgfr4+/+ + control diet or Fgfr4+/+ + 0.7% Pi diet measurements.
Figure 3—figure supplement 1
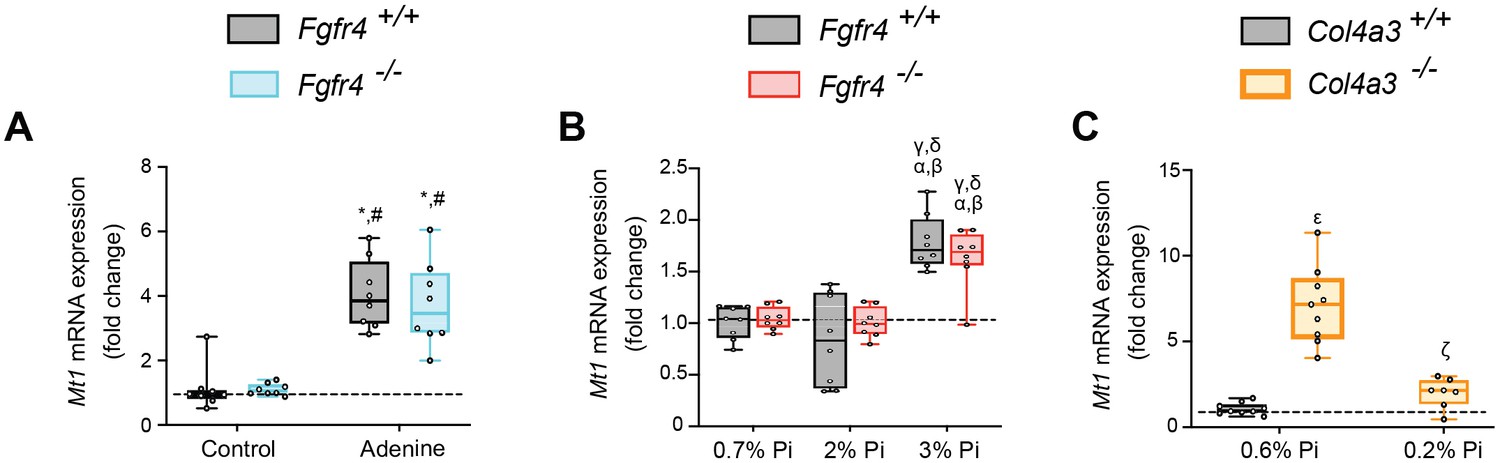
Models of hyperphosphatemia exhibit signs of skeletal muscle wasting and low Pi feeding in Col4a3−/− (Alport syndrome) mice counteracts muscle dysfunction.
(A–C) Quantitative (qPCR) analysis of gastrocnemius tissue shows expression levels of metallothionein-1 (Mt1) are significantly elevated in Fgfr4+/+ and Fgfr4−/− mice fed either adenine (A) or a 3% Pi diet (B). Alport (Col4a3−/−) mice on control diet (0.6% Pi diet) display elevated expression levels of Mt1 in gastrocnemius tissue, when compared to wild-type (Col4a3+/+) on a 0.6% Pi diet (C). A low Pi diet (0.2% Pi) in Alport mice reduces Mt1 expression levels (C). All values are mean ± standard error of the mean (SEM) ((n = 8–9 mice/group; *p ≤ 0.05 vs. Fgfr4+/+ + control diet, #p ≤ 0.05 vs. Fgfr4−/− + control diet); (n = 8 mice/group; αp ≤ 0.05 vs. Fgfr4+/+ + 0.7% Pi diet, βp ≤ 0.05 vs. Fgfr4−/− + 0.7% Pi diet, γp ≤ 0.05 vs. Fgfr4+/+ + 2% Pi diet, δp ≤ 0.05 vs. Fgfr4−/− + 2% Pi diet); (n = 7–9 mice/group; εp ≤ 0.05 vs. Col4a3+/+ + 0.6% Pi diet, ςp ≤ 0.05 vs. Col4a3−/− + 0.6% Pi diet)) where statistical analyses were calculated by two-way analysis of variance (ANOVA) followed by Tukey’s multiple comparison post hoc test. Dotted lines indicate corresponding median measurements from Fgfr4+/+ mice on control diet (A), Fgfr4+/+ mice on 0.7% Pi diet (B), or Col4a3+/+ mice on 0.6% Pi diet (C).
Figure 4 with 1 supplement
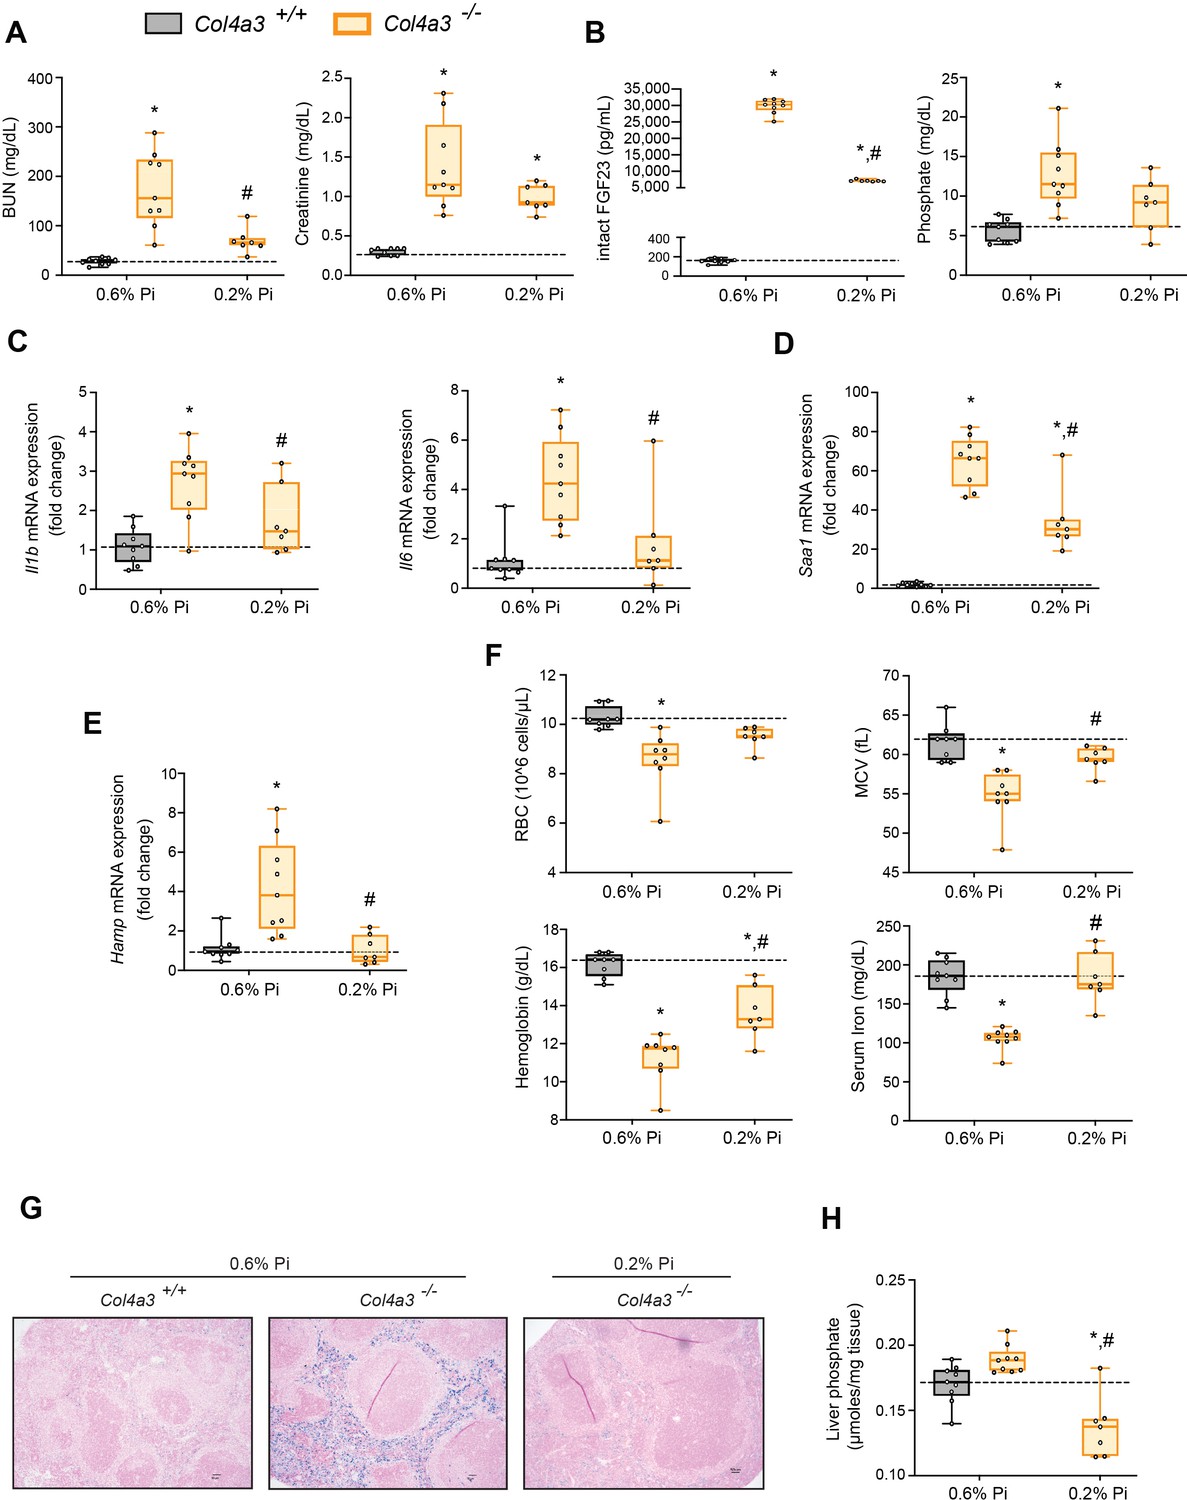
Low Pi feeding limits functional iron deficiency in Col4a3−/− (Alport ) mice.
BUN, serum creatinine (A), serum FGF23 and serum Pi levels (B). Quantitative polymerase chain reaction (qPCR) analysis of Il1b, Il6, and Saa1 (C, D) and Hamp (E) expression levels in liver tissue. (F) CBC analysis. (G) Representative gross pathology of Perls’ Prussian blue-stained spleen sections (scale bar, 50 μm). Larger magnification is shown in supplementary figure and legends. (H) Liver Pi levels. All values are mean ± standard error of the mean (SEM; n = 7–9 mice/group; *p ≤ 0.05 vs. Col4a3+/+ + 0.6% Pi diet, #p ≤ 0.05 vs. Col4a3−/− + 0.6% Pi diet) where statistical analyses were calculated by two-way analysis of variance (ANOVA) followed by Tukey’s multiple comparison post hoc test. Dotted lines indicate median Col4a3+/+ + 0.6% Pi diet measurements.
Figure 4—figure supplement 1
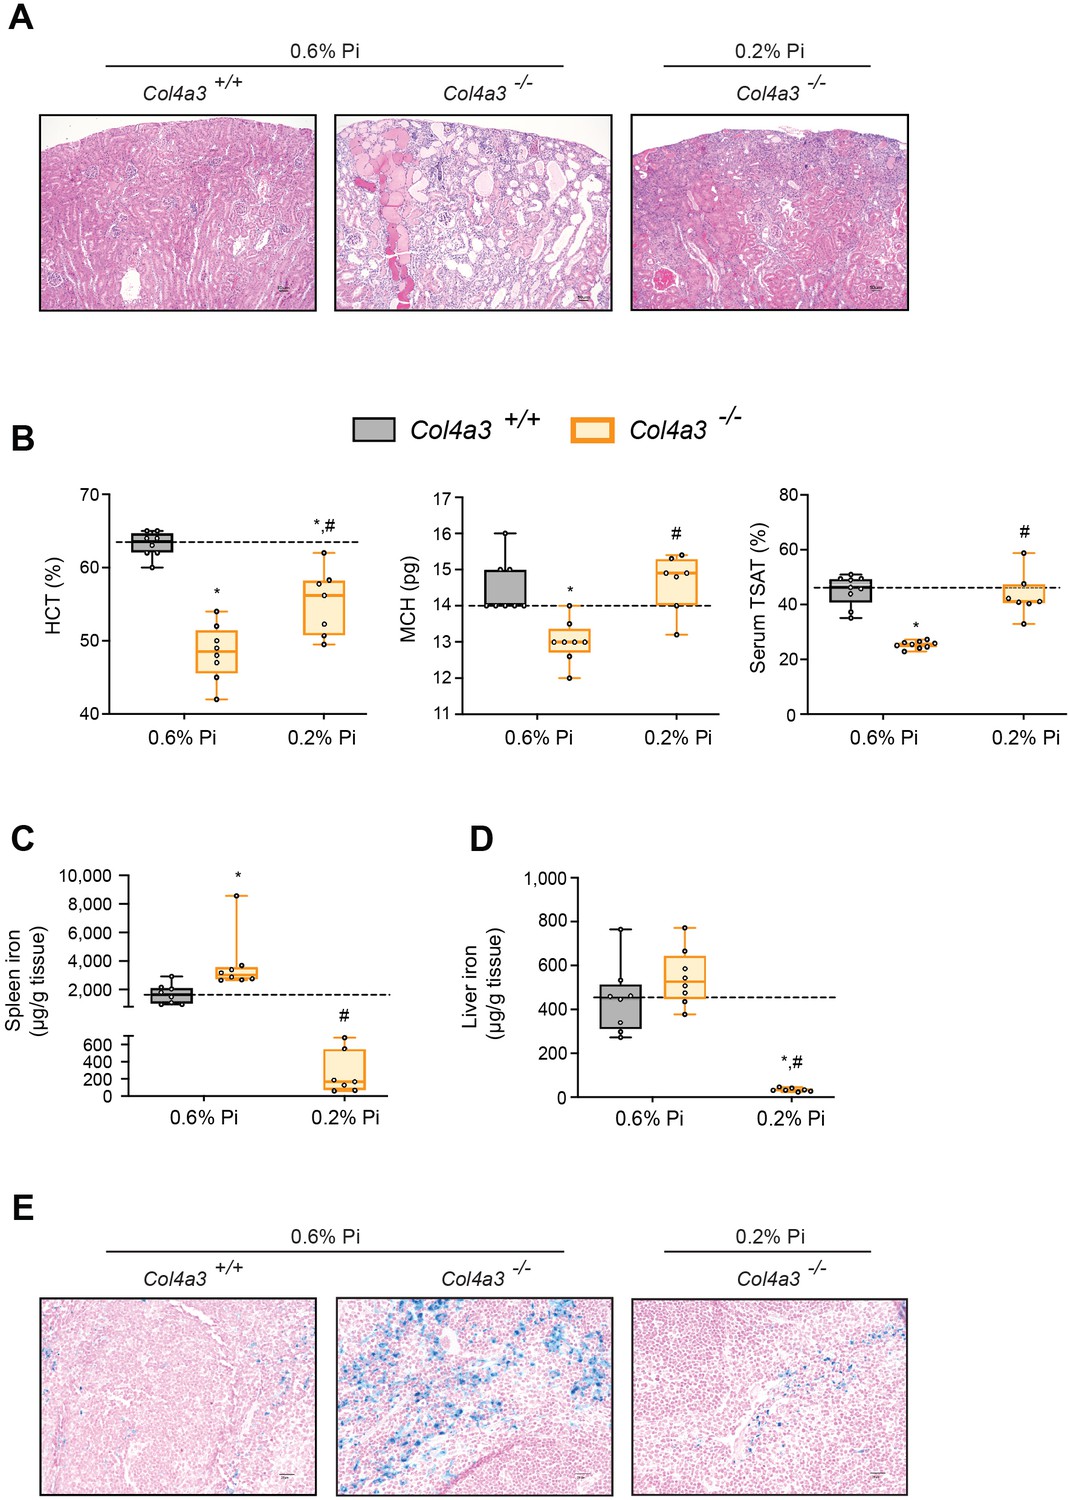
Low Pi feeding limits functional iron deficiency in Col4a3−/− (Alport ) mice.
(A) Representative gross pathology of H&E-stained kidney sections (original magnification, ×20; scale bar, 50 μm) from wild-type (Col4a3+/+) and Alport (Col4a3−/−) mice, fed either control diet (0.6% Pi) or a low Pi diet (0.2% Pi). Pathologic changes were detected in sections stained with H&E from Alport mice fed a 0.6% Pi diet. A 0.2% Pi diet moderately improves this feature in Alport mice. (B) Hematocrit percentage (HCT%), mean corpuscular hematocrit (MCH), and serum transferrin saturation percentage (TSAT%) analysis in wild-type (Col4a3+/+) and Alport (Col4a3−/−) mice, fed either control diet (0.6% Pi) or a low Pi diet (0.2% Pi). (C) Spleen nonheme iron concentrations in wild-type (Col4a3+/+) and Alport (Col4a3−/−) mice, fed either control diet (0.6% Pi) or a low Pi diet (0.2% Pi). (D) Liver nonheme iron concentrations in wild-type (Col4a3+/+) and Alport (Col4a3−/−) mice, fed either control diet (0.6% Pi) or a low Pi diet (0.2% Pi). (E) Representative gross pathology of Perls’ Prussian blue-stained spleen sections (original magnification, ×40; scale bar, 20 μm). All values are mean ± standard error of the mean (SEM; n = 7–9 mice/group; *p ≤ 0.05 vs. Col4a3+/+ + 0.6% Pi diet, #p ≤ 0.05 vs. Col4a3−/− + 0.6% Pi diet) where statistical analyses were calculated by two-way analysis of variance (ANOVA) followed by Tukey’s multiple comparison post hoc test. Dotted lines indicate corresponding median measurements from Col4a3+/+ mice on 0.6% Pi diet.
Figure 5
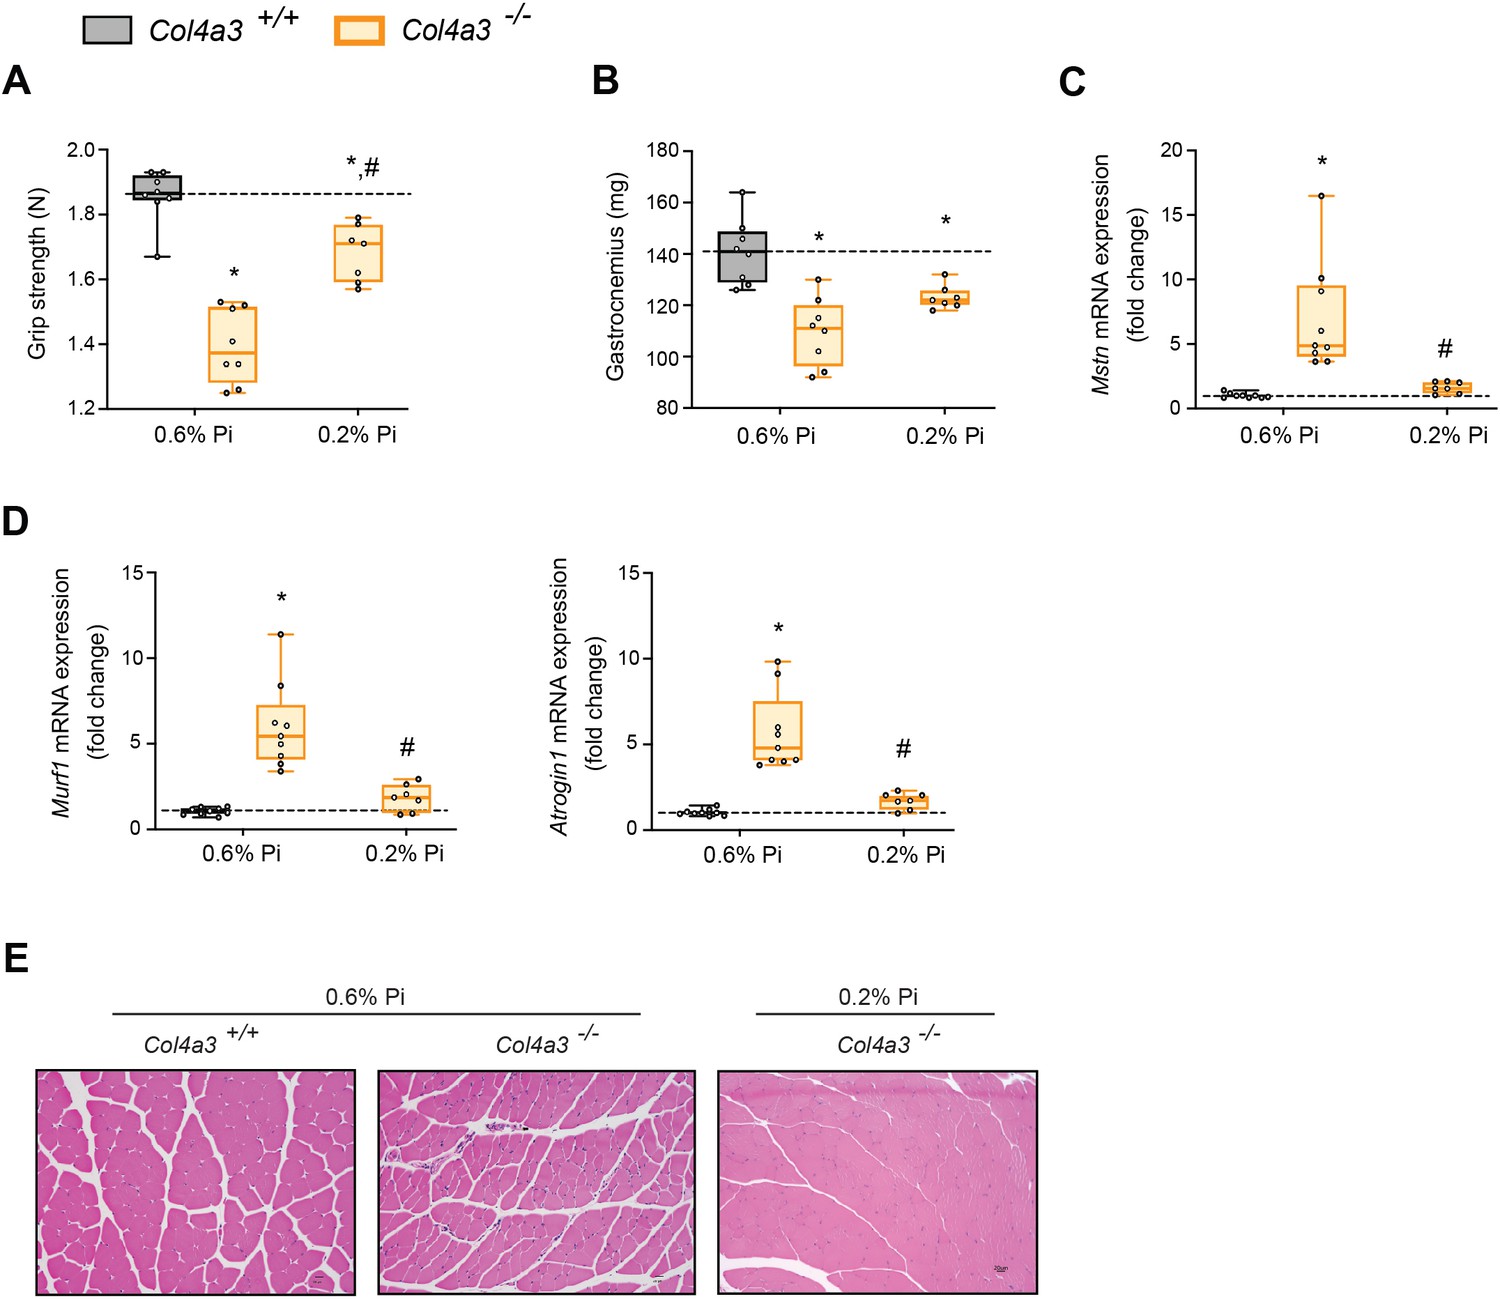
Low Pi feeding counteracts signs of skeletal muscle wasting in Col4a3−/− (Alport ) mice.
(A) Grip strength. (B) Gastrocnemius weight. Quantitative polymerase chain reaction (qPCR) analysis of Mstn (C), Murf1 and Atrogin1 (D) expression levels in gastrocnemius tissue. (E) Representative gross pathology of H&E-stained gastrocnemius sections (scale bar, 20 μm). All values are mean ± standard error of the mean (SEM; n = 7–9 mice/group; *p ≤ 0.05 vs. Col4a3+/+ + 0.6% Pi diet, #p ≤ 0.05 vs. Col4a3−/− + 0.6% Pi diet) where statistical analyses were calculated by two-way analysis of variance (ANOVA) followed by Tukey’s multiple comparison post hoc test. Dotted lines indicate median Col4a3+/+ + 0.6% Pi diet measurements.
Figure 6 with 1 supplement
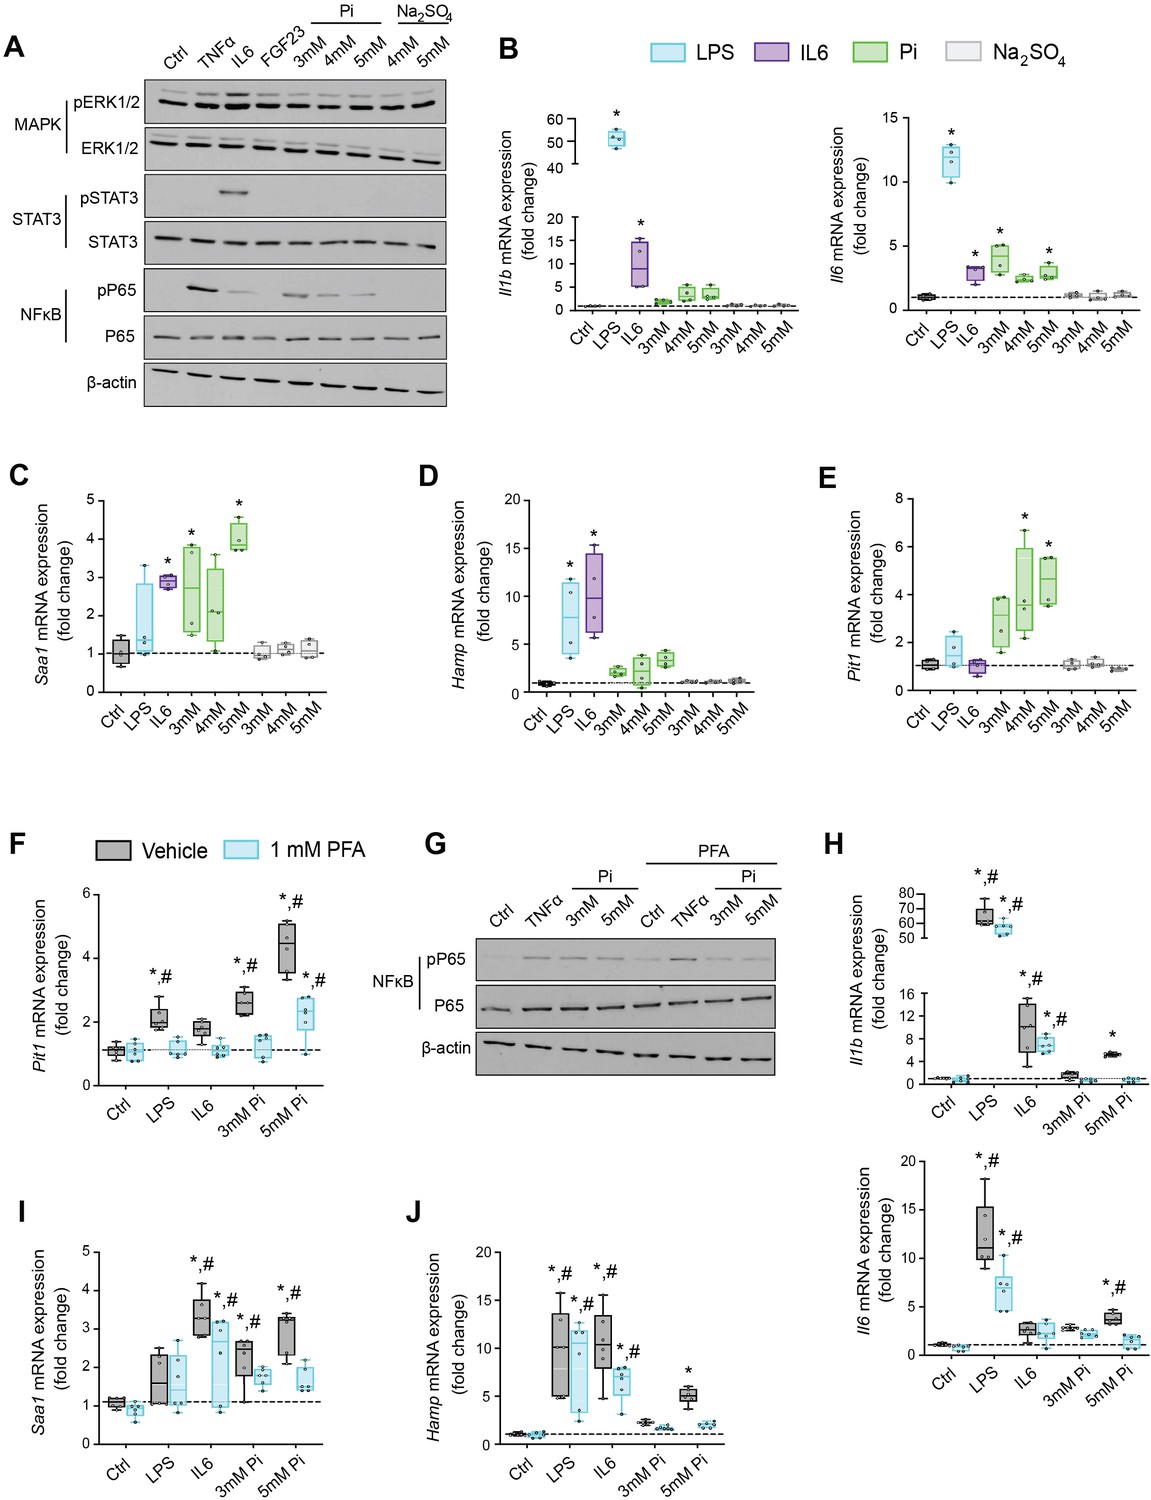
Pi targets hepatocytes and increases expression of inflammatory cytokines and hepcidin.
(A) Immunoblot analysis of total protein extracts from primary hepatocytes (n = 5 independent isolations). β-Actin serves as loading control. Quantitative polymerase chain reaction (qPCR) analysis of Il1b, Il6, Saa1 (B, C), Hamp (D), and Slc20a1 (E) expression levels in primary hepatocytes; values are mean ± standard error of the mean (SEM; n = 4 independent isolations; *p ≤ 0.05 vs. control [Ctrl]). Dotted lines indicate median Ctrl measurements. (F) qPCR analysis of Slc20a1 expression levels in primary hepatocytes following stimuli, with or without phosphonoformic acid (PFA); values are mean ± standard error of the mean (SEM; n = 6 independent isolations; *p ≤ 0.05 vs. vehicle control [Ctrl], #p ≤ 0.05 vs. 1 mM PFA Ctrl). Dotted lines indicate median vehicle Ctrl measurements. (G) Immunoblot analysis of total and phosphorylated p65 (NFκB) protein levels from primary hepatocytes following stimuli, with or without PFA (n = 5 independent isolations). β-Actin serves as loading control. (H–J) qPCR analysis of Il1b, Il6, Saa1 (H–I) and Hamp (J) expression levels in primary hepatocytes following stimuli, with or without PFA; values are mean ± standard error of the mean (SEM; n = 6 independent isolations; *p ≤ 0.05 vs. vehicle control [Ctrl], #p ≤ 0.05 vs. 1 mM PFA Ctrl) where statistical analyses were calculated by one-way analysis of variance (ANOVA; B–E) or by two-way ANOVA (F, H–J) followed by Tukey’s multiple comparison post hoc test. Dotted lines indicate median vehicle Ctrl measurements.
-
Figure 6—source data 1
Original western blots.
Original uncropped western blots of the cropped western blots shown in Figure 6A, G. The molecular weight is indicated on the right in kDa.
- https://cdn.elifesciences.org/articles/74782/elife-74782-fig6-data1-v2.zip
Figure 6—figure supplement 1
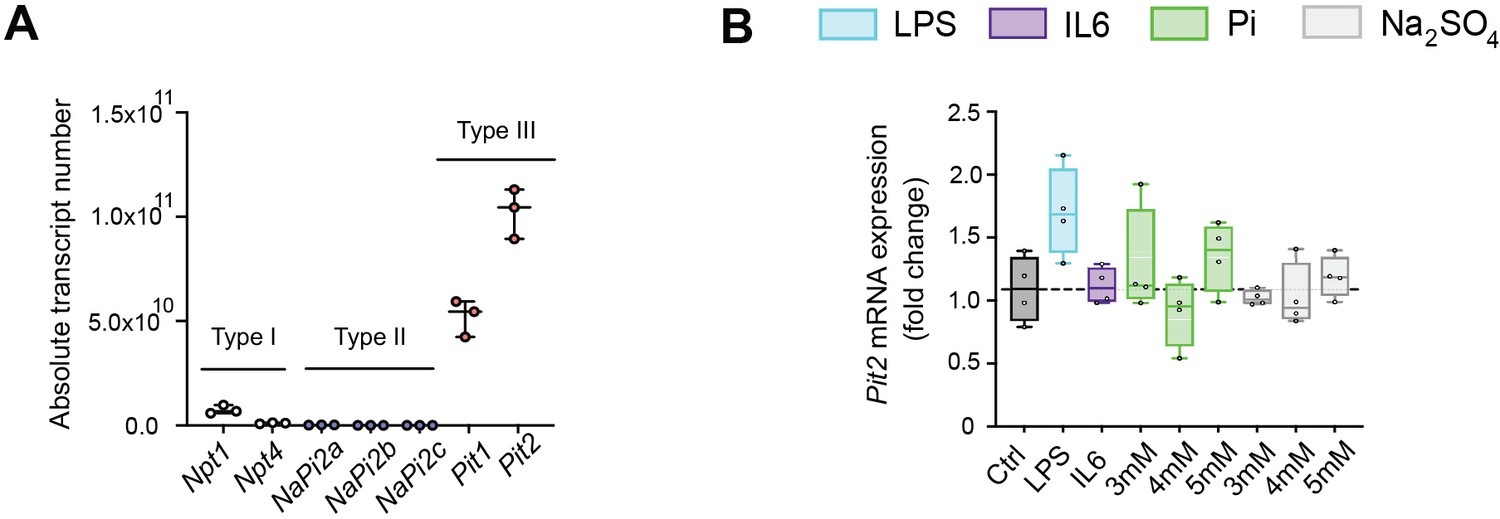
Pi targets hepatocytes and increases expression of inflammatory cytokines and hepcidin.
(A) Quantitative polymerase chain reaction (qPCR) analysis of isolated primary hepatocytes shows absolute transcript expression of all three families of sodium phosphate cotransporters (types I, II, and III). This analysis indicates type III sodium phosphate cotransporters (Slc20a1 and Slc20a2) have the highest expression levels in mouse primary hepatocyte cultures (n = 3 independent isolations). (B) qPCR analysis of primary hepatocytes shows Slc20a2 expression levels following inflammatory, dose-dependent Pi or dose-dependent Na2SO4 treatment. No significant elevations were detected following treatments, when compared to control (Ctrl); values are mean ± standard error of the mean (SEM; n = 4 independent isolations). Dotted lines indicate corresponding median measurements from Ctrl.
Figure 7 with 1 supplement
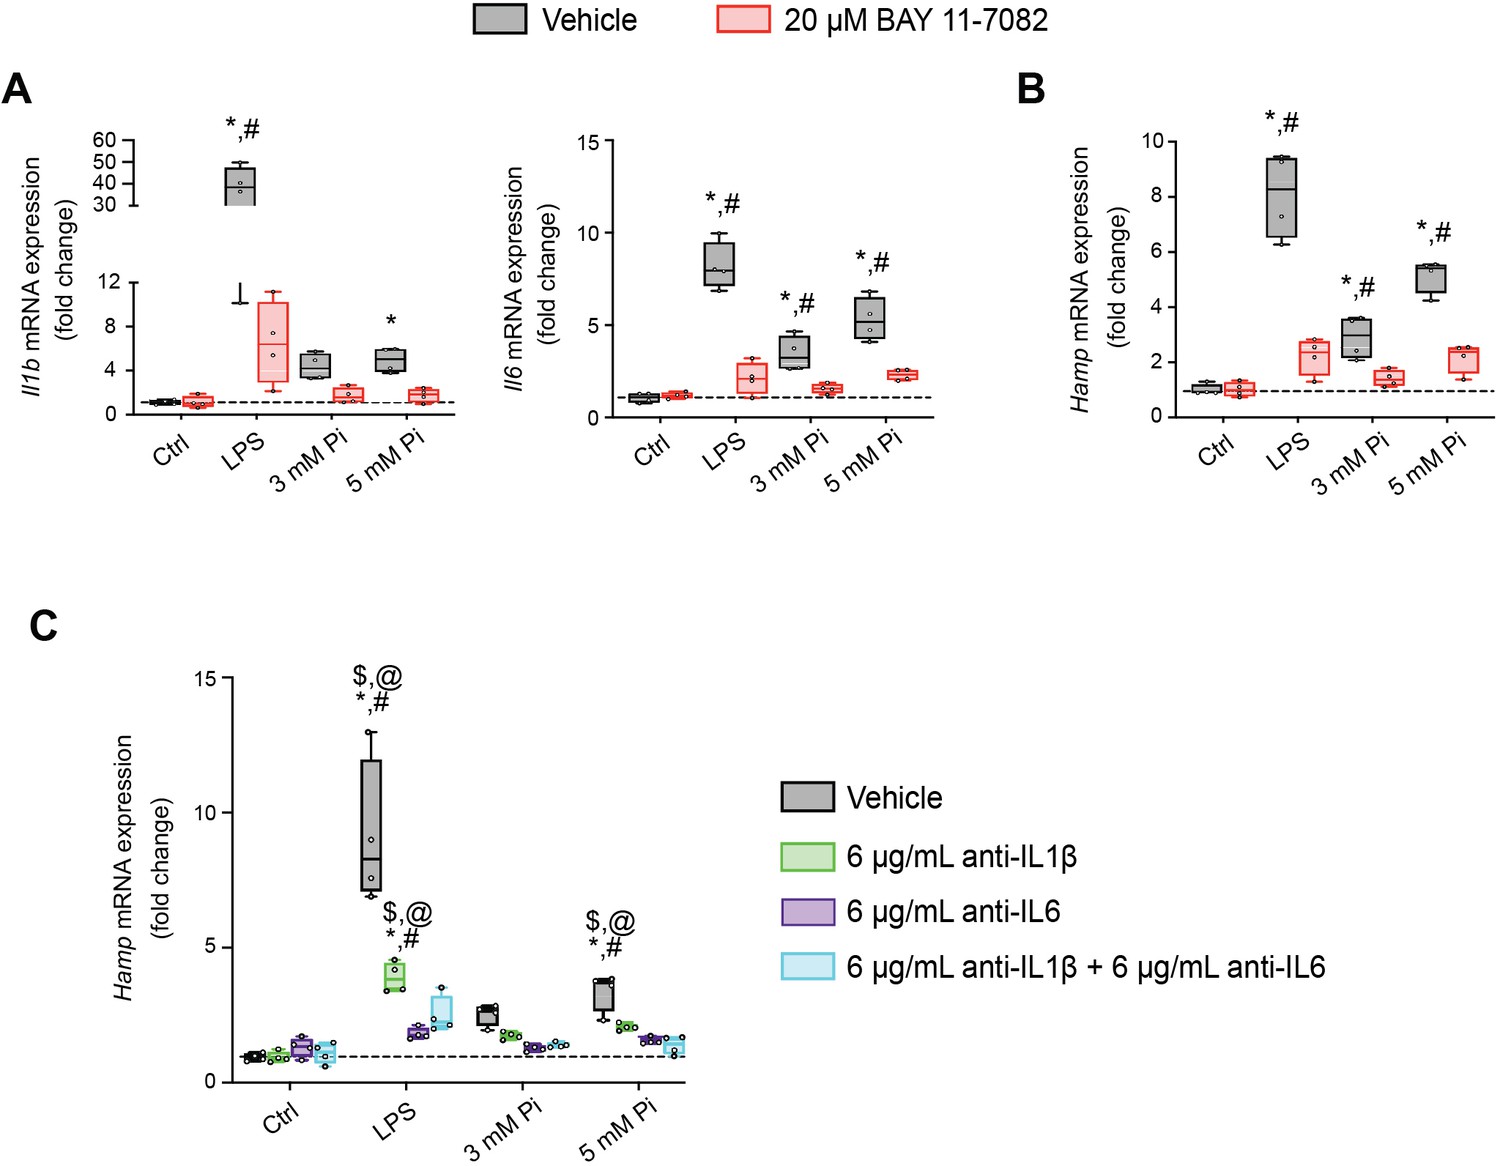
Pi induces hepcidin expression via paracrine IL1β and IL6 signaling.
Quantitative polymerase chain reaction (qPCR) analysis of Il1b, Il6 (A) and Hamp (B) expression levels in primary hepatocytes following stimuli, with or without BAY 11-7082; values are mean ± standard error of the mean (SEM; n = 4 independent isolations; *p ≤ 0.05 vs. vehicle control [Ctrl], #p ≤ 0.05 vs. 20 μM BAY 11-7082 Ctrl). Dotted lines indicate median vehicle Ctrl measurements. (C) qPCR analysis of Hamp expression levels in primary hepatocytes following stimuli with or without anti-IL1β, anti-IL6, or both antibodies in combination; values are mean ± standard error of the mean (SEM; n = 4 independent isolations; *p ≤ 0.05 vs. vehicle control [Ctrl], #p ≤ 0.05 vs. anti-IL1β Ctrl, $p ≤ 0.05 vs. anti-IL6 Ctrl, @p ≤ 0.05 vs. anti-IL1β + anti-IL6 Ctrl) where statistical analyses were calculated by two-way analysis of variance (ANOVA) followed by Tukey’s multiple comparison post hoc test. Dotted lines indicate median vehicle Ctrl measurements.
Figure 7—figure supplement 1

Pi induces hepcidin expression via paracrine IL1β and IL6 signaling.
Quantitative polymerase chain reaction (qPCR) analysis of primary hepatocytes shows expression levels of Saa1 (A), Hp (B), and Slc20a1 (C) following lipopolysaccharide (LPS) or Pi stimulation, with or without BAY 11-7082; values are mean ± standard error of the mean (SEM; n = 4 independent isolations; *p ≤ 0.05 vs. vehicle control [Ctrl], #p ≤ 0.05 vs 20 μM BAY 11-7082 Ctrl). Dotted lines indicate corresponding median measurements from vehicle Ctrl. (D, E) qPCR analysis of primary hepatocytes shows Saa1 and Hp expression levels following LPS or Pi stimulation, with or without anti-IL1β, anti-IL6, or both antibodies in combination; values are mean ± standard error of the mean (SEM; n = 4 independent isolations; *p ≤ 0.05 vs. vehicle control [Ctrl], #p ≤ 0.05 vs. anti-IL1β Ctrl, $p ≤ 0.05 vs. anti-IL6 Ctrl, @p ≤ 0.05 vs. anti-IL1β + anti-IL6 Ctrl) where statistical analyses were calculated by two-way analysis of variance (ANOVA) followed by Tukey’s multiple comparison post hoc test. Dotted lines indicate corresponding median measurements from vehicle Ctrl.
Figure 8
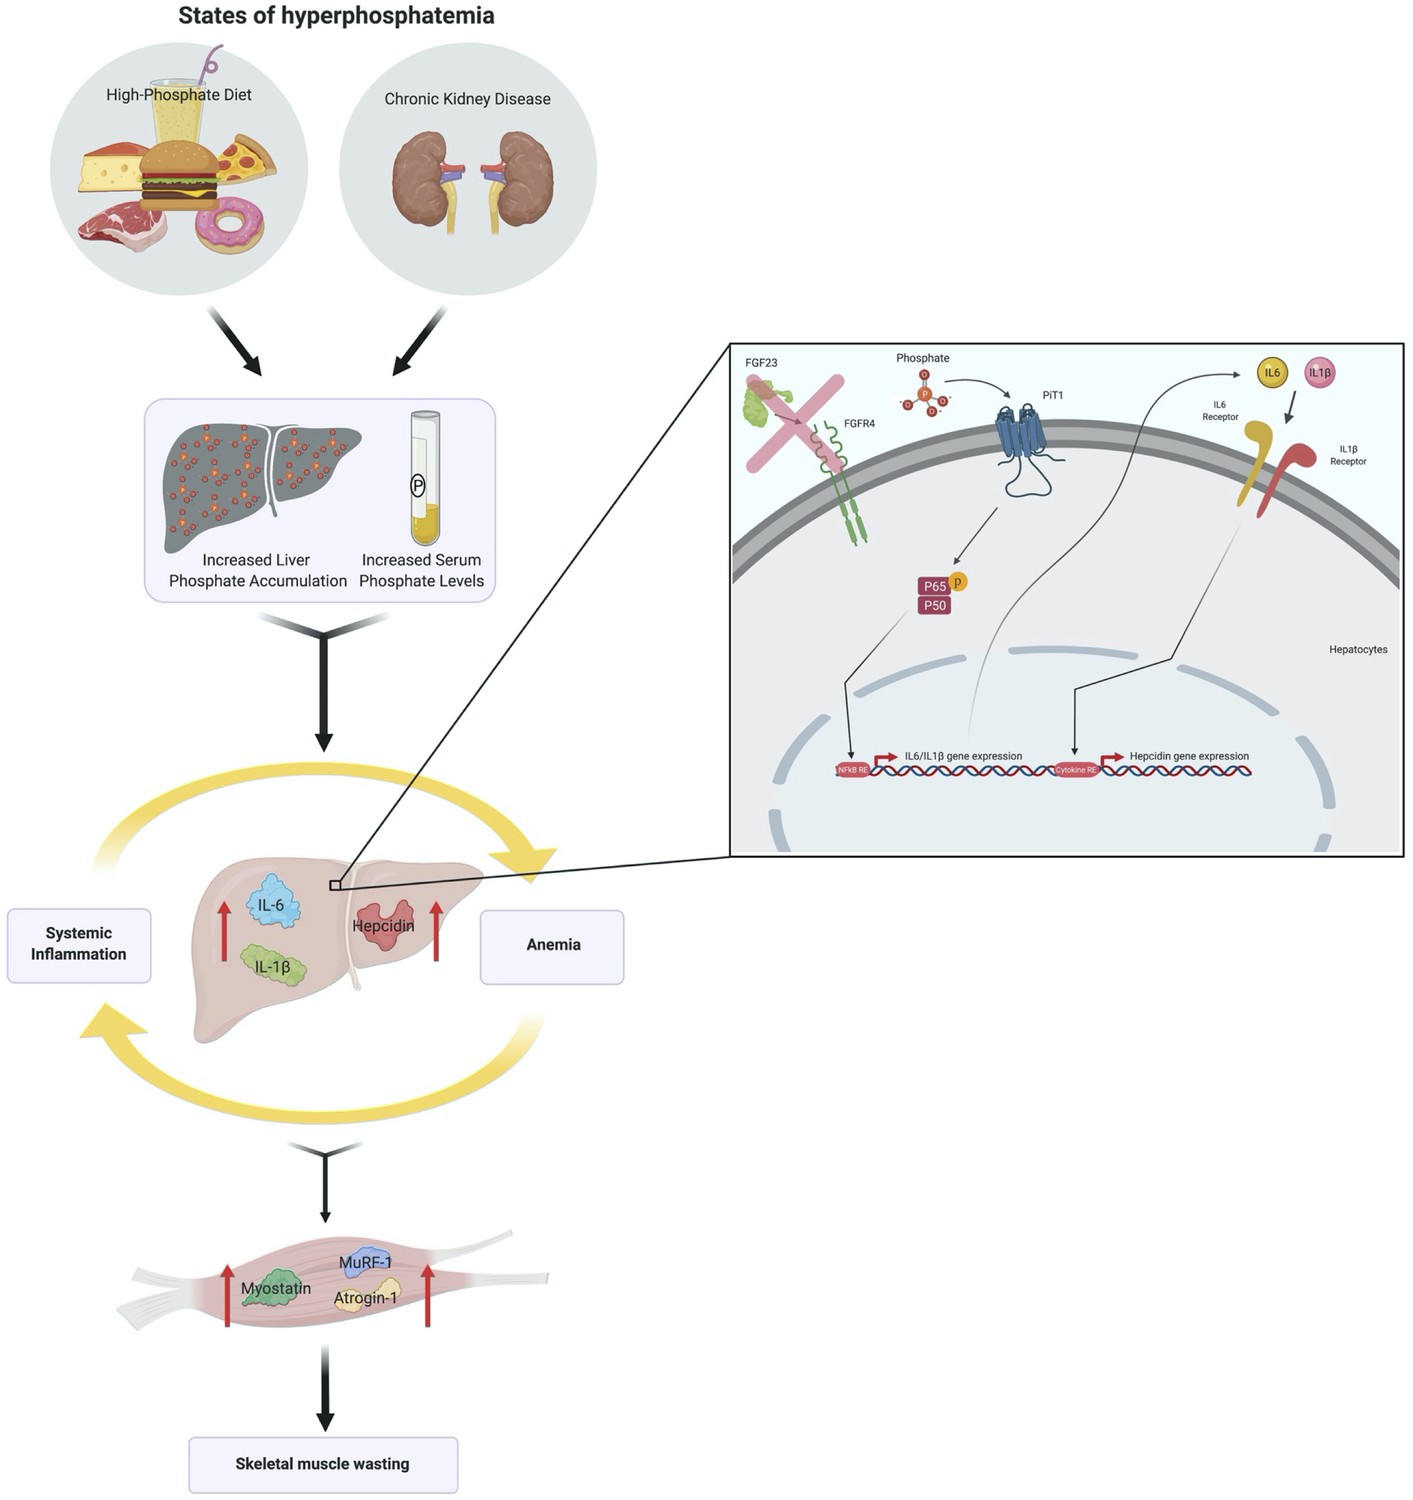
Schematic of the effects of hyperphosphatemia on systemic inflammation, hypoferremia, and skeletal muscle wasting.
Tables
Table 1
Macroscopic parameters of Fgfr4+/+ and Fgfr4−/− mice receiving control and adenine diet.
| Fgfr4+/+ + control diet | Fgfr4−/− + control diet | Fgfr4+/+ + adenine diet | Fgfr4−/− + adenine diet | |
|---|---|---|---|---|
| Body weight (g) | 30.1 ± 0.9 | 30.2 ± 0.3 | 16.8*# ± 0.5 | 17.5*# ± 0.4 |
| Liver weight (g) | 1.14 ± 0.05 | 1.22 ± 0.08 | 0.74*# ± 0.03 | 0.78*# ± 0.05 |
| Spleen weight (mg) | 75.0 ± 2.2 | 76.0 ± 1.7 | 53.3*# ± 3.3 | 56.0*# ± 3.2 |
| Left kidney weight (mg) | 181.8 ± 8.5 | 173.2 ± 8.3 | 122.2*# ± 4.9 | 101.8*# ± 7.2 |
| Right kidney weight (mg) | 184.7 ± 10.7 | 175.2 ± 8.2 | 124.2*# ± 4.1 | 102.8*# ± 7.7 |
-
Values are expressed as mean ± standard error of the mean (SEM). Comparison between groups was performed in form of a two-way analysis of variance (ANOVA) followed by a post hoc Tukey test. A level of p < 0.05 was accepted as statistically significant; N = 9/group; *p ≤ 0.05 vs. Fgfr4+/+ + control diet, #p ≤ 0.05 vs. Fgfr4−/− + control diet.
Table 2
Macroscopic parameters of Fgfr4+/+ and Fgfr4−/− mice receiving a graded dietary Pi load.
| Fgfr4+/+ + 0.7% Pi diet | Fgfr4−/− + 0.7% Pi diet | Fgfr4+/+ + 2% Pi diet | Fgfr4−/− + 2% Pi diet | Fgfr4+/+ + 3% Pi diet | Fgfr4−/− + 3% Pi diet | |
|---|---|---|---|---|---|---|
| Body weight (g) | 32.0 ± 1.0 | 31.9 ± 1.0 | 30.3 ± 0.9 | 31.6 ± 0.9 | 29.5 ± 0.3 | 29.5 ± 0.4 |
| Liver weight (g) | 1.17 ± 0.04 | 1.15 ± 0.05 | 1.24 ± 0.03 | 1.20 ± 0.05 | 1.23 ± 0.5 | 1.19 ± 0.4 |
| Spleen weight (mg) | 76.3 ± 2.4 | 68.3 ± 1.7 | 77.0 ± 2.8 | 76.6 ± 2.8 | 76.6 ± 2.1 | 74.0 ± 1.7 |
| Left kidney weight (mg) | 146.5 ± 4.7 | 143.6 ± 4.5 | 156.0 ± 2.9 | 152.6 ± 3.4 | 153.4 ± 4.1 | 152.9 ± 3.7 |
| Right kidney weight (mg) | 149.0 ± 3.8 | 151.5 ± 3.7 | 152.9 ± 3.2 | 145.6 ± 3.5 | 152.5 ± 2.5 | 149.6 ± 3.9 |
-
Values are expressed as mean ± standard error of the mean (SEM). Comparison between groups was performed in form of a two-way analysis of variance (ANOVA) followed by a post hoc Tukey test. No level of statistical significance was accepted between groups; N = 8/group.
Table 3
Macroscopic parameters of Alport mice receiving either a 0.6% Pi diet or 0.2% Pi diet.
| Col4a3+/+ + 0.6% Pi diet | Col4a3−/− + 0.6% Pi diet | Col4a3−/− + 0.2% Pi diet | |
|---|---|---|---|
| Body weight (g) | 26.3 ± 0.6 | 16.3* ± 0.6 | 22.2*# ± 0.6 |
| Liver weight (g) | 1.03 ± 0.04 | 0.68* ± 0.03 | 0.90# ± 0.03 |
| Spleen weight (mg) | 72.2 ± 2.3 | 56.6* ± 2.4 | 65.9 ± 2.1 |
| Left kidney weight (mg) | 145.3 ± 1.6 | 124.1* ± 2.6 | 130.1* ± 2.1 |
| Right kidney weight (mg) | 147.4 ± 1.6 | 123.0* ± 3.4 | 133.6* ± 3.1 |
-
Values are expressed as mean ± standard error of the mean (SEM). Comparison between groups was performed in form of a two-way analysis of variance (ANOVA) followed by a post hoc Tukey test. A level of p < 0.05 was accepted as statistically significant; N = 7–9/group; *p ≤ 0.05 vs. Col4a3+/+ + 0.6% Pi diet, #p ≤ 0.05 vs. Col4a3−/− + 0.6% Pi diet.
Key resources table
| Reagent type (species) or resource | Designation | Source or reference | Identifiers | Additional information |
|---|---|---|---|---|
| Strain, strain background (Mus musculus; 129/SvJ) | Col4a3tm1Dec | Jackson Laboratory | Stock No. 000691 | Referred to as Col4a3−/− |
| Strain, strain background (Mus musculus; C57Bl/6) | Global FGFR4 knockout | Gift from Dr. Chu-Xia Deng, NIDDK, Bethesda, USA | Weinstein et al., 1998, 125, 3615-23 | Referred to as Fgfr4−/− |
| Antibody | IL6 (rat monoclonal) | R&D Systems | MP5-20F3 | For cell culture treatment (6 μg/ml) |
| Antibody | IL1β (goat polyclonal) | R&D Systems | AF-401-NA | For cell culture treatment (6 μg/ml) |
| Antibody | ERK1/2 (rabbit monoclonal) | Cell Signaling | 4695 | For WB (1:1000) |
| Antibody | STAT3 (rabbit monoclonal) | Cell Signaling | 4904 | For WB (1:1000) |
| Antibody | NFkB (rabbit monoclonal) | Cell Signaling | 8242 | For WB (1:1000) |
| Antibody | β-Actin (rabbit monoclonal) | Cell Signaling | 4970 | For WB (1:1000) |
| Antibody | Phosphorylated ERK1/2 (rabbit polyclonal) | Cell Signaling | 9101 | For WB (1:1000) |
| Antibody | Phosphorylated STAT3 (rabbit monoclonal) | Cell Signaling | 9145 | For WB (1:1000) |
| Antibody | Phosphorylated NFκB (rabbit monoclonal) | Cell Signaling | 3033 | For WB (1:1000) |
| Antibody | Mouse IgG, HRP conjugate (goat monoclonal) | Promega | W4021 | For WB (1:2500) |
| Antibody | Rabbit IgG, HRP conjugate (goat monoclonal) | Promega | W4011 | For WB (1:2500) |
| Peptide, recombinant protein | FGF23; mouse | R&D Systems | 2629-FG | For cell culture treatment (25 ng/ml) |
| Peptide, recombinant protein | TNFα; mouse | R&D Systems | 410-MT | For cell culture treatment (100 ng/ml) |
| Peptide, recombinant protein | IL6; mouse | R&D Systems | 406 ML | For cell culture treatment (50 ng/ml) |
| Commercial assay or kit | Colorimetric Pi assay | Abcam | Ab65622 | |
| Commercial assay or kit | Colorimetric iron assay | Sekisui | 157-30 | |
| Commercial assay or kit | Intact FGF23 ELISA (mouse) | Quidel | 60-6800 | |
| Commercial assay or kit | Percoll gradient solution | Sigma-Aldrich | P1644 | |
| Commercial assay or kit | RNeasy Plus Mini kit | Qiagen | 74,136 | |
| Commercial assay or kit | RNeasy Plus Universal Mini kit | Qiagen | 73,404 | |
| Commercial assay or kit | iScript Reverse Transcriptase Supermix | BioRad | 1708840 | |
| Commercial assay or kit | SSoAdvanced Universal SYBR Green Supermix | BioRad | 172-5272 | |
| Commercial assay or kit | Pierce BCA Protein Assay | Thermo Fisher | 23,225 | |
| Chemical compound, drug | Lipopolysaccharide (LPS) from E. coli serotype 0111:B4; endotoxin agent | Invivogen | Tlrl-3pelps | For cell culture treatment (100 ng/ml) |
| Chemical compound, drug | Sodium phosphate dibasic anhydrous | Fisher | BP332-500 | |
| Chemical compound, drug | Sodium phosphate monobasic anhydrous | Fisher | BP329-1 | |
| Chemical compound, drug | Sodium Sulfate | Sigma-Aldrich | 239,313 | |
| Chemical compound, drug | Phosphonoformic acid (PFA) | Sigma-Aldrich | P6801 | |
| Chemical compound, drug | BAY 11-7082 | Selleckhem | S2913 | For cell culture treatment (20 μM) |
| Software, algorithm | GraphPad Prism | GraphPad | ||
| Other | 0.2% adenine diet | Envigo | TD.140290 | Diet for mice |
| Other | 0.15% adenine diet | Envigo | TD.170304 | Diet for mice |
| Other | Adenine control diet | Envigo | TD.170303 | Diet for mice |
| Other | 0.7% Pi diet | Envigo | TD.180287 | Diet for mice |
| Other | 2% Pi diet | Envigo | TD.08020 | Diet for mice |
| Other | 3% Pi diet | Envigo | TD.180286 | Diet for mice |
| Other | 0.6% Pi diet | Envigo | TD.200407 | Diet for mice |
| Other | 0.2% Pi diet | Envigo | TD.200406 | Diet for mice |
Table 4
Composition of control and adenine diets.
| Diet | Adenine(g/kg) | Available Pi (%) | Total Ca (%) | Protein source | Energy source | Pi source |
|---|---|---|---|---|---|---|
| TD.170303(control diet) | 0 | 0.9 | 0.6 | Casein | 20% protein66.9% carbs13.2% fat | CaseinCa Pi, dibasicNa Pi, dibasic |
| TD.170304(0.15% adenine) | 1.5 | 0.9 | 0.6 | Casein | 20% protein66.8% carbs13.2% fat | CaseinCa Pi, dibasicNa Pi, dibasic |
| TD.140290(0.2% adenine) | 2 | 0.9 | 0.6 | Casein | 20% protein66.8% carbs13.2% fat | CaseinCa Pi, dibasicNa Pi, dibasic |
-
Pi, phosphate; Ca, calcium; Na, sodium. These diets were manufactured by Envigo.
Table 5
Composition of 0.7%, 2%, and 3% phosphate (Pi) diets.
| Diet | Available Pi (%) | Total Ca (%) | Total iron (ppm) | Total K (%) | Total Na (%) | Protein source | Energy source | Pi source |
|---|---|---|---|---|---|---|---|---|
| TD.180287(0.7% Pi diet) | 0.7 | 1.9 | 280 | 2.4 | 1.2 | Crude | 33.3% protein53.9% carbs12.8% fat | Crude protein |
| TD.08020(2% Pi diet) | 2.0 | 1.9 | 280 | 1.8 | 0.9 | Crude | 33.3% protein53.9% carbs12.8% fat | Crude proteinK Pi, monobasicNa Pi, monobasic |
| TD.180286(3% Pi diet) | 3.0 | 1.9 | 280 | 2.4 | 1.2 | Crude | 33.3% protein53.9% carbs12.8% fat | Crude proteinK Pi, monobasicNa Pi, monobasic |
-
Pi, phosphate; Ca, calcium; K, potassium; Na, sodium. These diets were manufactured by Envigo.
Table 6
Composition of 0.6% and 0.2% phosphate (Pi) diets.
| Diet | Available Pi (%) | Total Ca (%) | Total iron (ppm) | Total K (%) | Total na (%) | Protein source | Energy source | Pi source |
|---|---|---|---|---|---|---|---|---|
| TD.200407(0.6% Pi diet, normal) | 0.6 | 0.6 | 40 | 0.6 | 0.38 | Egg white solids | 17.7% protein65% carbs17.3% fat | Egg white solidsCa Pi, monobasic |
| TD.200406(0.2% Pi diet) | 0.2 | 0.6 | 40 | 0.6 | 0.38 | Egg white solids | 17.5% protein65.4% carbs17.1% fat | Egg white solidsCa Pi, monobasic |
-
Pi, phosphate; Ca, calcium; K, potassium; Na, sodium. These diets were manufactured by Envigo.
Table 7
Oligonucleotides used as sequence specific primers in quantitative polymerase chain reaction (qPCR) analyses.
| Gene | Species | Orientation | Primer sequence (5′–3′) |
|---|---|---|---|
| Npt-1/Slc17a1 | Mus musculus | ForwardReverse | GGC ACC TCC CTT AGA ACG AGCAG AAC ACA CCC AAC AAT ACC AAA |
| Npt-4/Slc17a3 | Mus musculus | ForwardReverse | TGG TAC CCA TTG TTG CTG GCGGG ACA GCT TCA CAA ACG AGT |
| NaPi-2a/Slc34a1 | Mus musculus | ForwardReverse | TCA TTG TCA GCA TGG TCT CCT CCCT GCA AAA GCC CGC CTG |
| NaPi-2b/Slc34a2 | Mus musculus | ForwardReverse | CTC CTG CTG TCC CTT ACC TGTGT CAT TTG TTT TGC TGG CCT C |
| NaPi-2c/Slc34a3 | Mus musculus | ForwardReverse | GAT GCC TTT GAC CTG GTG GAGCC ATG CCA ACC TCT TTC AG |
| PiT-1/Slc20a1 | Mus musculus | ForwardReverse | TTC CTT GTT CGT GCG TTC ATCAAT TGG TAA AGC TCG TAA GCC ATT |
| PiT-2/Slc20a2 | Mus musculus | ForwardReverse | GAC CGT GGA AAC GCT AAT GGCTC AGG AAG GAC GCG ATC AA |
| Fgfr1 | Mus musculus | ForwardReverse | GCT TGA CGT CGT GGA ACG ATAGC CAC TGA ATG TGA GGC TG |
| Fgfr2 | Mus musculus | ForwardReverse | ATC CCC CTG CGG AGA CAGAG GAC AGA CGC GTT GTT ATC C |
| Fgfr3 | Mus musculus | ForwardReverse | GTG TGC GTG TAA CAG ATG CTCCGG GCG AGT CCA ATA AGG AG |
| Fgfr4 | Mus musculus | ForwardReverse | TGA AGA GTA CCT TGA CCT CCGTCA TGT CGT CTG CGA GTC AG |
| Alt1/Gpt1 | Mus musculus | ForwardReverse | GCC CTC GAG TAC TAT GCG TCTGT CTT GGT ATA CCT CAT CAG CC |
| Ast1/Got1 | Mus musculus | ForwardReverse | CTG AAT GAT CTG GAG AAT GCC CTGC AAA GCC CTG ATA GGC TG |
| Il6 | Mus musculus | ForwardReverse | CTC TGG GAA ATC GTG GAA ATCCA GTT TGG TAG CAT CCA TC |
| Il1b | Mus musculus | ForwardReverse | TGC CAC CTT TTG ACA GTG ATGTGA TGT GCT GCT GCG AGA TT |
| Saa1 | Mus musculus | ForwardReverse | ACA CCA GCA GGA TGA AGC TAC TGAG CAT GGA AGT ATT TGT CTG AGT |
| Hamp | Mus musculus | ForwardReverse | GAG CAG CAC CAC CTA TCT CCTTG GTA TCG CAA TGT CTG CC |
| Haptoglobin/Hp | Mus musculus | ForwardReverse | AGA GAG GCA AGA GAG GTC CAGGC AGC TGT CAT CTT CAA AGT |
| Atrogin1/Fbxo32 | Mus musculus | ForwardReverse | TGA GCG ACC TCA GCA GTT ACGCG CTC CTT CGT ACT TCC TT |
| Murf1/Trim63 | Mus musculus | ForwardReverse | GAG GGC CAT TGA CTT TGG GATGG TGT TCT TCT TTA CCC TCT GT |
| Mstn | Mus musculus | ForwardReverse | CTC CAG AAT AGA AGC CAT AGCA GAA GTT GTC TTA TAG C |
| Mt1 | Mus musculus | ForwardReverse | CGA CTT CAA CGT CCT GAG TACAGG AGC TGG TGC AAG TG |
| 18S rRNA/Rn18s | Mus musculus | ForwardReverse | TTG ACG GAA GGG CAC CAC CAGGCA CCA CCA CCC ACG GAA TCG |
| Gapdh | Mus musculus | ForwardReverse | CCA ATG TGT CCG TCG TGG ATC TGTT GAA GTC GCA GGA GAC AAC C |
Additional files
Download links
A two-part list of links to download the article, or parts of the article, in various formats.
Downloads (link to download the article as PDF)
Open citations (links to open the citations from this article in various online reference manager services)
Cite this article (links to download the citations from this article in formats compatible with various reference manager tools)
Hyperphosphatemia increases inflammation to exacerbate anemia and skeletal muscle wasting independently of FGF23-FGFR4 signaling
eLife 11:e74782.
https://doi.org/10.7554/eLife.74782


