Short senolytic or senostatic interventions rescue progression of radiation-induced frailty and premature ageing in mice
- Newcastle University Biosciences Institute, Newcastle University, Newcastle upon Tyne, United Kingdom
Figures
Figure 1 with 8 supplements
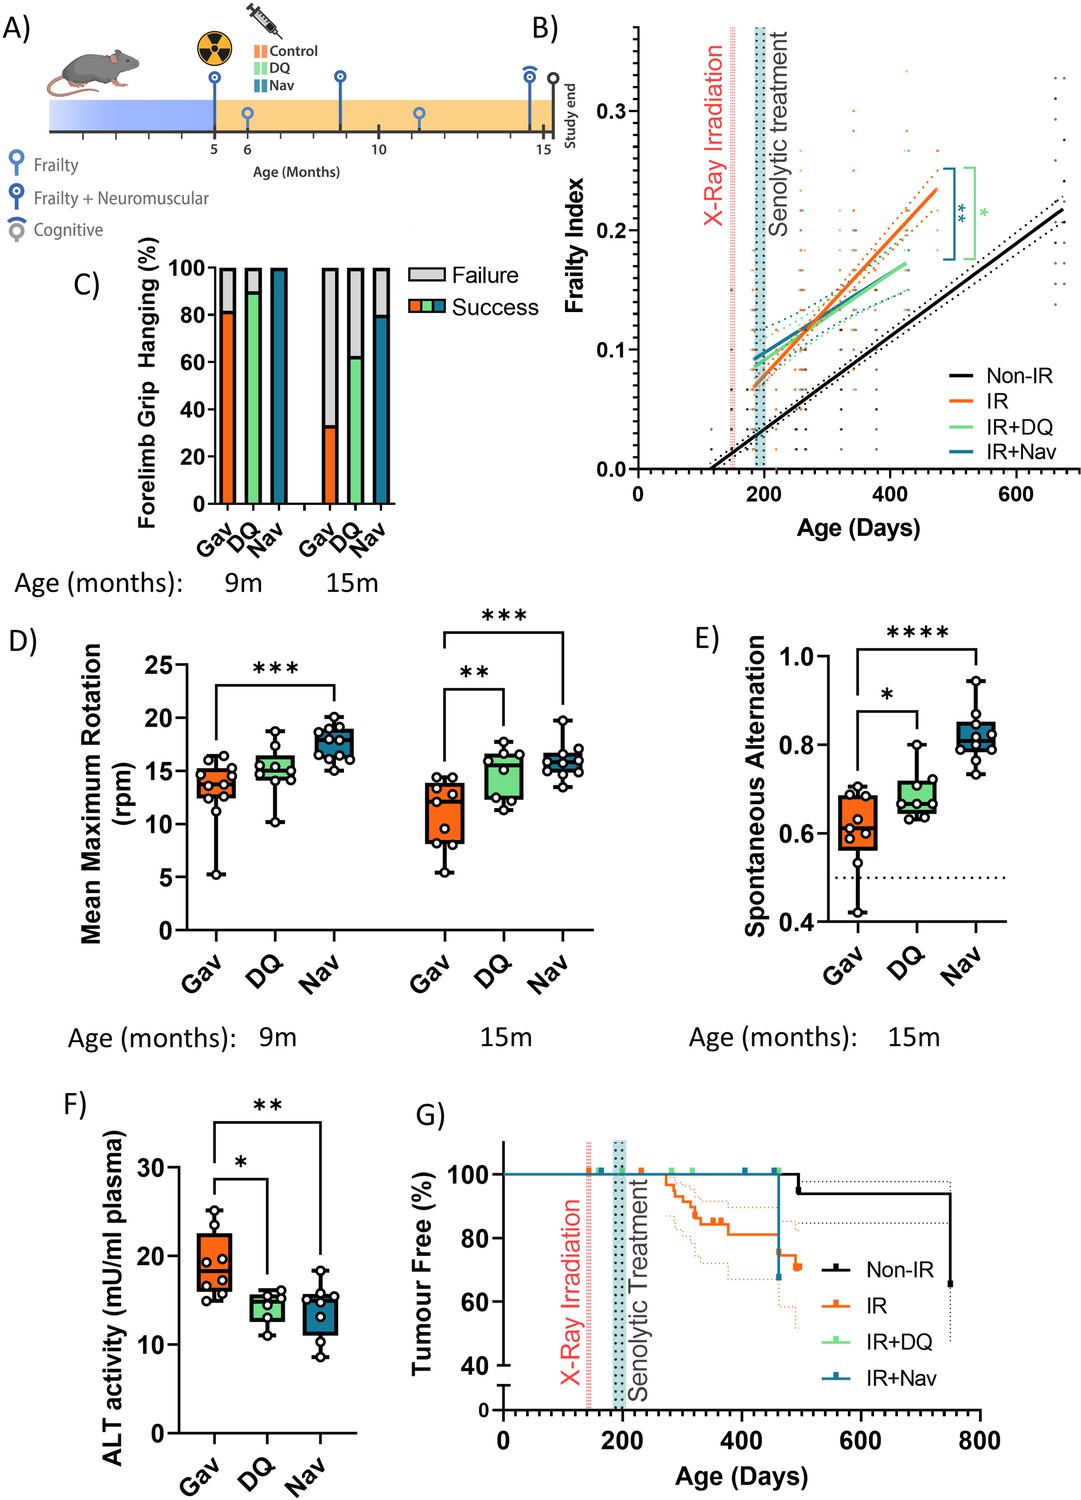
Short-term senolytic interventions rescue irradiation-induced accelerated ageing.
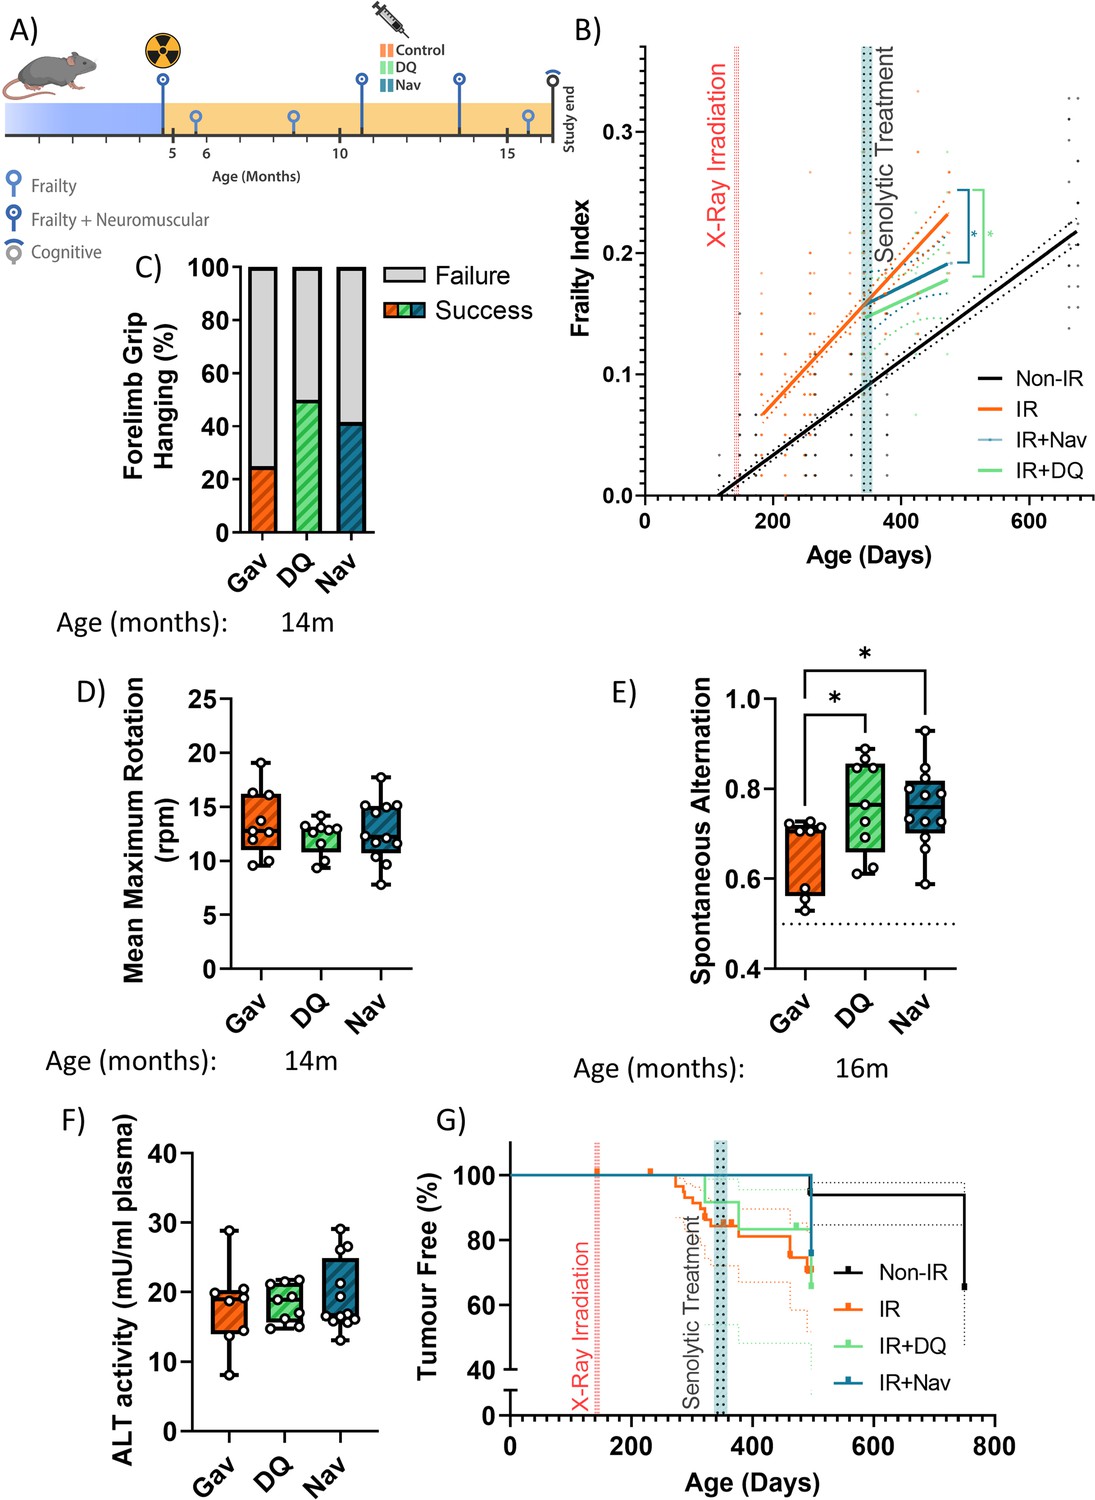
(A) Layout of the experiment. (B) Frailty index (FI) vs mouse age for non-irradiated (Non-IR, black), irradiated (IR, red), and irradiated plus treated with either D+Q (green) or Navitoclax (blue) mice. Irradiation and treatment times are indicated by vertical lines. Dots indicate FI for individual mice, regression lines and 95% confidence intervals are indicated by bold and dotted lines, respectively. Individual frailty scores are enlarged for clarity in Figure 1—figure supplement 1. (C) Wire hanging test results (% success) under the indicated treatments and ages. (D) Maximum speed achieved on rotarod under the indicated treatments and ages. (E) Short-term memory assessed as spontaneous alternation in a Y maze under the indicated treatments. (F) Alanine transaminase (ALT) activity in plasma at 16 months. (G) Tumour prevalence at death. Data are from 12 mice per group at start with attrition to 8–10 mice over the course of the experiment.
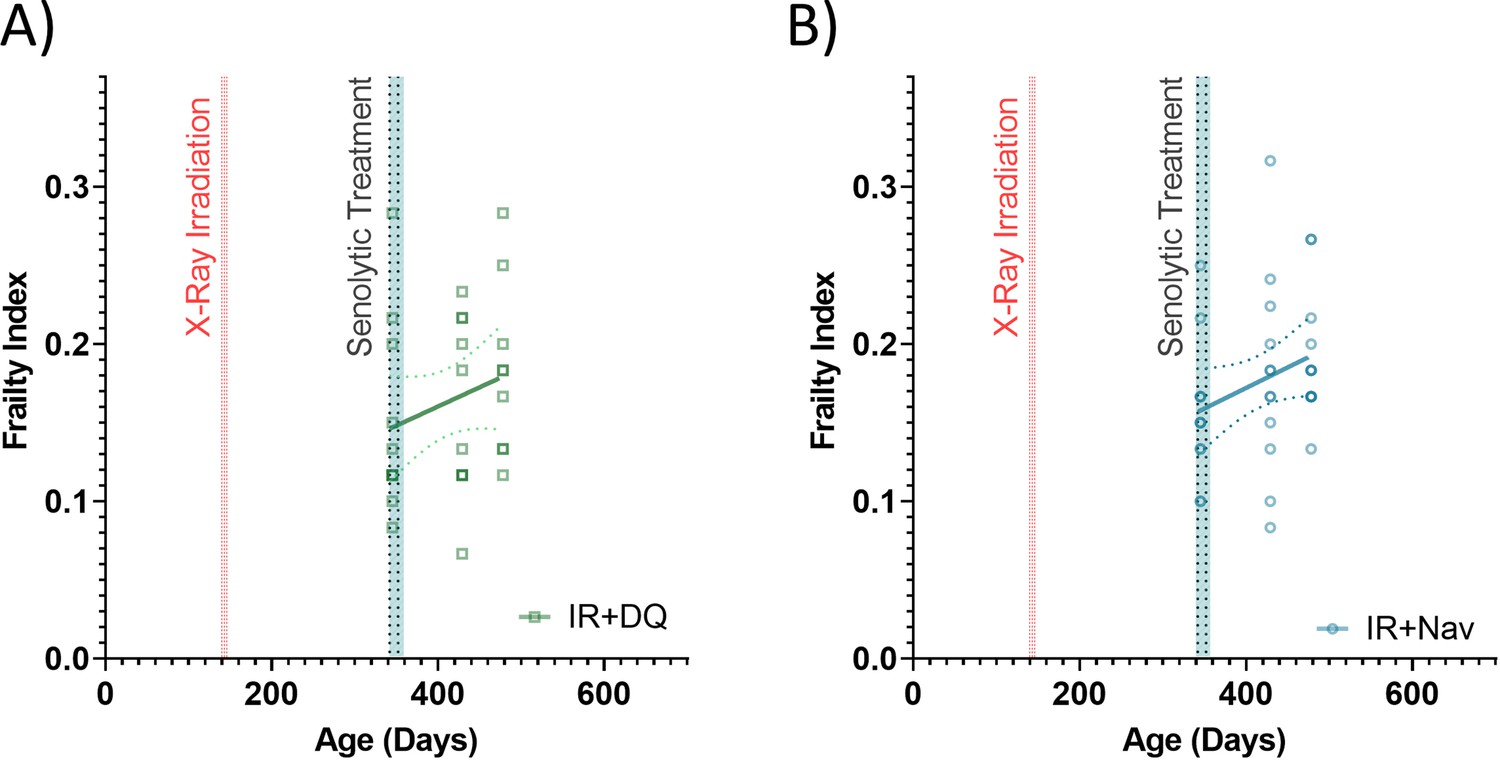
Figure 1—figure supplement 1

Enlarged for clarity (A-D).
Frailty index (FI) vs mouse age for (A) non-irradiated (non-IR, black), (B) irradiated (IR, orange), and IR plus treated with an early intervention of either (C) D+Q (green) or (D) Navitoclax (blue) mice. Dots at 50% opacity indicate FI for individual mice, regression lines and 95% confidence intervals are indicated by bold and narrow dotted lines, respectively. Darker dots indicate multiple animals with the same frailty index score.
Figure 1—figure supplement 2
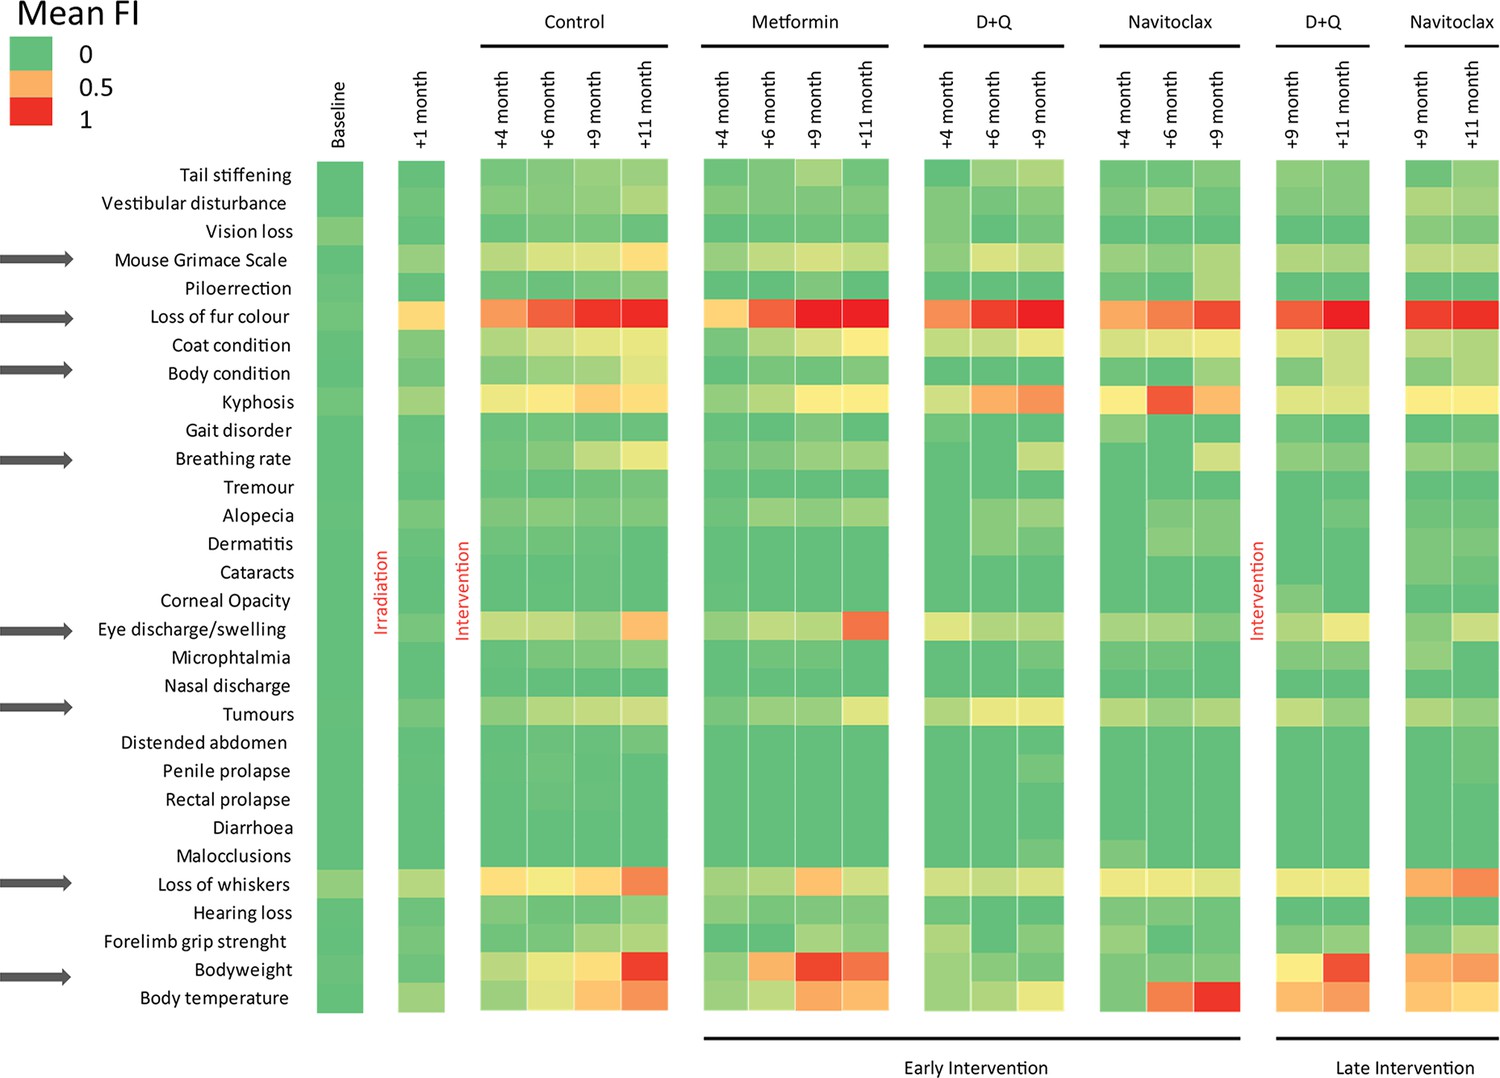
Components of the frailty index (FI).
Colours represent the mean FI of all animals alive at that given point (8–12 animals/group). Arrows indicate components that were improved under the interventions.
Figure 1—figure supplement 3
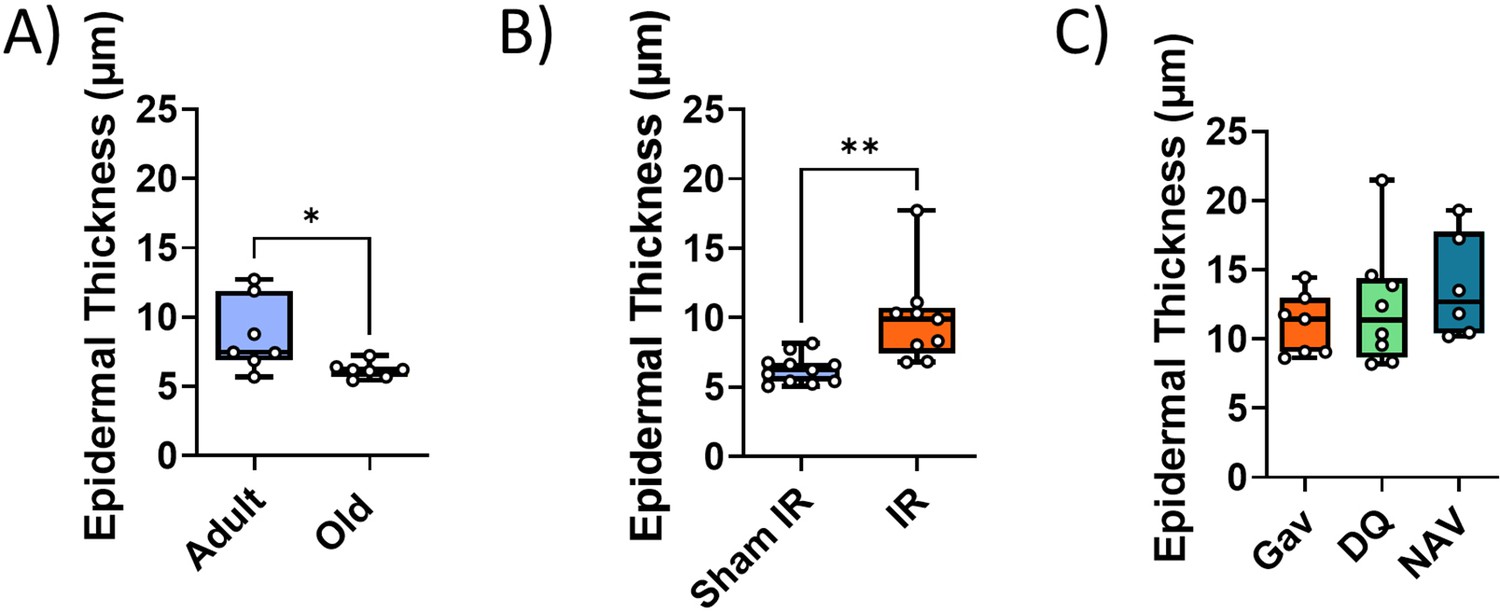
Impact of interventions on epidermal thickness.
(A) Epidermal thickness decreases in old (median age 32 months) as compared to young adult (median age 10 months) mice. (B) Irradiated (IR) at 5 months of age results in increased epidermal thickness at 12 months. (C) Treatment of irradiated mice with senolytics D+Q or Navitoclax at 7 months of age does not change epidermal thickness at 16 months of age. Data are from at least seven animals/group.
Figure 1—figure supplement 4
Validation of senescence markers in liver.
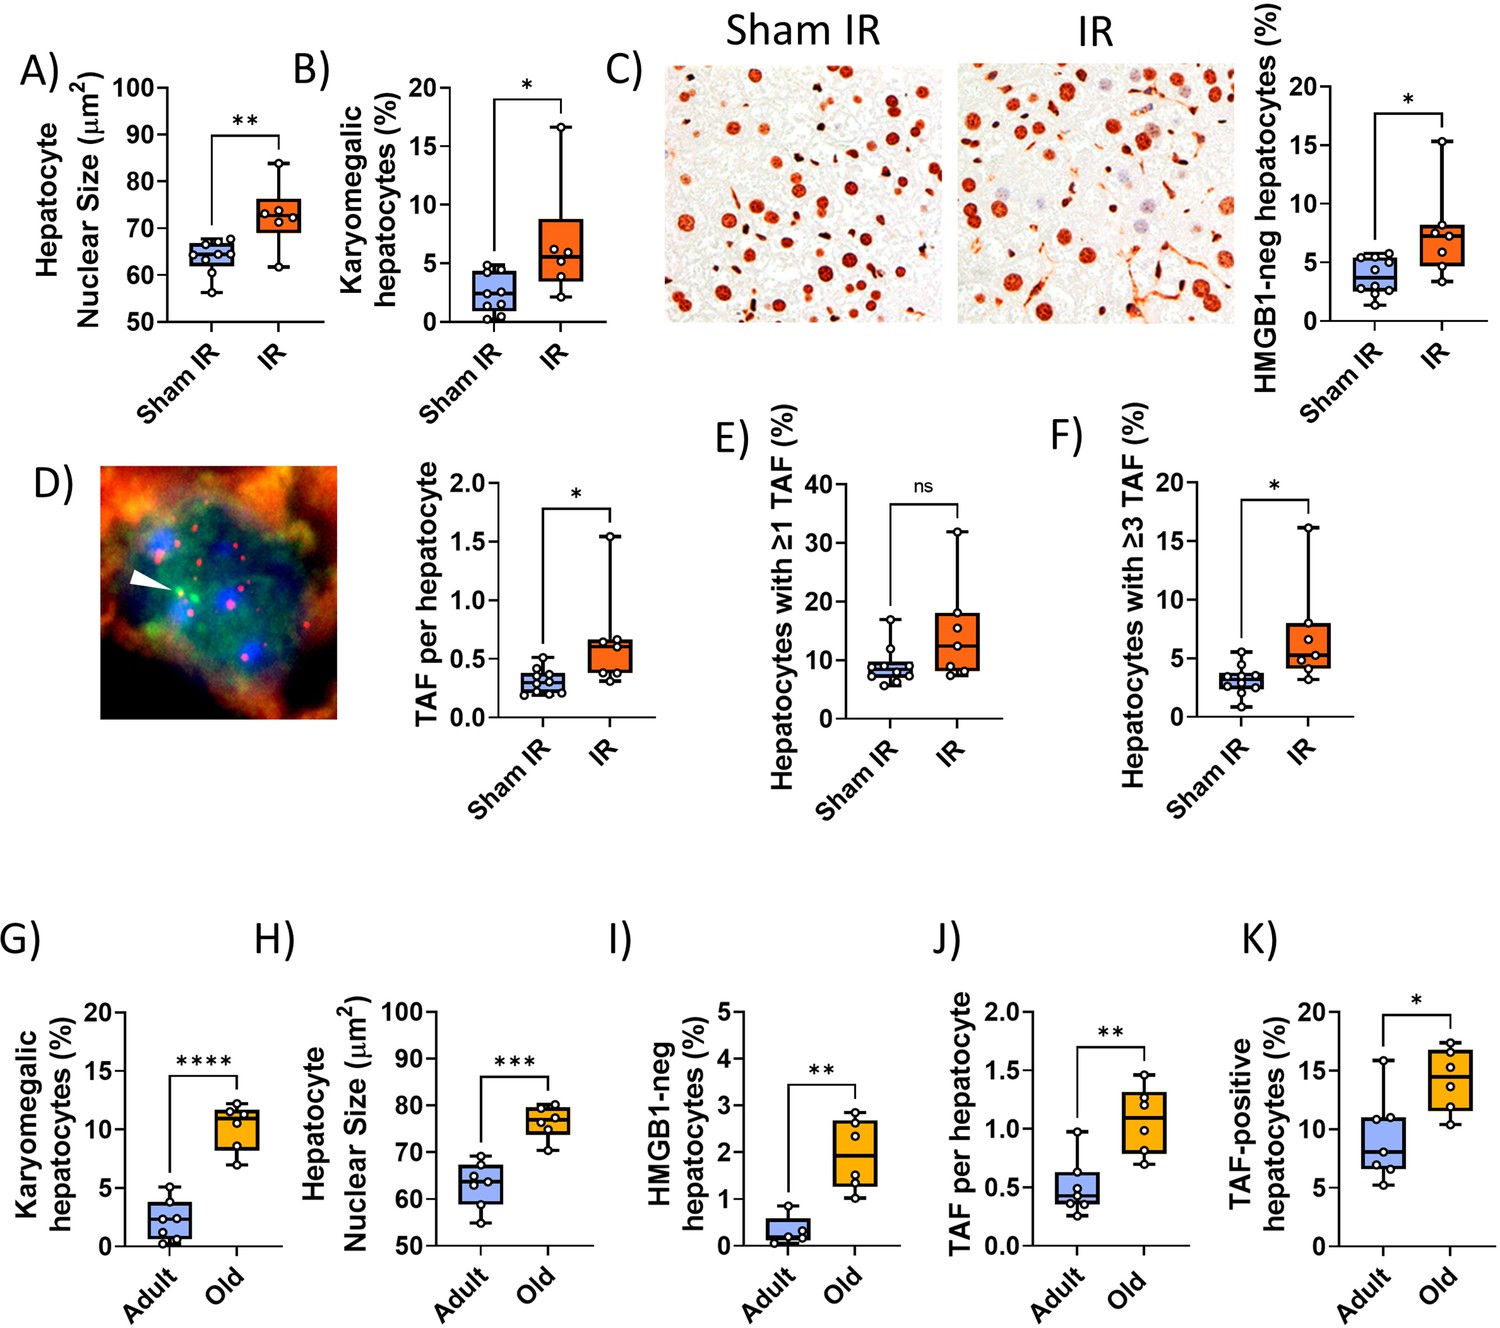
(A–F) Irradiated vs sham-irradiated mice at 12 months of age. (A) Nuclear area. (B) Frequency of karyomegalic hepatocytes. (C) HMGB1 immunohistochemistry. Left: Representative HMGB1 micrographs (left: control, right: 7 months past IR). Right: Frequencies of HMGB1-negative hepatocytes. (D) Telomere-associated foci (TAF) assay. Left: Representative TAF immunoFISH image (single focal plane, arrowhead indicates overlap of a telomere [red] with a γH2AX focus [green], e.g., TAF). Right: Average TAF frequency per hepatocyte nucleus. (E) Frequency of TAF-positive hepatocytes. (F) Frequency of hepatocytes with at least three TAF. (G–K) Young adult (8–14 months) vs old (32 months) mice. Nuclear area (G), frequencies of karyomegalic hepatocytes (H), frequencies of HMGB1-negative hepatocytes (I), TAF frequency per nucleus (J), and frequency of hepatocytes with at least one TAF (K). Data are from at least six animals/group.
Figure 1—figure supplement 5

Impact of early senolytics treatment on hepatocyte senescence at late age (16 months).
Nuclear size (A), percentage of karyomegalic hepatocytes (B), percentage of HMGB1-negative hepatocytes (C), telomere-associated foci (TAF) frequency per nucleus (D), frequency of TAF-positive cells, and (E) frequency of cells with at least three TAF (F) in mice livers at 16 months of age, irradiated at 5 months and treated with either D+Q, Navitoclax, or sham gavage at 6 months. Data are from at least six animals/group.
Figure 1—figure supplement 6

Senescence and neuroinflammation markers in hippocampus after early senolytic intervention.
Neuron nuclear area in CA1 (A) and CA3 (B). (C, D) Left: LaminB1 immunostaining (green) in CA1 (C) and CA3 (D) regions of the hippocampus under the different treatments. Blue: DAPI. Arrowheads indicate Lmn1-positive (red) and negative (white) nuclei. Right: Frequencies of laminB1-negative neurons in CA1 (top) and CA3 (bottom). (E) Telomere-associated foci (TAF) ImmunoFISH of neurons in the CA1 area. Left: Higher magnification of a single TAF (single plane image) and intensity scans for green (gH2AX) and red (telomere) fluorescence. Right: Maximum intensity projections. Frequencies of TAF-positive neurons in CA1 (F) and CA3 (H). Frequencies of neurons with at least three TAF in CA1 (G) and CA3 (I). Ionized calcium-binding adapter molecule 1 (Iba1) + cell density in CA1 (J) and CA3 (K). Iba1 + cell soma size in CA1 (L) and CA3 (M). Data are from at least six animals/group.
Figure 1—figure supplement 7
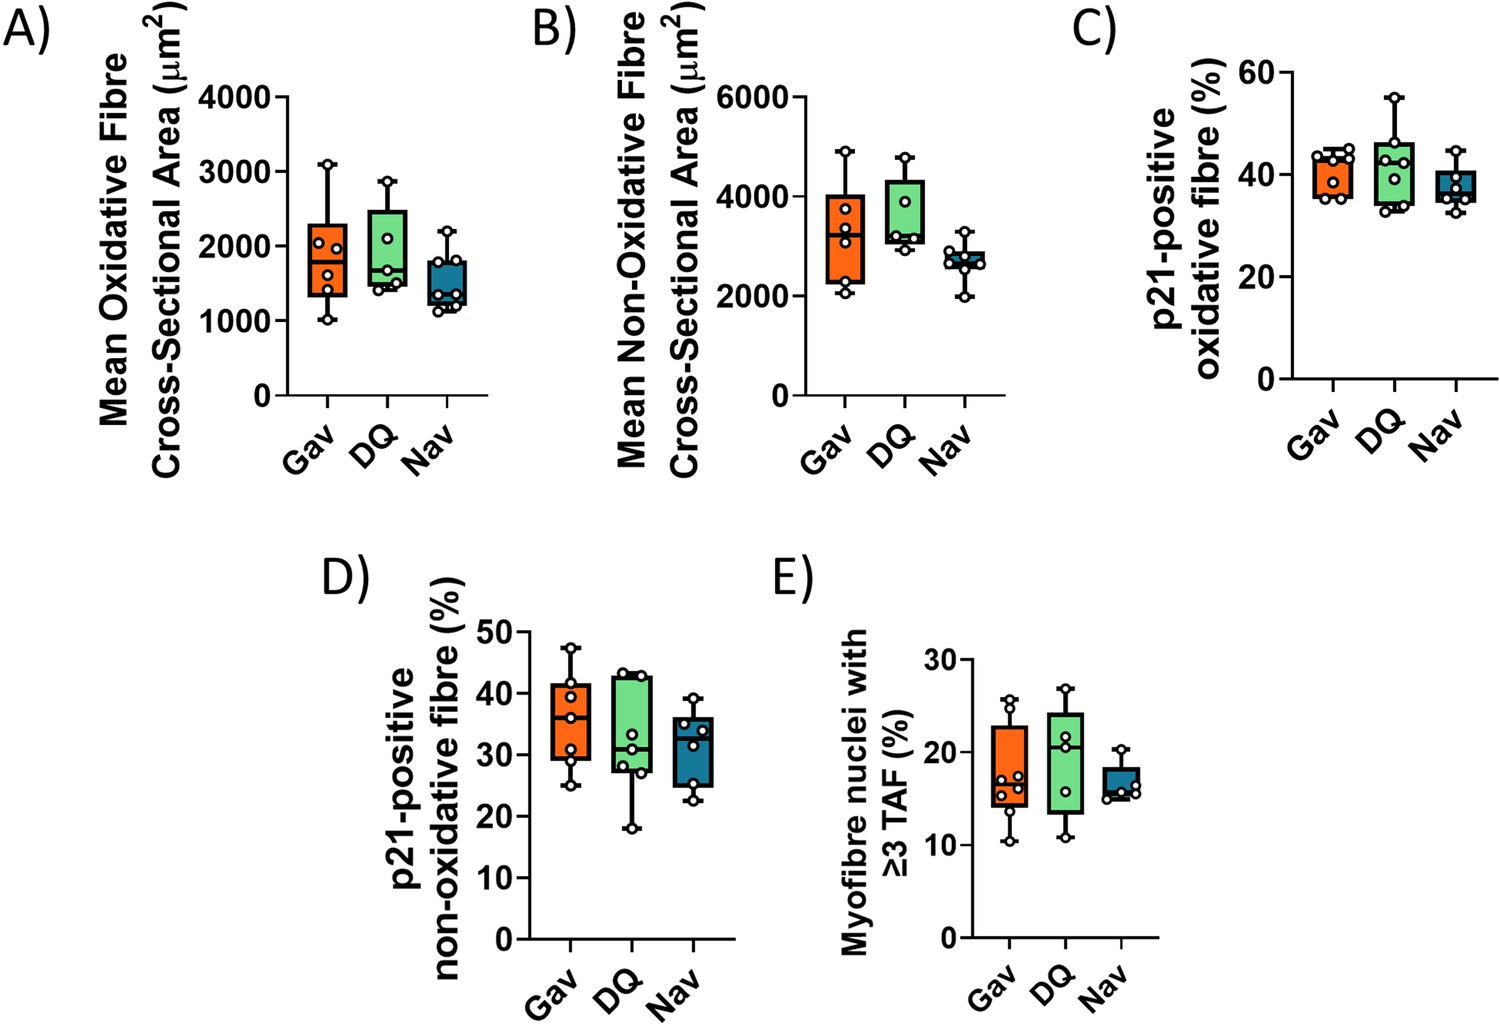
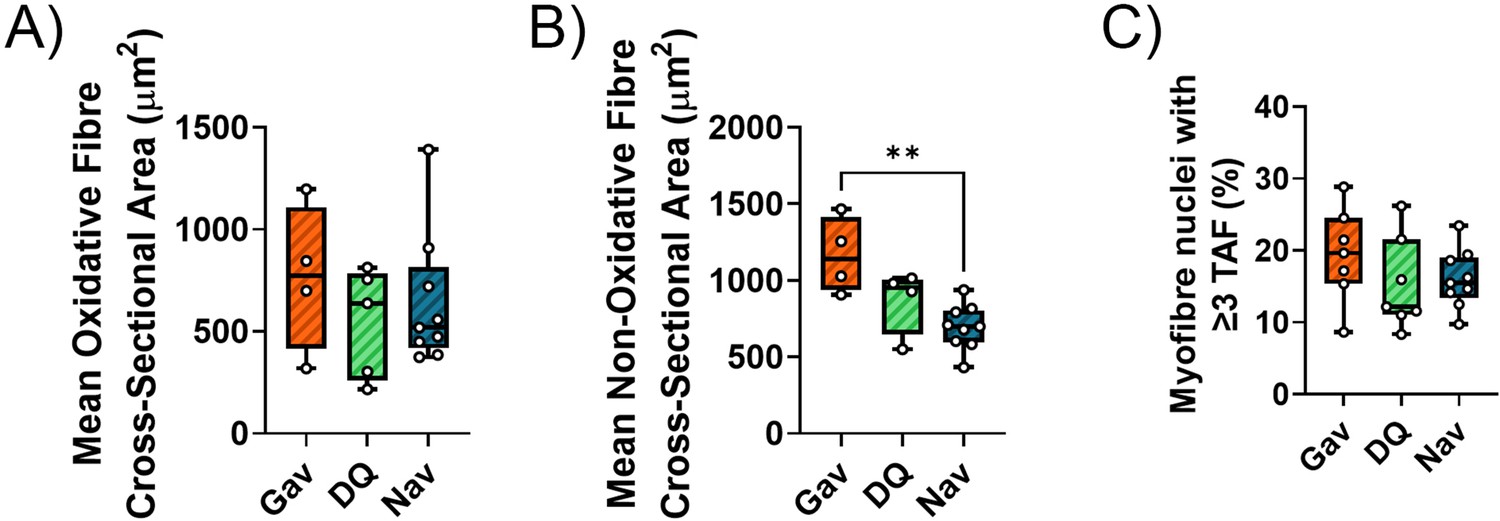
Functional and senescence markers in skeletal muscle after early intervention with D+Q or Navitoclax.
Muscle fibre cross-sectional area in oxidative (A) and non-oxidative (B) fibres from irradiated mice at 16 months of age. Frequencies of p21-positive myonuclei in oxidative (C) and glycolytic (D) fibres. (E) Telomere-associated foci (TAF) frequencies in myonuclei. Data are from at least five animals/group.
Figure 1—figure supplement 8
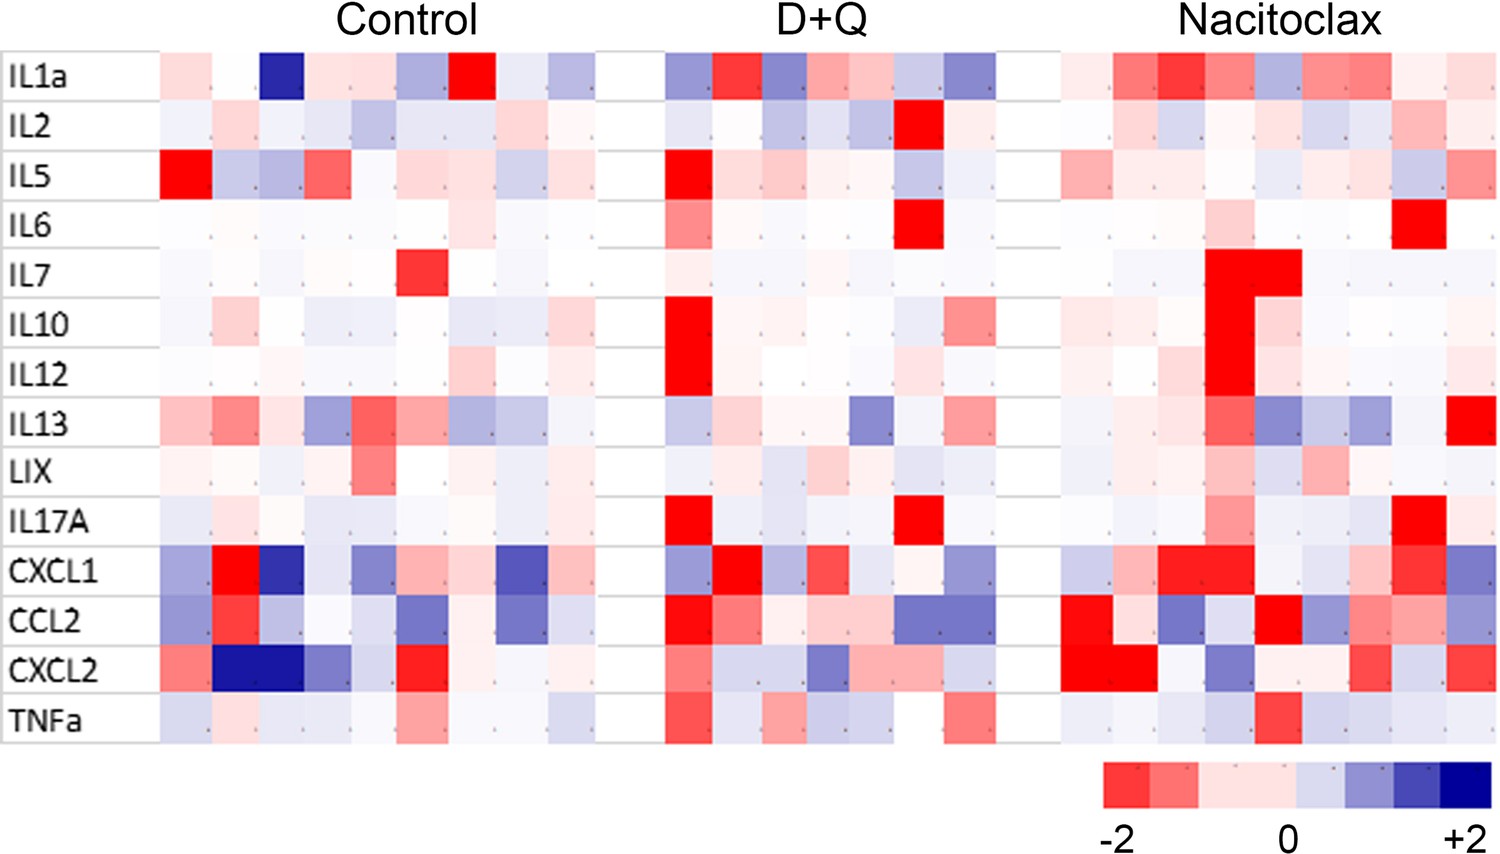
Cytokine/chemokine concentrations in serum of mice at 16 months of age as measured by cytokine array.
Concentrations were measured by cytokine array (Eve Technologies) and z-scored. Four peptides in the array were not significant above background in any mouse and were excluded. There are no significant differences for any peptide between treatment groups.
Figure 2 with 5 supplements
Late senolytic interventions partially block further progression of irradiation-induced accelerated ageing.
(A) Layout of the experiment. (B) Frailty index (FI) vs mouse age for non-irradiated (Non-IR, black), irradiated (IR, red), and irradiated plus treated with either D+Q (green) or Navitoclax (blue) mice. Irradiation and treatment times are indicated by vertical lines. Dots indicate FI for individual mice, regression lines and 95% confidence intervals are indicated by bold and dotted lines, respectively. Individual scores are enlarged for clarity in Figure 2—figure supplement 1. (C) Wire hanging test results (% success) under the indicated treatments. (D) Maximum speed achieved on rotarod under the indicated treatments at 14 months of age. (E) Short-term memory assessed as spontaneous alternation in a Y maze under the indicated treatments. (F) Alanine transaminase (ALT) activity in serum, 16 months old. (G) Tumour prevalence at death. Data are from 12 mice per group at start with attrition to 8–10 mice over the course of the experiment.
Figure 2—figure supplement 1
Enlarged for clarity.
Frailty indices (FIs) vs mouse age for irradiated (IR) plus treated with a late intervention of either (A) D+Q (green) or (B) Navitoclax (blue) mice. Dots at 50% opacity indicate FI for individual mice, regression lines and 95% confidence intervals are indicated by bold and narrow dotted lines, respectively. Darker dots indicate multiple animals with the same FI score.
Figure 2—figure supplement 2

Late intervention with either D+Q or Navitoclax (at 12 months of age) does not change epithelial thickness at 16 months.
Data are from at least seven animals/group.
Figure 2—figure supplement 3

Impact of late senolytics treatment on senescence markers in liver.
Nuclear size (A), percentage of karyomegalic hepatocytes (B), percentage of HMGB1-negative hepatocytes (C), telomere-associated foci (TAF) frequency per nucleus (D), frequency of TAF-positive cells, and (E) frequency of cells with at least three TAF (F) in mice livers at 16 months of age, irradiated at 5 months and treated with either D+Q, Navitoclax, or sham gavage at 12 months. Data are from at least six animals/group.
Figure 2—figure supplement 4
Functional and senescence markers in skeletal muscle after late intervention with D+Q or Navitoclax.
Muscle fibre cross-sectional area in oxidative (A) and non-oxidative (B) fibres from irradiated mice after late intervention at 16 months of age. (C) Telomere-associated foci (TAF) frequencies in myonuclei at 16 months of age after late senolytic intervention. Data are from at least five animals/group.
Figure 2—figure supplement 5

Impact of late intervention on neuroinflammation.
Ionized calcium-binding adapter molecule 1 (Iba1) + cell density in CA1 (A) and CA3 (C). Iba1 + cell soma size in CA1 (B) and CA3 (D). Data are from at five to six animals/group.
Figure 3 with 6 supplements

A short-term intervention with the senostatic metformin rescues irradiation-induced accelerated ageing.
(A) Outline of the experiment. Animals were irradiated at 5 months of age and treated with either soaked food (controls) or metformin in soaked food (Met) from 6 months of age for 10 weeks. (B) Frailty index (FI) vs mouse age for non-irradiated (no IR, black), irradiated (IR, red), and IR plus treated with metformin (blue) mice. Irradiation and treatment times are indicated by vertical lines. Dots indicate FI for individual mice, regression lines and 95% confidence intervals are indicated by bold and dotted lines, respectively. Individual scores are enlarged for clarity in Figure 3—figure supplement 1. (C) Wire hanging test results (% success) under the indicated treatments and ages. (D) Maximum speed achieved on rotarod under the indicated treatments and ages. (E) Short-term memory assessed as spontaneous alternation in a Y maze under the indicated treatments. (F) Alanine transaminase (ALT) activity in plasma at 16 months of age. (G) Tumour prevalence at death. Data are from 12 mice per group at start with attrition to 8–10 mice over the course of the experiment.
Figure 3—figure supplement 1

Enlarged for clarity.
Frailty index (FI) vs mouse age for mice that were irradiated (IR) and fed metformin in soaked food. Dots at 50% opacity indicate FI for individual mice, regression lines and 95% confidence intervals are indicated by bold and narrow dotted lines, respectively. Darker dots indicate multiple animals with the same FI score.
Figure 3—figure supplement 2

Treatment of irradiated mice for 2.5 months with metformin (starting at 7 months of age) tends to reduce epidermal thickness at late age (16 months).
Data are from at least six animals/group.
Figure 3—figure supplement 3

Impact of metformin on senescence markers in liver.
Mice were irradiated at 5 months of age and treated with metformin for 10 weeks starting at 6 months of age. (A) Nuclear size with representative images (left, blue DAPI, green autofluorescence) and quantification (right). (B) Frequency of karyomegalic hepatocytes. (C) Frequency of hepatocytes negative for nuclear HMGB1. (D) Telomere-associated foci (TAF) frequency per nucleus. (E) Frequency of hepatocytes with at least one TAF. (F) Frequency of hepatocytes with at least three TAF. Data are from at least six animals per group at 16 months of age.
Figure 3—figure supplement 4

Senescence and neuroinflammation markers in hippocampus after intervention with metformin.
(A) Neuron nuclear area in CA1 (top) and CA3 (bottom). (B) Frequencies of laminB1-negative neurons in CA1 (top) and CA3 (bottom). (C) Frequencies of telomere-associated foci (TAF)-positive neurons in CA1 (top) and CA3 (bottom). (D) Frequencies of neurons with at least three TAF in CA1 (top) and CA3 (bottom). (E) Ionized calcium-binding adapter molecule 1 (Iba1) + cell density in CA1 (top) and CA3 (bottom). (F) Iba1 + cell soma size in CA1 (top) and CA3 (bottom). Data are from five to six animals/group.
Figure 3—figure supplement 5
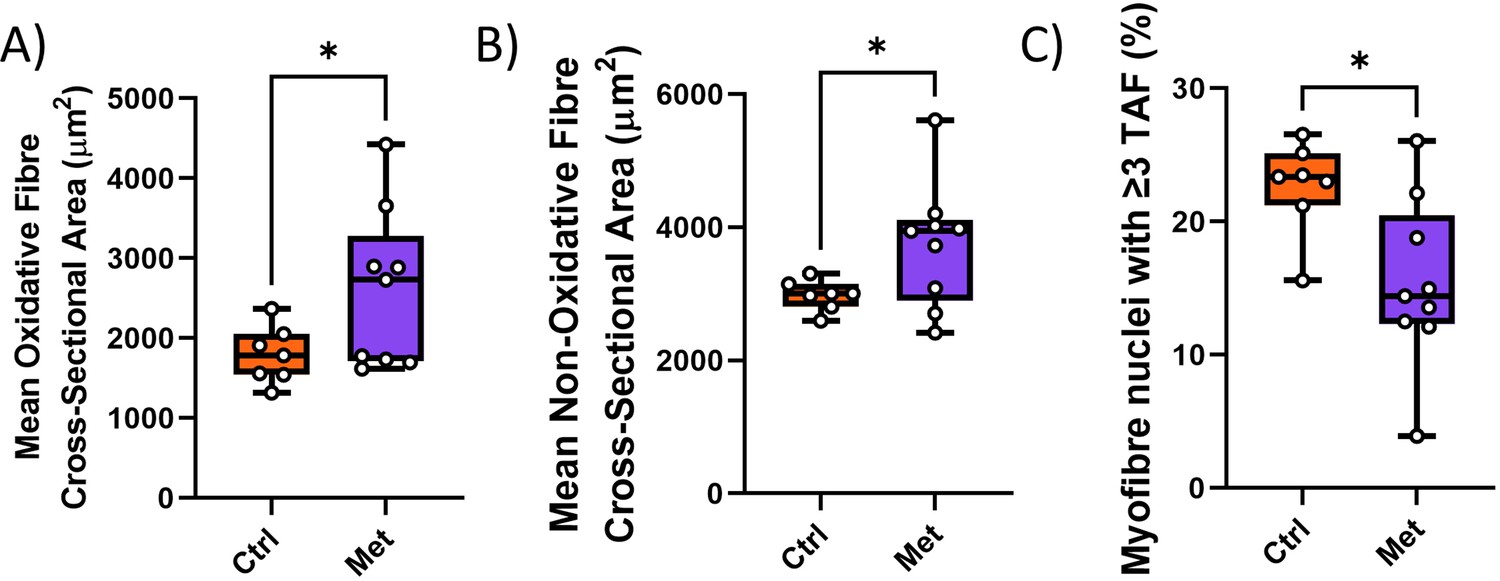
Impact of metformin on hind limb muscle.
Myofibre cross-sectional area of oxidative (A) and non-oxidative (B) fibres. (C) Frequencies of telomere-associated foci (TAF)-positive myonuclei. Data are from at least eight animals per group at 16 months of age.
Figure 3—figure supplement 6

Cytokine/chemokine concentrations in serum of mice at 16 months of age as measured by cytokine array.
Concentrations were measured by cytokine array (Eve Technologies) and z-scored. Four peptides in the array were not significant above background in any mouse and were excluded. Significant differences (t-test) are indicated as p<0.05 (*) and p=0.10 (+).
Figure 4
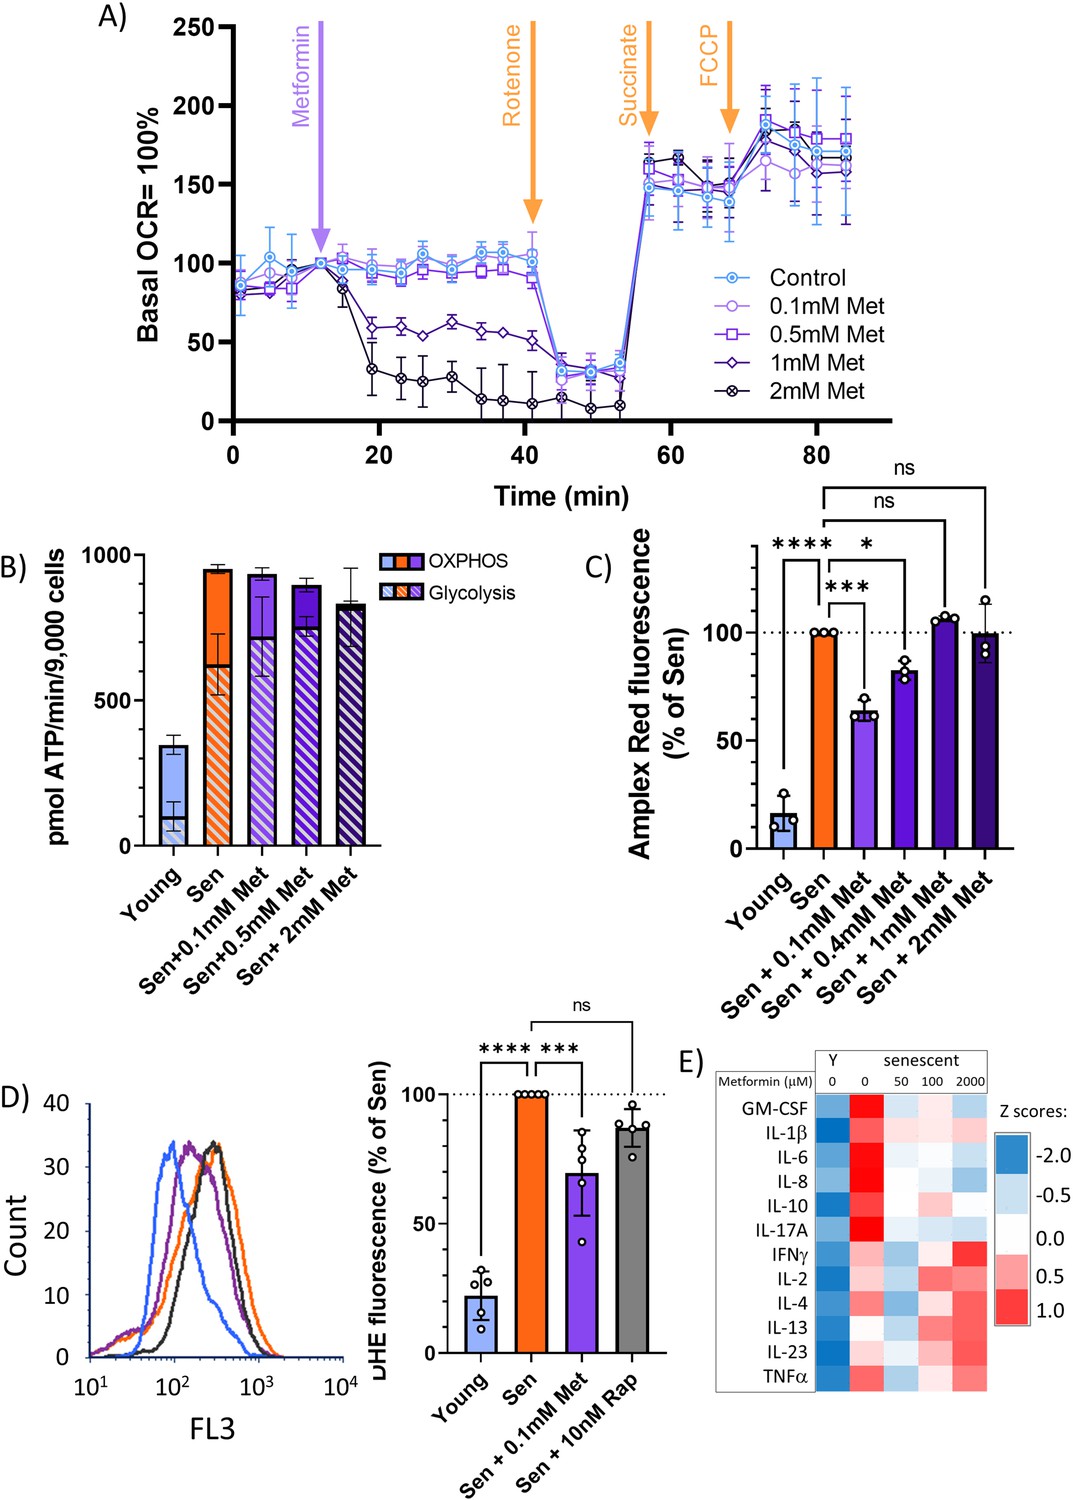
At therapeutic concentrations, metformin reduces reactive oxygen species (ROS) and senescence-associated secretory phenotype but not by inhibition of complex I.
(A) Mitochondrial oxygen consumption rate of permeabilised MRC5 human fibroblasts treated sequentially (at timepoint indicated by arrow) with various concentrations of metformin (Met), 0.5 μM rotenone (Rot), 4 mM succinate (Suc), and 2.5 μM carbonyl cyanide p-trifluoromethoxy-phenylhydrazone. M ± SD, n = 4. (B) ATP production rate by oxidative phosphorylation (OXPHOS) and glycolysis in young and senescent MRC5 human fibroblasts treated for 10 days with the indicated metformin concentrations. M ± SD, n = 4. (C) Impact of metformin in the indicated concentrations on ROS production measured by AR in human fibroblasts. Cells were induced to senescence by IR and treated with metformin for 10 days. M ± SD, n = 3. (D) Impact of rapamycin and metformin on ROS levels in human fibroblasts measured by dihydroethidium (DHE) fluorescence in FACS. Left: representative FL3 histograms. Light blue: young, red: senescent (10d past IR), purple: senescent + 0.1 mM metformin, black: senescent + 10 nM rapamycin. Right: average DHE fluorescence intensities. M ± SD, n = 5. (E) Cytokine concentrations in the supernatant of human fibroblasts. N = 2. Senescent fibroblasts were treated with the indicated metformin concentrations for 10 days. Source data are provided as Figure 4—source data 1.
-
Figure 4—source data 1
Cytokine array primary data.
- https://cdn.elifesciences.org/articles/75492/elife-75492-fig4-data1-v2.zip
Figure 5 with 1 supplement
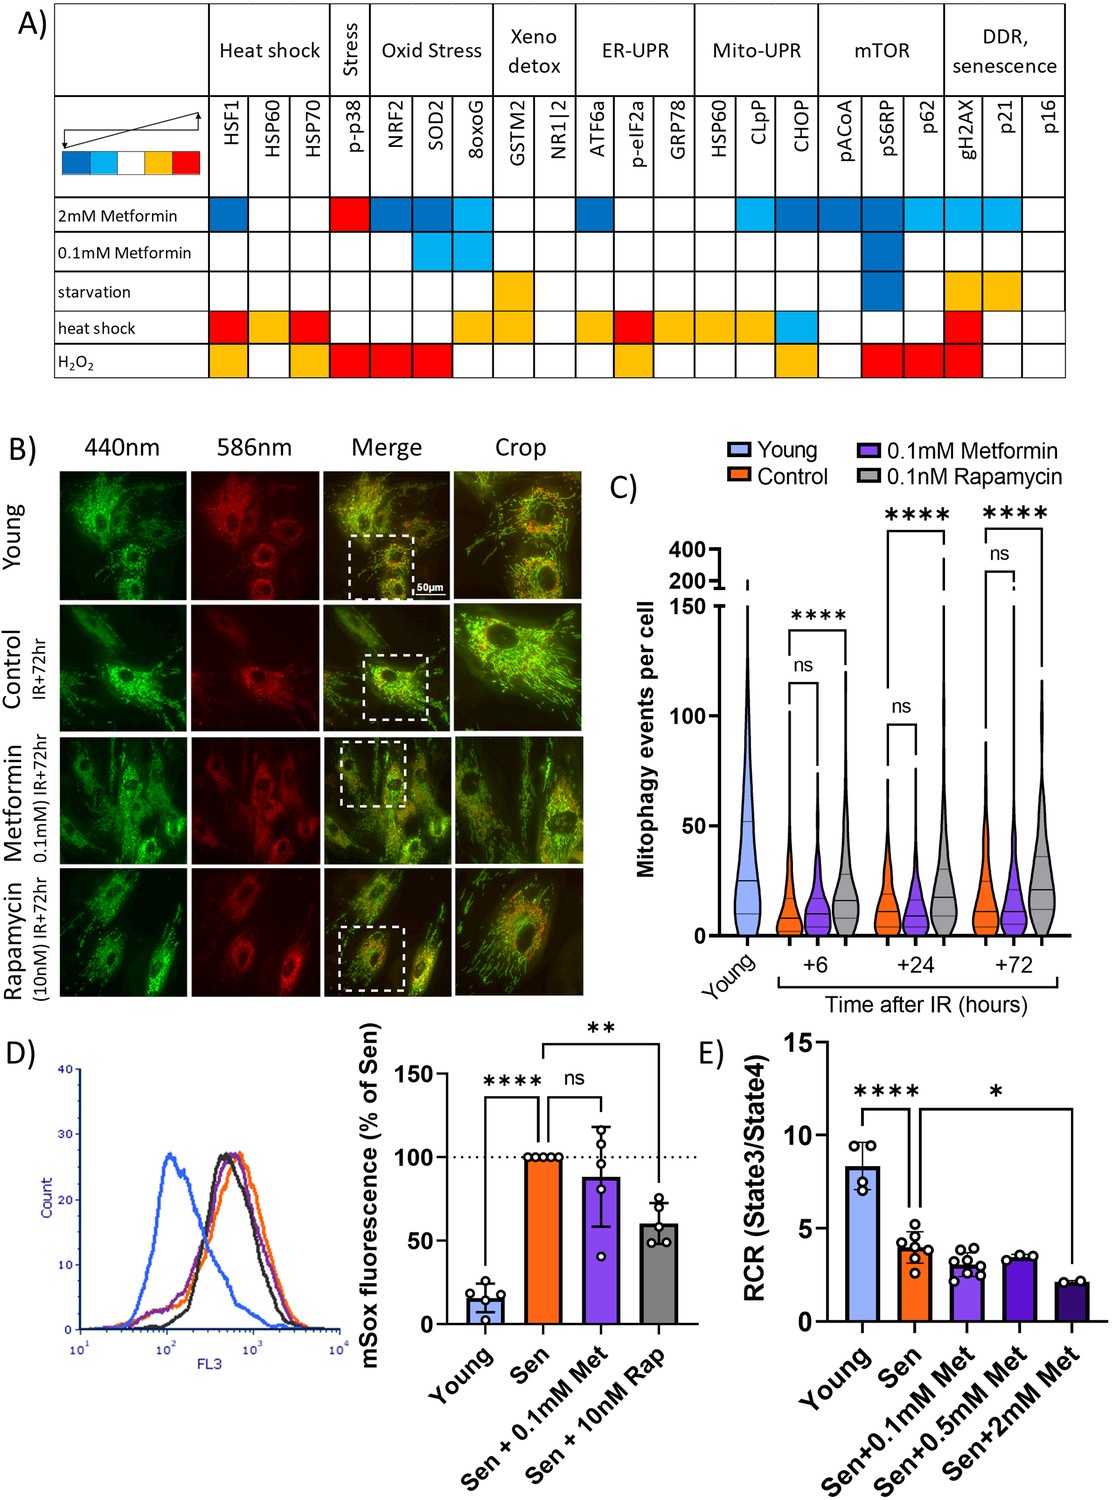
Low concentrations of metformin do not improve mitochondrial turnover and function.
(A) Impact of high (2 mM) and low (100 µM) concentrations of metformin on stress response pathways in human fibroblasts. cytometry by time of flight with the indicated antibodies was performed on human MRC5 fibroblasts treated for 2 days with the indicated interventions. Heat map colour codes indicate strong decrease (dark blue), mild decrease (light blue), no change (white), light increase (amber), or strong increase (red) as exemplified in Figure 5—figure supplement 1. Data are pooled from two independent experiments. (B) Dermal fibroblasts expressing mt-mKeima were irradiated with 20 Gy and treated with either 100 µM metformin or 10 nM rapamycin for 3 days. Red fluorescence indicates mitochondria engulfed in lysosomes. (C) Number of mitophagy events per cell. Dermal fibroblasts expressing mt-mKeima were irradiated with 20 Gy and treated with either 100 µM metformin or 10 nM rapamycin for the indicated times. N = 196–271 cells per condition pooled from three biological repeats. (D) Impact of rapamycin and metformin on mitochondrial superoxide levels in human fibroblasts either young or at 10 days after IR measured (Sen) by MitoSOX fluorescence in FACS. N = 5. (E) Respiratory control ratio (RCR) of mitochondria in fibroblasts at 10 days after IR treated with the indicated concentrations of metformin. N ≥ 3.
Figure 5—figure supplement 1
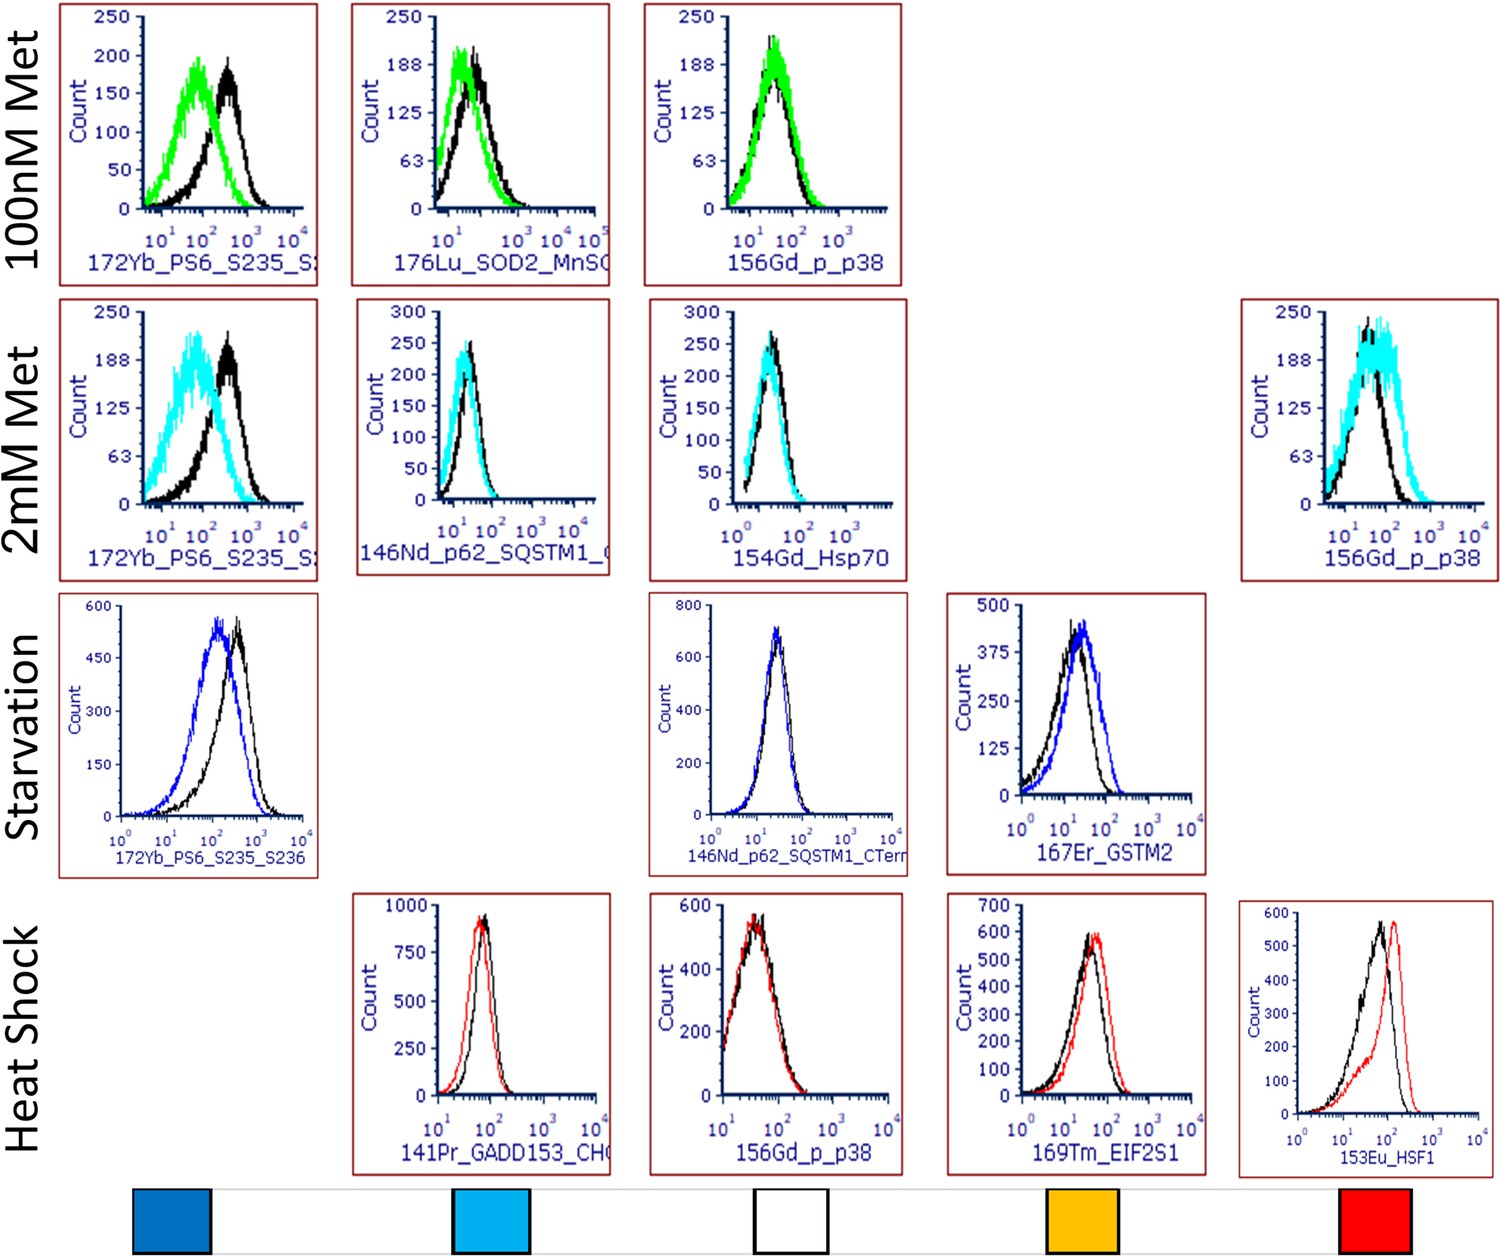
Representative histogram overlay examples for use of cytometry by time of flight as stress pathway identifier.
Treatments are indicated on the left. Colour codes at the bottom represent strong decrease (dark blue), mild decrease (light blue), no change (white), light increase (amber), or strong increase (red) and correspond to the heatmap in Figure 5A.
Figure 6 with 1 supplement
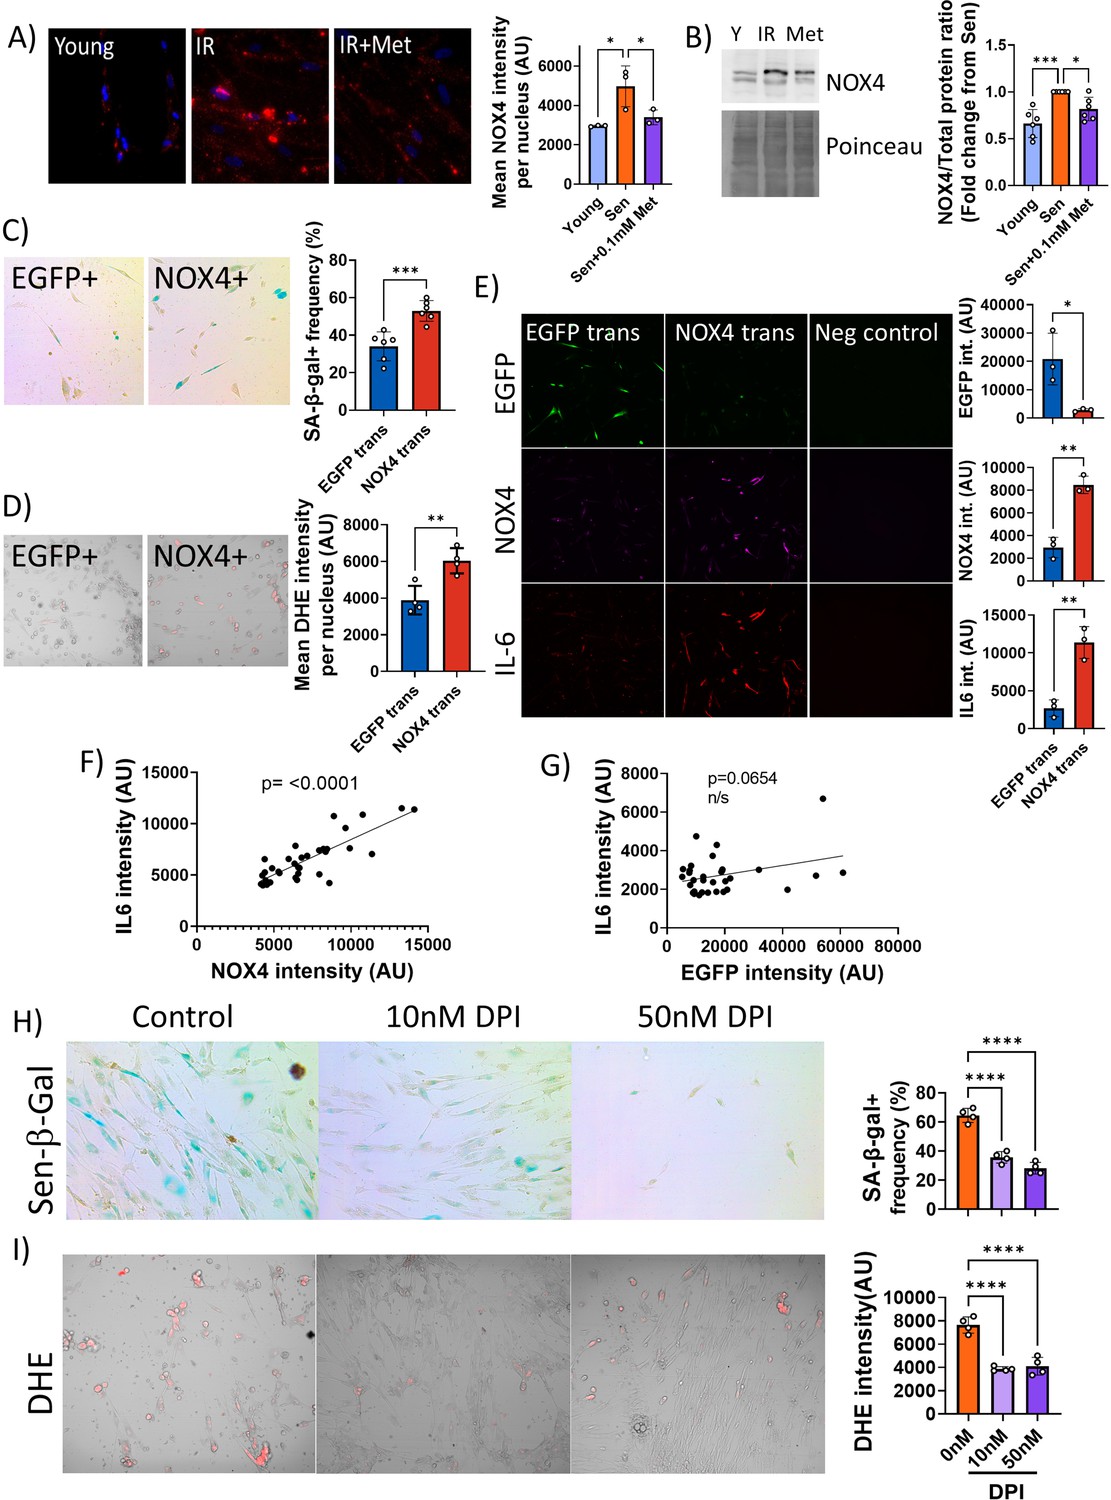
Low concentrations of metformin reduce reactive oxygen species in senescence via suppression of NOX4.
(A) Human fibroblasts were irradiated with 20 Gy and treated with 100 µM metformin for 10 days. Left: Representative images of cells treated as indicated, red: NADPH oxidase 4 (NOX4) immunofluorescence, blue: DAPI. Right: Quantification of NOX4 fluorescence intensity. (B) Left: Representative NOX4 Western blot. Cells treated as above. A complete blot is provided as Figure 6—source data 1. Right: Average NOX4 signal intensity, normalised to total protein. (C) Left: Sen-β-Gal staining in EGFP- and NOX4-overexpressing fibroblasts. Right: Average frequencies of Sen-β-Gal-positive cells. (D) Left: Dihydroethidium (DHE) staining in EGFP- and NOX4-overexpressing fibroblasts. DHE fluorescence in red, cells visualised in phase contrast. Right: Average DHE fluorescence intensity per cell. (E) Co-staining for NOX4 (red) and IL-6 (green) on EGFP- or NOX4-transfected fibroblasts. Right: Fluorescence intensity levels for EGFP (top), NOX4 (middle), and IL-6 in EGFP- and NOX4-transfected cells. (F) Correlation between cellular NOX4 and IL6 fluorescence signals in NOX4-transfected cells. (G) Correlation between cellular EGFP and IL6 fluorescence signals in EGFP-transfected cells. (H) Left: Sen-β-Gal staining in senescent fibroblasts treated with the indicated concentrations of diphenyleneiodonium chloride (DPI). Right: Frequencies of Sen-β-Gal-positive cells. (I) Left: DHE staining in senescent fibroblasts treated with the indicated concentrations of DPI. DHE fluorescence in red, cells visualised in phase contrast. Right: Average intensity of DHI fluorescence per cell. All experiments N ≥3.
-
Figure 6—source data 1
Full-length NOX4 Western Blot.
- https://cdn.elifesciences.org/articles/75492/elife-75492-fig6-data1-v2.zip
Figure 6—figure supplement 1

NADPH oxidase 4 (NOX4) does not colocalise with mitochondria.
Senescent MRC5 fibroblasts, representative double staining with NOX4 (green), and TOMM20 (red). Blue: DAPI.
Tables
Key resources table
| Reagent type (species) or resource | Designation | Source or reference | Identifiers | Additional information |
|---|---|---|---|---|
| Strain, strain background (Mus musculus, male) | Wild-type | Charles River | C57BL/6 | |
| Cell line (Homo sapiens) | Human foetal lung, male | ECACC | MRC5, Cat-Nr. 05072101 | |
| Antibody | Anti-HMGB1 (Rabbit monoclonal) | Abcam | Cat# ab79823, RRID:AB_1603373 | (1:250) |
| Antibody | Anti-TOMM20 (Mouse monoclonal) | Abcam | Cat# ab56783, RRID:AB_945896 | (1:200) |
| Antibody | Anti-Iba-1 (Rabbit monoclonal) | Abcam | Cat# ab178846, RRID:AB_2636859 | (1:2000) |
| Antibody | Anti-LMNB1 (Rabbit polyclonal) | Abcam | Cat# ab16048, RRID:AB_443298 | (1:200) |
| Antibody | Anti-NOX4 (Rabbit monoclonal) | Abcam | Cat# ab109225, RRID:AB_10861375 | IF (1:200) WB (1:2000) |
| Antibody | Anti-IL6 (Mouse monoclonal) | Abcam | Cat# ab9324, RRID:AB_307175 | (1:500) |
| Antibody | Anti-p21 (Rabbit monoclonal) | Abcam | Cat# ab109520, RRID:AB_10860537 | (1:100) |
| Antibody | Anti-Phosphor-Histone H2AX (Rabbit monoclonal) | Cell Signalling Technology | Cat# 9718, RRID:AB_2118009 | (1:250) |
| Antibody | Anti-Beta-Actin (Rabbit monoclonal) | Cell Signalling Technology | Cat# 5125, RRID:AB_1903890 | WB (1:1000) |
| Recombinant DNA reagent | pCHAC-mt-mKeima | Addgene | Cat-Nr. #72,342 | |
| Recombinant DNA reagent | pcDNA3.1-hNOX4 | Addgene | Cat-Nr. #69,352 | |
| Recombinant DNA reagent | pcDNA3.1(+)eGFP | Addgene | Cat-Nr. #129,020 | |
| Commercial assay or kit | Human Cytokine Array Proinflammatory focused 13-plex Assay | Eve Technologies | HDF13 | |
| Commercial assay or kit | Mouse High Sensitivity 18-Plex Discovery Assay | Eve Technologies | MDHSTC18 | |
| Commercial assay or kit | eBioscience Foxp3/Transcription Factor Staining Buffer Set | ThermoFisher | 00-5523-00 | |
| Chemical compound, drug | Dasatinib | Merck | CDS023389 | |
| Chemical compound, drug | Quercetin | Merck | #1592409 | |
| Chemical compound, drug | Navitoclax | Stratech | #285063-USB | |
| Chemical compound, drug | Metformin HCL API | Pharmahispania | ||
| Chemical compound, drug | Polyethylenglycol 400 | Merck | #8074851000 |
Table 1
Immunostaining and blotting methods.
| Tissue | Thickness | Technique | Primary antibody | Cat No, vendor | Dilution | Secondary antibody | Cat No, vendor | Dilution | Detection |
|---|---|---|---|---|---|---|---|---|---|
| Liver | 3 | IF | Rabbit anti-HMGB1 | Ab79823 (Abcam) | 1:250 | Goat Anti-Rabbit IgG H&L, Texas Red | Ab6719 (Abcam) | 1:500 | |
| 3 | IF | Mouse anti-TOMM20 | Ab56783 (Abcam) | 1:200 | Goat anti-mouse (Alexa Fluor 594) | Ab150116 | 1:1,000 | ||
| Quads | 3 | IF | Rabbit anti-HMGB1 | Ab79823 (Abcam) | 1:250 | Goat anti-rabbit (Alexa Fluor 594) | A32740 (ThermoFisher) | 1:1,000 | |
| Brain | 10 | IHC | Rabbit anti-Iba1 | Ab178846 (Abcam) | 1:2000 | Biotinylated Goat anti-rabbit | BA-1000 (Vector labs) | 1:250 | VECTASTAIN ABC-HRP Kit, NovaRED (Vevtor labs) |
| 3 | IF | Rabbit anti-γH2A.X primary antibody | 9,718 (Cell Signalling) | 1:250 | Biotinylated Goat anti-rabbit | BA-1000 (Vector labs) | 1:250 | Fluorescein Avidin DCS (1:500) (Vector labs) | |
| 3 | IF | Rabbit anti-Lamin B1 | ab16048 (Abcam) | 1:200 | Biotinylated Goat anti-rabbit | BA-1000 (Vector labs) | 1:250 | Fluorescein Avidin DCS (1:500) (Vector labs) | |
| MRC5 Cells | ICC | Anti-NADPH oxidase 4 antibody | ab109225 (Abcam) | 1:200 | Goat Anti-Rabbit IgG H&L (Alexa Fluor 594) | ab150080 (Abcam) | 1:1,000 | ||
| Anti-IL6 antibody | ab9324 (Abcam) | 1:500 | Anti-Mouse IgG (H+L) Alexa Fluor 488 | A-11017 (vector labs) | 1:1,000 | ||||
| Rabbit anti-p21 | ab109520 (Abcam) | 1:100 | Goat Anti-Rabbit IgG H&L (Alexa Fluor 594) | ab150080 (Abcam) | 1:1,000 | ||||
| Rabbit anti-HMGB1 | ab79823 (Abcam) | 1:250 | Goat Anti-Rabbit IgG H&L (Alexa Fluor 594) | ab150080 (Abcam) | 1:1,000 | ||||
| Protein | WB | Anti-NADPH oxidase 4 antibody | ab109225 (Abcam) | 1:2000 | Goat Anti-Rabbit IgG H&L (HRP) | ab6721 (Abcam) | 1:10,000 | ||
| Anti-β-Actin antibody | 5,125 (Cell Signaling) | 1:1,000 | Goat Anti-Rabbit IgG H&L (HRP) | ab6721 (Abcam) | 1:10,000 | ||||
Table 2
List of metal conjugated antibodies for stress response pathway analysis by CyTOF.
| Antibody | Metal | cat # | Vendor |
|---|---|---|---|
| SOD2/MnSOD [9E2BD2] | 176Yb | ab110300 | Abcam |
| GSTM2 (9E975) | 167Er | H00002946-M03 | Novus Biologicals |
| HSF1 | 153Eu | 825,801 | BioLegend |
| Hsp-70 (2A4) | 154Sm | ab5442 | Abcam |
| Nrf2 (phospho S40) [EP1809Y] | 142Nd | ab180844 | Abcam |
| NR1L2/PXR (6H11D8) | 164Dy | LS-C682408-LSP | Stratech Scientific Ltd. |
| GRP78 BiP [EPR4041(2)] | 161Dy | ab108615 | Abcam |
| EIF2S1 (phospho S51) (E90) | 169Tm | ab214434 | Abcam |
| ATF-6 (-Carboxy terminal end) | 175Lu | ab62576 | Abcam |
| GADD153/CHOP | 141Pr | NBP2-13172 | Novus Biologicals |
| CLPP [EPR7133] | 165Ho | ab236064 | Abcam |
| Hsp-60 (LK1) | 144Nd | ab212454 | Abcam |
| pS6 [S235/S236] | 172Yb | 3172008 A | Fluidigm |
| p21 Waf1/Cip1 | 159Tb | 3159026 A | Fluidigm |
| Phospho-Acetyl-CoA Carboxylase (Ser79) (10HCLC) | 170Er | 711,289 | ThermoFisher |
| p62 /SQSTM1 (C-terminus) | 146Nd | GP62-C | Progen |
| p-p38 [T180/Y182] | 156Gd | 3156002 A | Fluidigm |
| DNA/RNA damage | 173Yb | ab62623 | Abcam |
| pHistone H2A.X [Ser139] | 147Sm | NB100-384 | Novus Biologicals |
| PHB | 151Eu | NBP2-32305 | Novus Biologicals |
| p16INK4 | 174Yb | ab54210 | Abcam |
| Cell-ID Intercalator-Ir—500 μM | 201,192B | Fluidigm |
Additional files
Download links
A two-part list of links to download the article, or parts of the article, in various formats.
Downloads (link to download the article as PDF)
Open citations (links to open the citations from this article in various online reference manager services)
Cite this article (links to download the citations from this article in formats compatible with various reference manager tools)
Short senolytic or senostatic interventions rescue progression of radiation-induced frailty and premature ageing in mice
eLife 11:e75492.
https://doi.org/10.7554/eLife.75492


