Mechanism of Ca2+ transport by ferroportin
- Verna and Marrs McLean Department of Biochemistry and Molecular Biology, Baylor College of Medicine, United States
Figures
Figure 1 with 4 supplements
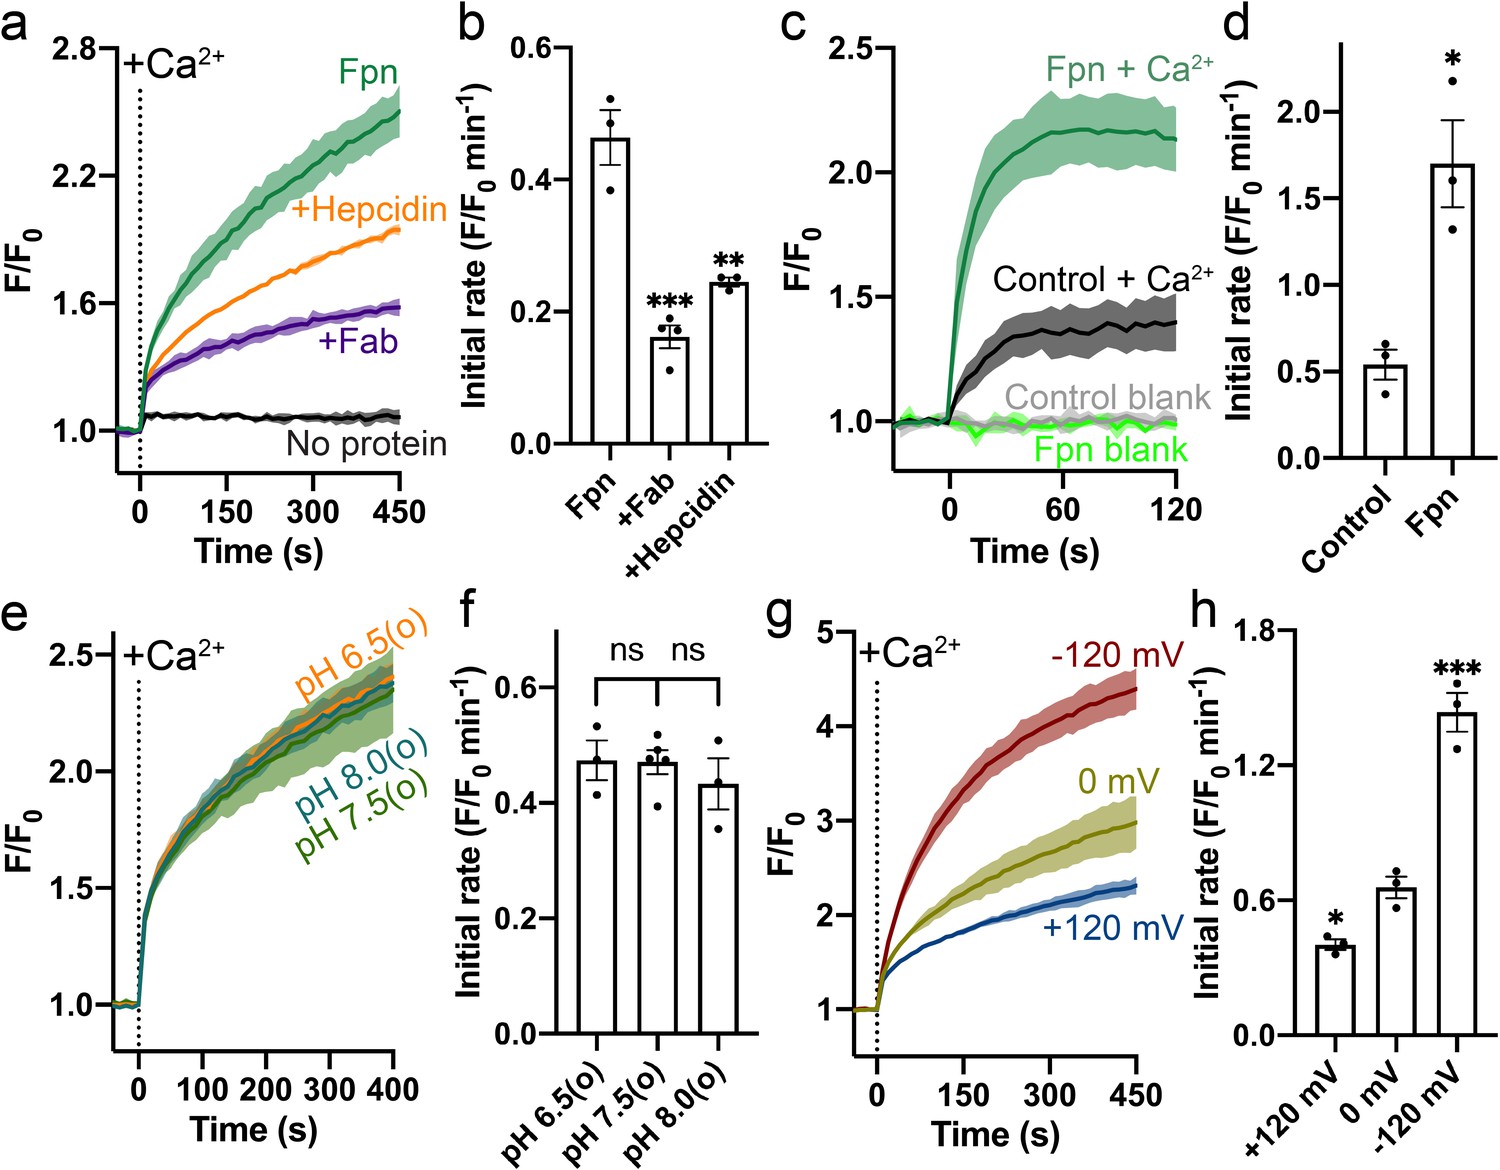
Specific Ca2+ uniport by HsFpn.
(a) Ca2+ influx by HsFpn in proteoliposomes measured by fluorescence changes (F/F0) of Fluo-4 (green). The presence of 11F9 Fab (purple) or hepcidin (orange) reduces the Ca2+ influx. (b) Comparison of initial rates of Ca2+ influx in (a). (c) Ca2+ uptake in HEK cells expressing HsFpn monitored by Fluo-4 loaded inside cells. Cells overexpressing Fpn show a significantly faster Ca2+ uptake compared to control cells transfected with an empty vector. (d) Comparison of initial rates of Ca2+ uptake in (c). (e) Ca2+ influx by HsFpn in proteoliposomes at different outside (o) pHs. The inside pH is maintained at 7.5. (f) Comparison of initial rates of Ca2+ transport at different outside pHs. (g) Ca2+ influx by HsFpn in proteoliposomes at different membrane potentials. Valinomycin was used to generate a membrane potential prior to the addition of Ca2+. (h) Comparison of initial rates of Ca2+ transport at different membrane potentials. In all the transport assays, 500 µM of Ca2+ was added at time zero. Statistical significances were analyzed with one-way analysis of variance (ANOVA) followed by Dunnett’s test for multiple comparisons. In this article, all time-dependent fluorescence traces are shown as solid lines (mean) with shaded regions (standard deviation, SD) from at least three biological repeats. For all bar graphs, a scatter plot is overlaid on each bar. The height represents the mean of at least three measurements, and the error bar standard error of the mean (SEM). Statistical significances are indicated as follows: ns, not significant; *, p < 0.05; **, p < 0.01; ***, p < 0.001; ****, p<0.0001.
Figure 1—figure supplement 1
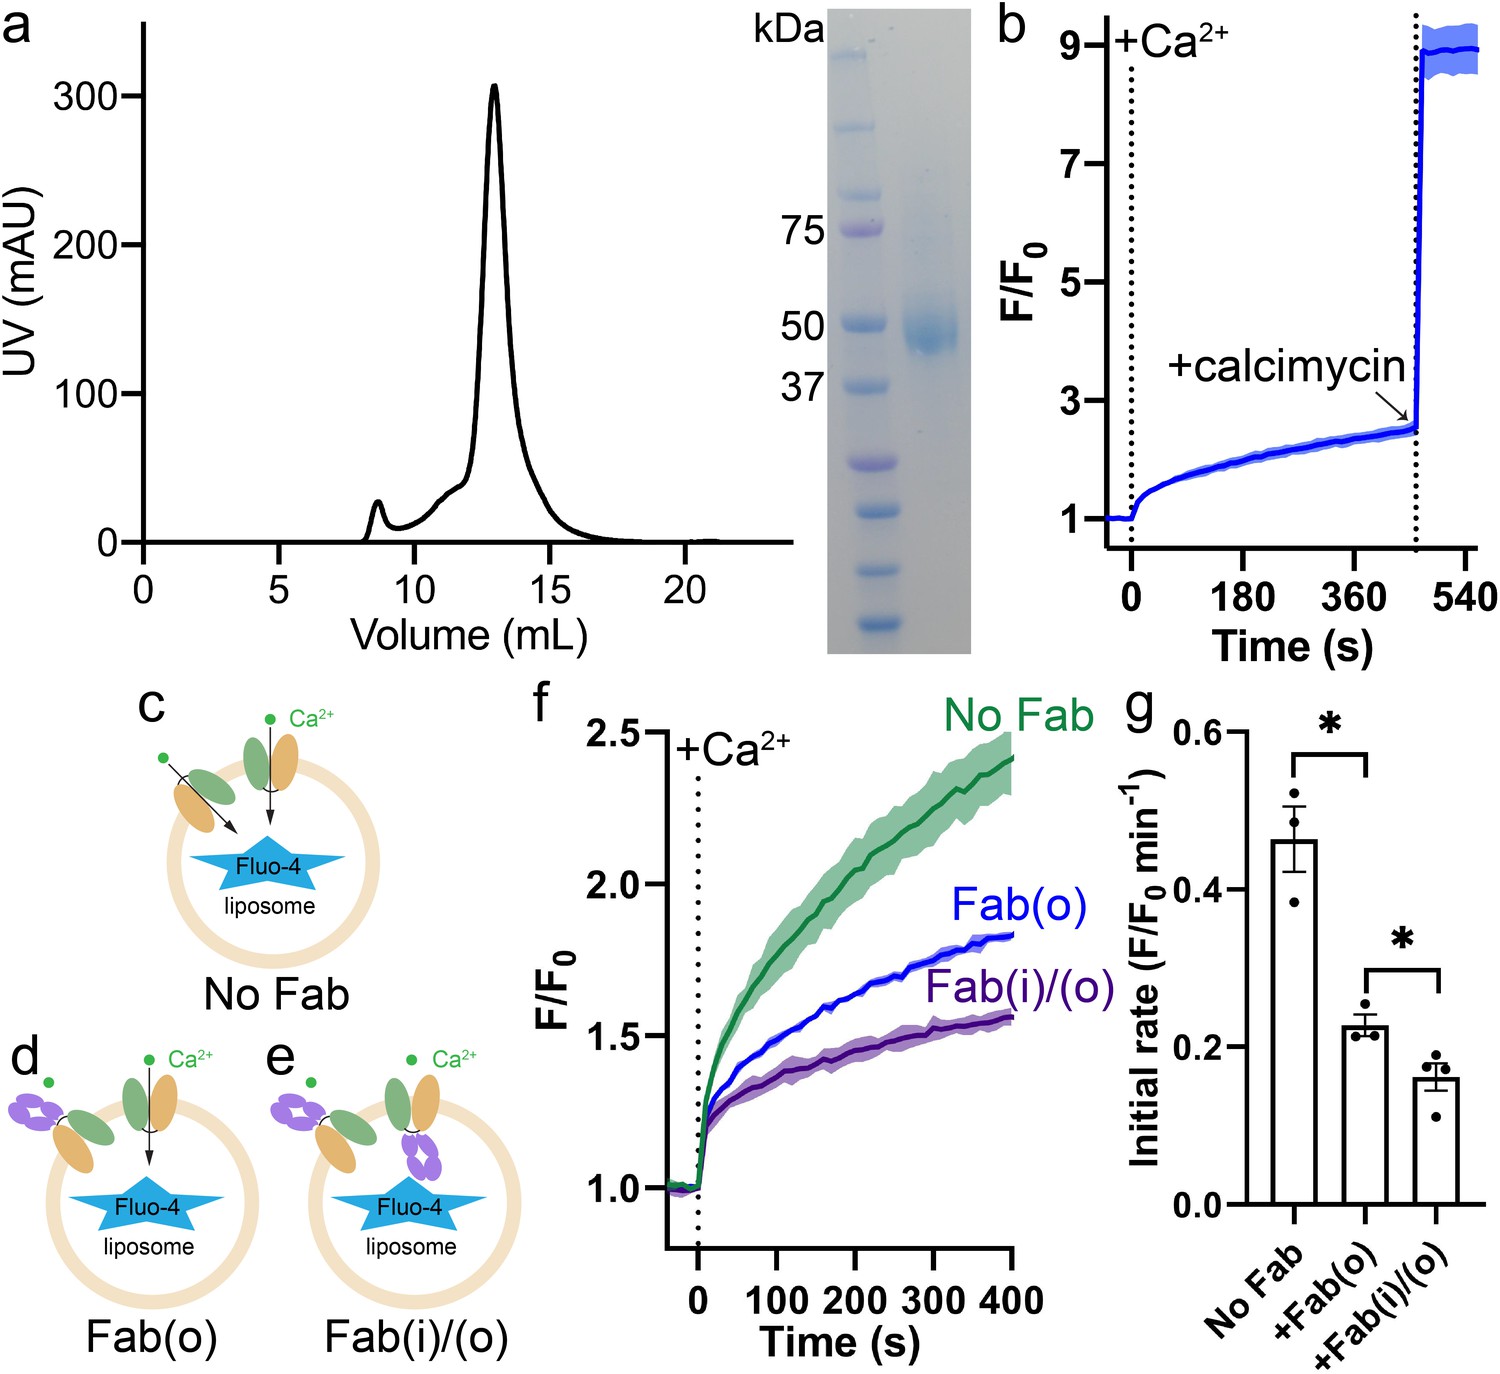
Expression of HsFpn and validation of Ca2+ transport in proteoliposomes.
(a) SEC profile (left) and SDS-PAGE gel image (right) of purified HsFpn. (b) Calcimycin, a Ca2+ ionophore, collapses the Ca2+ gradient after 450 s of Ca2+ influx by Fpn in proteoliposomes. Schematics of Ca2+ transport by Fpn (pale green and light orange lobes) in proteoliposomes with (c) no Fab; (d) Fab (slate purple lobes) on the outside (o); (e) Fab on both the inside and outside (i/o). (f) Inhibition of Fpn-mediated Ca2+ influx in proteoliposomes by Fab added to different sides. (g) Comparison of initial rates of Ca2+ influx in (f). Unpaired t-test with Welch correction was used to analyze statistical significances. In (b) and (f), 500 µM of Ca2+ was added at time zero.
-
Figure 1—figure supplement 1—source data 1
Uncropped SDS-PAGE gel image of purified HsFpn.
Black dashed rectangle indicates the region of interest.
- https://cdn.elifesciences.org/articles/82947/elife-82947-fig1-figsupp1-data1-v2.zip
Figure 1—figure supplement 2
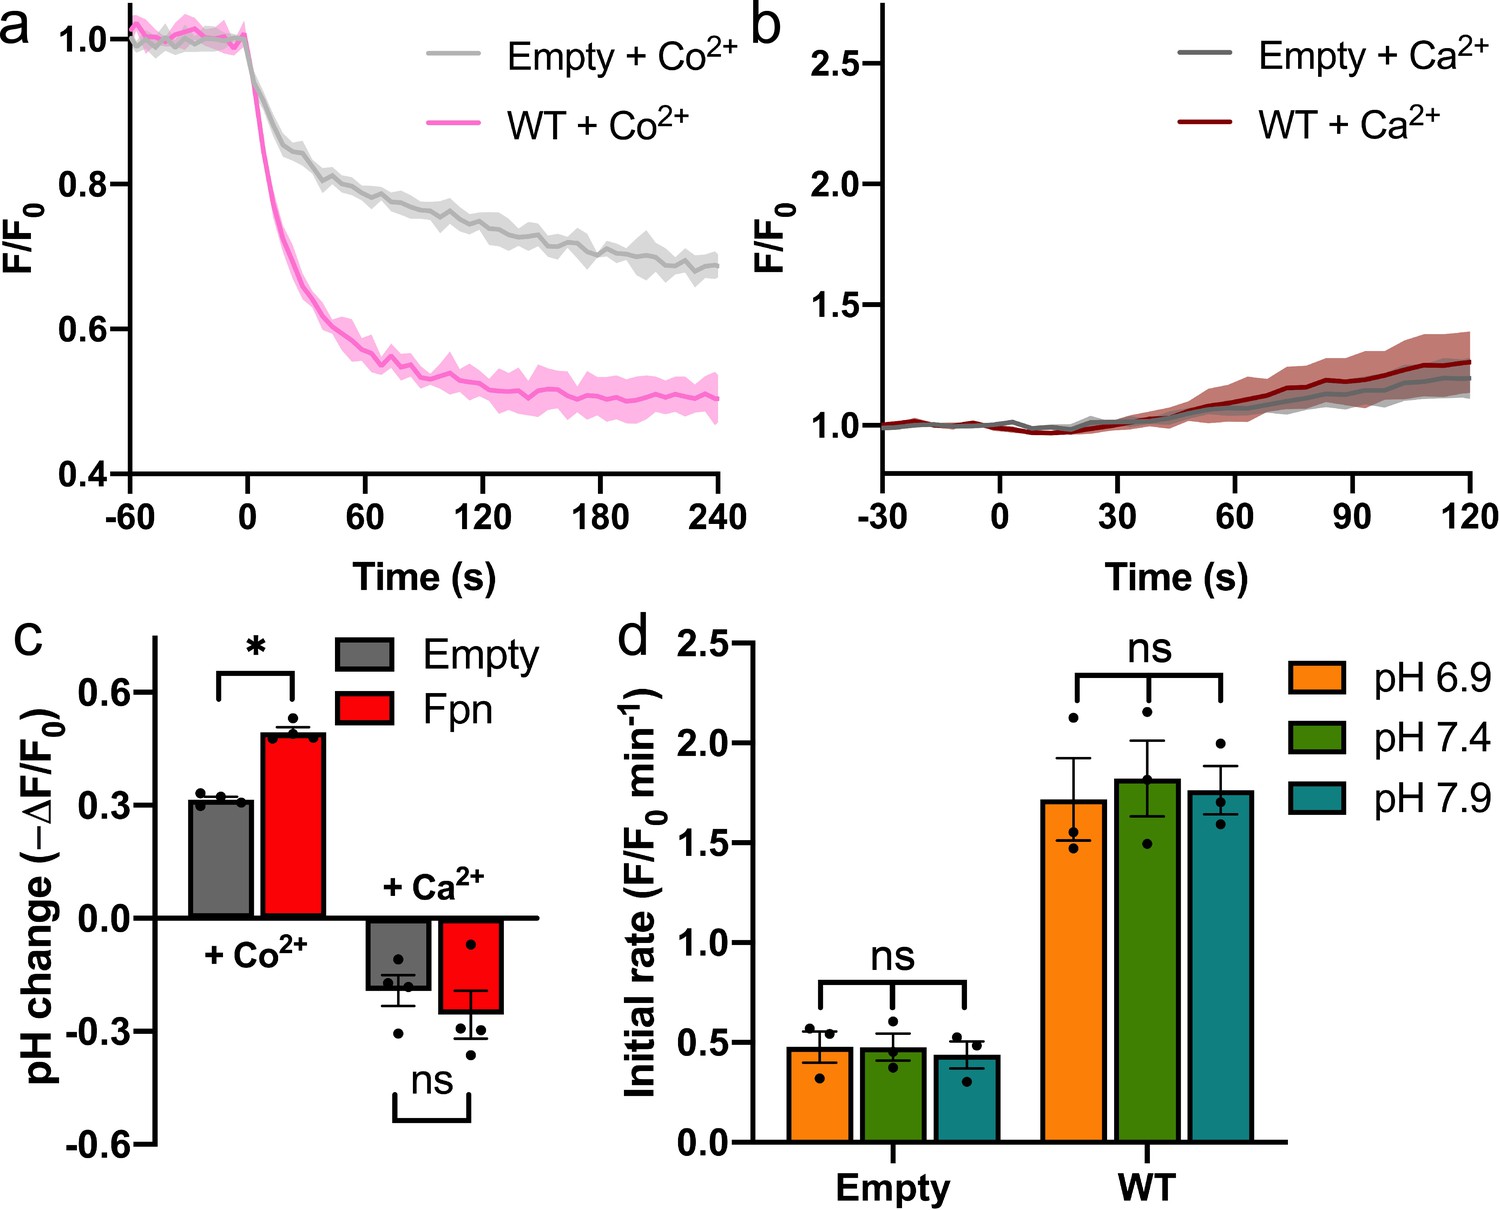
H+-independent Ca2+ uptake by HsFpn in HEK cells.
Intracellular pH change induced by addition of Co2+ (a) or Ca2+ (b) on the extracellular side monitored by a pH-sensitive dye (pHrodo Red). (c) Comparison of cytosolic pH changes induced by the Co2+ or Ca2+ uptake. The mean final fluorescence changes from the traces in (a) and (b) are plotted. Decreased relative fluorescence (ΔF/F0) correlates to increased pH. Sidak’s multiple comparisons test was used following two-way ANOVA. (d) Ca2+ transport rates at different extracellular pHs. Two-way ANOVA: among different pHs, p=0.912; between empty and WT, p<0.0001; interaction, p=0.918.
Figure 1—figure supplement 3
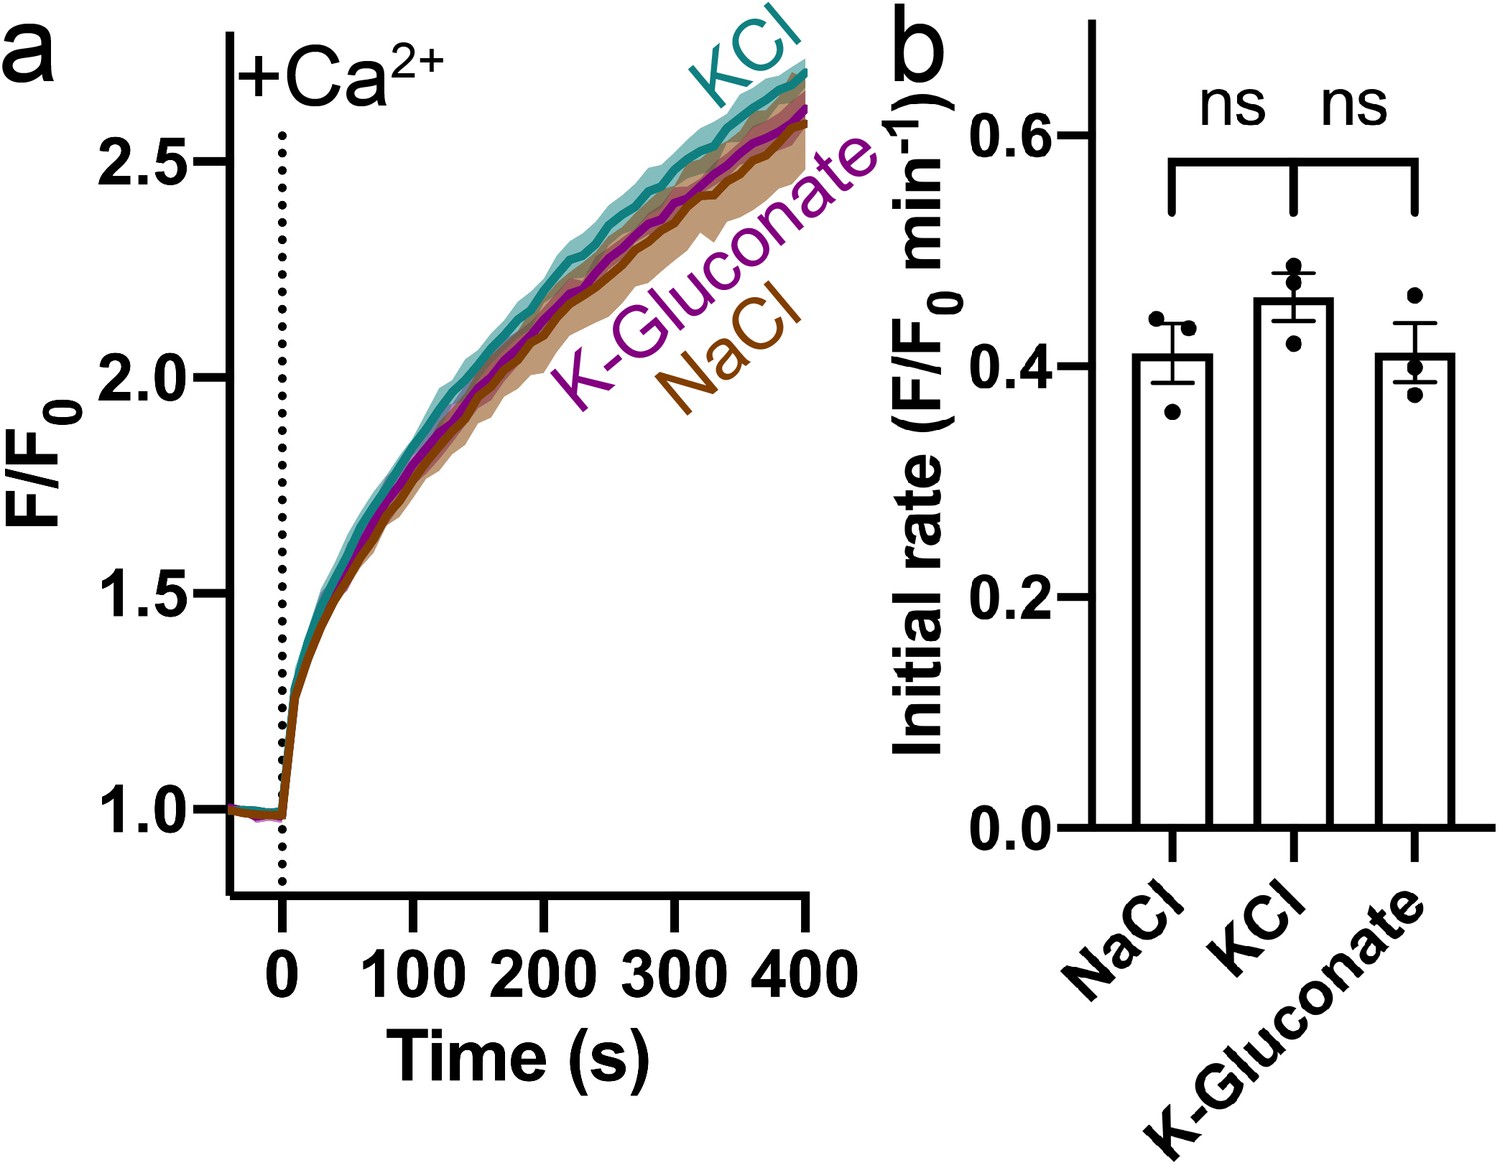
Effect of Na+, K+, and Cl- on Ca2+ transport by HsFpn.
(a) Ca2+ influx in proteoliposomes with symmetrical NaCl, KCl, and K-Gluconate. 500 µM Ca2+ was added at time zero. (b) Comparison of initial rates of Ca2+ transport in different salts. Statistical significances were analyzed with one-way ANOVA.
Figure 1—figure supplement 4
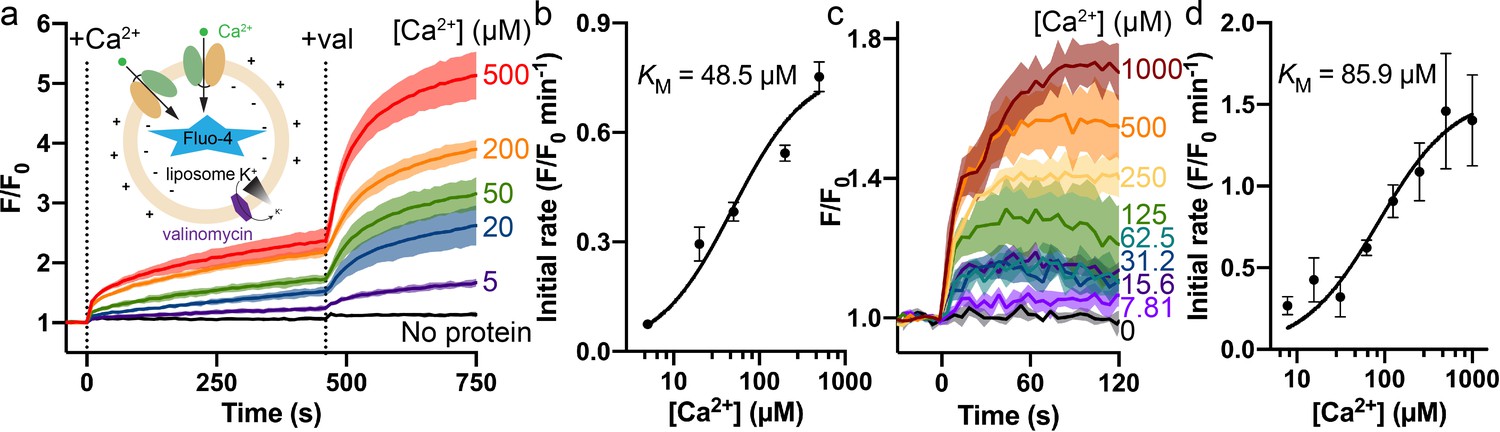
Dose-dependent Ca2+ transport by Fpn.
(a) Ca2+ transport into liposome with purified Fpn monitored by impermeable Fluo-4. Different concentrations of Ca2+ (labeled to the right of each trace) were added followed by the addition of valinomycin (val) to clamp membrane potential. The time points for the addition of Ca2+ or valinomycin are indicated by vertical dashed lines. For the ‘No protein’ control, 500 µM Ca2+ was used. The inset shows the schematic of the proteoliposomes with a 100:1 inside:outside K+ gradient. (b) Initial rates of fluorescence change after the addition of valinomycin versus concentrations of Ca2+ for data in (a). (c) Dose-dependent Fpn-specific Ca2+ uptake in HEK cells expressing Fpn measured by Fluo-4 loaded inside cells. The raw traces of the empty control group at a certain [Ca2+] were subtracted from the corresponding traces of the Fpn WT group. (d) Initial rates of fluorescence change versus concentrations of Ca2+ in HEK cells. The black solid lines in (b) and (d) are curve fits to a Michaelis–Menten equation.
Figure 2 with 3 supplements
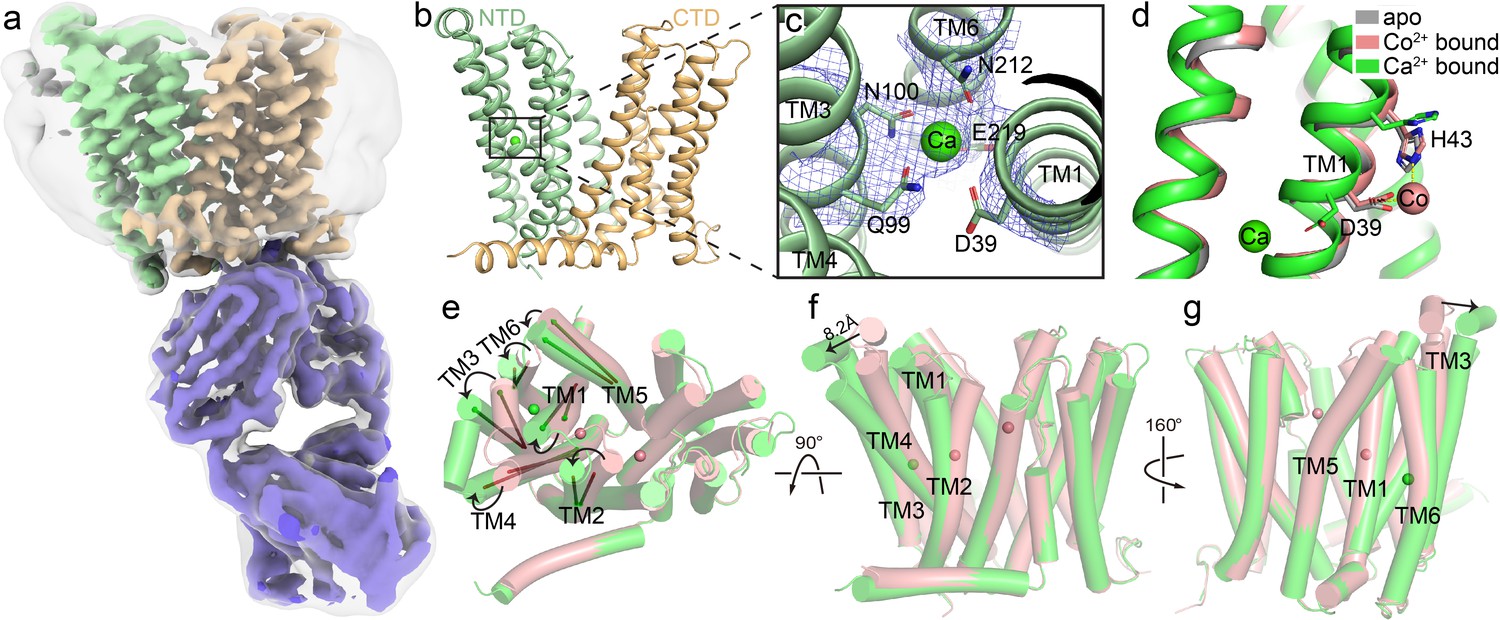
Structure of HsFpn bound to Ca2+.
(a) Cryo-EM map of HsFpn in complex with 11F9 in the presence of Ca2+. Densities for NTD, CTD, and 11F9 are colored in pale green, light orange, and slate purple, respectively. A smoothened map contoured at a low threshold (translucent grey) is overlaid to show the lipid nanodisc density around Fpn. (b) Structure of HsFpn with a bound Ca2+ in an outward-facing conformation. NTD and CTD are colored as described in (a). Ca2+ is shown as a green sphere. (c) Zoomed-in view of the Ca2+ binding site in the NTD. The five residues coordinating Ca2+ are labeled and shown as side chain sticks. The density for Ca2+ is contoured at 7.5σ as blue mesh. (d) Structural comparison of apo (grey, PDB ID 6W4S), Co2+-bound (pink, PDB ID 8DL8), and Ca2+-bound (green) HsFpn near S1. The side chains of D39 and H43 are shown as sticks. Co2+ is shown as a pink sphere. (e), (f), and (g) Three views of conformational changes in NTD induced by Ca2+ binding. The Co2+-bound (pink) and Ca2+-bound (green) structures are aligned and shown as cartoon with cylindrical helices. (e) Top view (from the extracellular side) of the alignment. The helical directions of TM1-6 are visualized by vectors inside cylinders, and the bending of these helices is indicated by black arrows. Bending of TMs viewed from the front (f) and the back (g). The displacement of the extracellular loop between TM3 and TM4 is marked with a black arrow and distance.
Figure 2—figure supplement 1
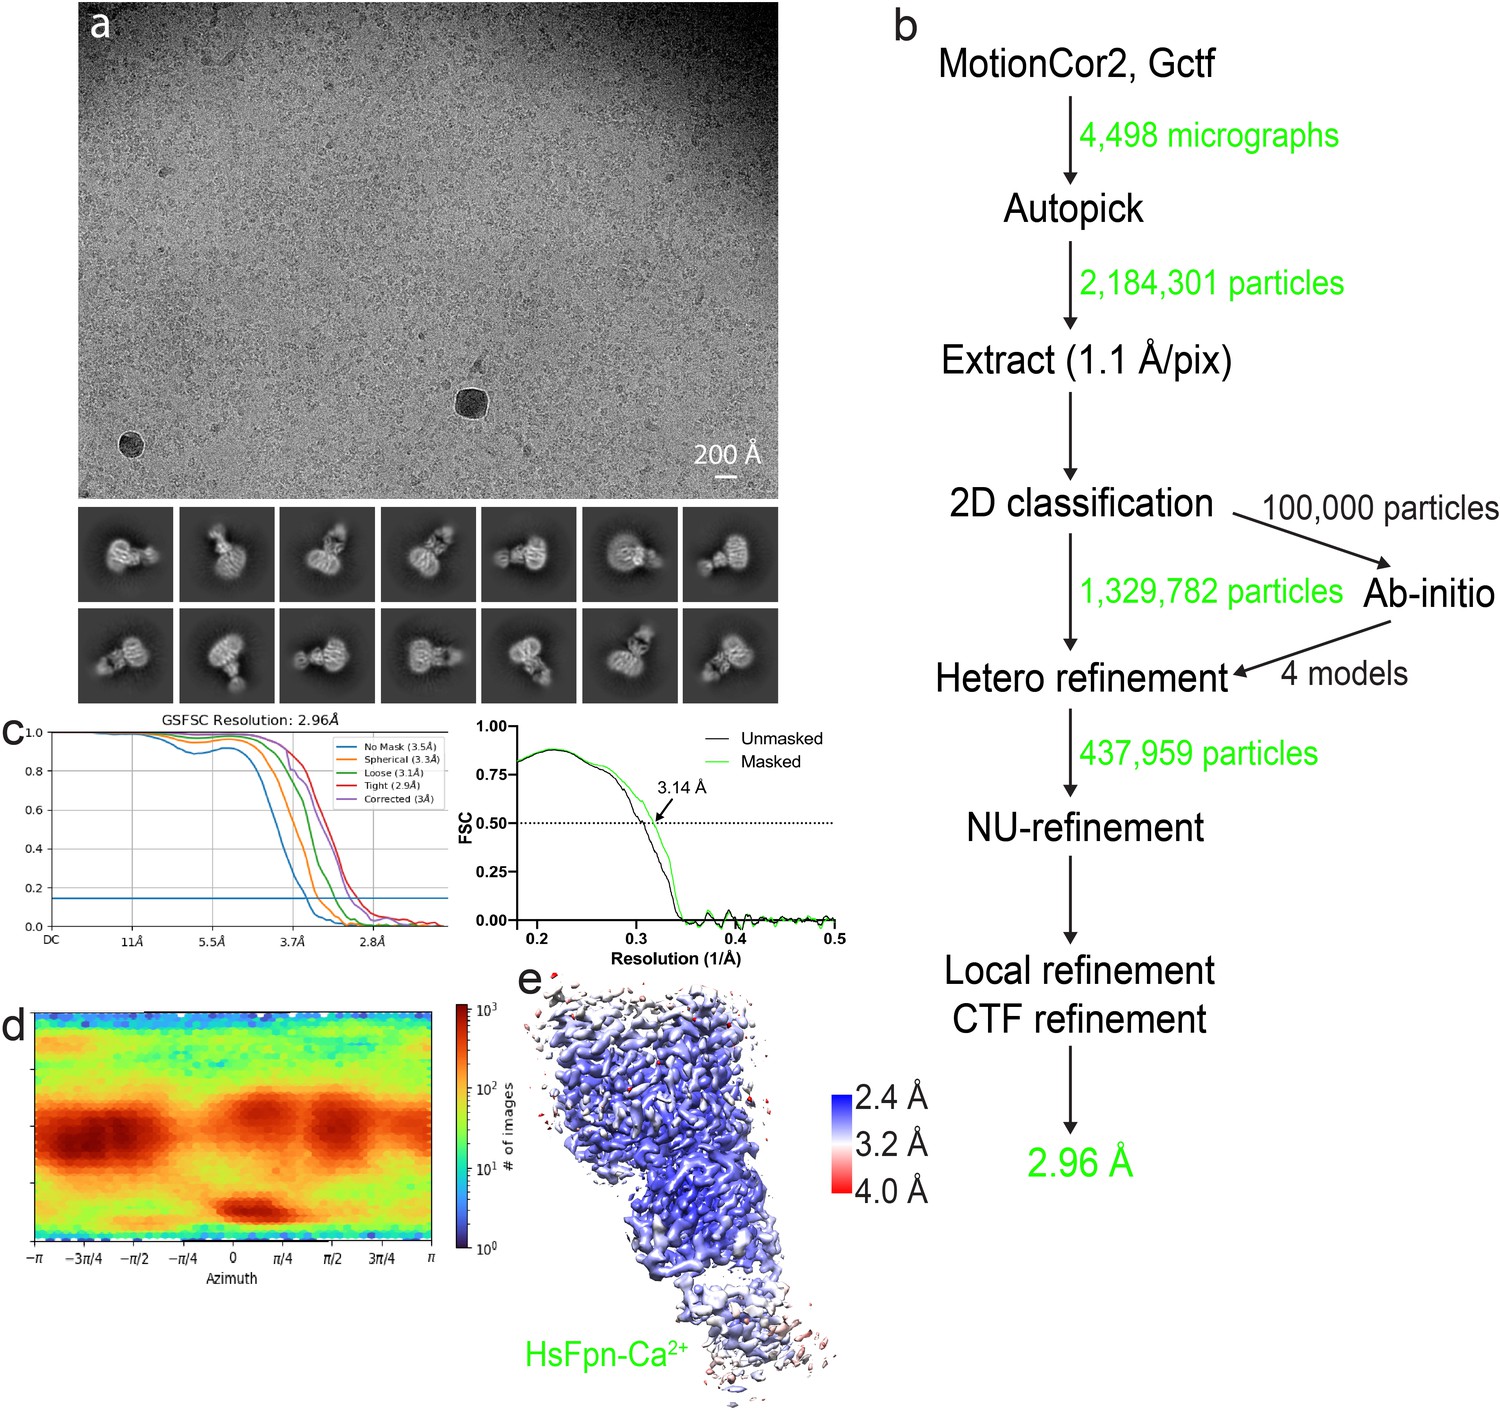
Cryo-EM analysis of HsFpn-Ca2+ in nanodisc.
(a) Representative electron micrograph (upper panel) and 2D class averages (lower panel). (b) Workflow of single-particle data processing. (c) The gold-standard Fourier shell correlation (FSC) curves (left panel) and map-to-model FSC curves (right panel). (d) Direction distribution of particles used in the final 3D reconstruction. (e) Local resolution map.
Figure 2—figure supplement 2
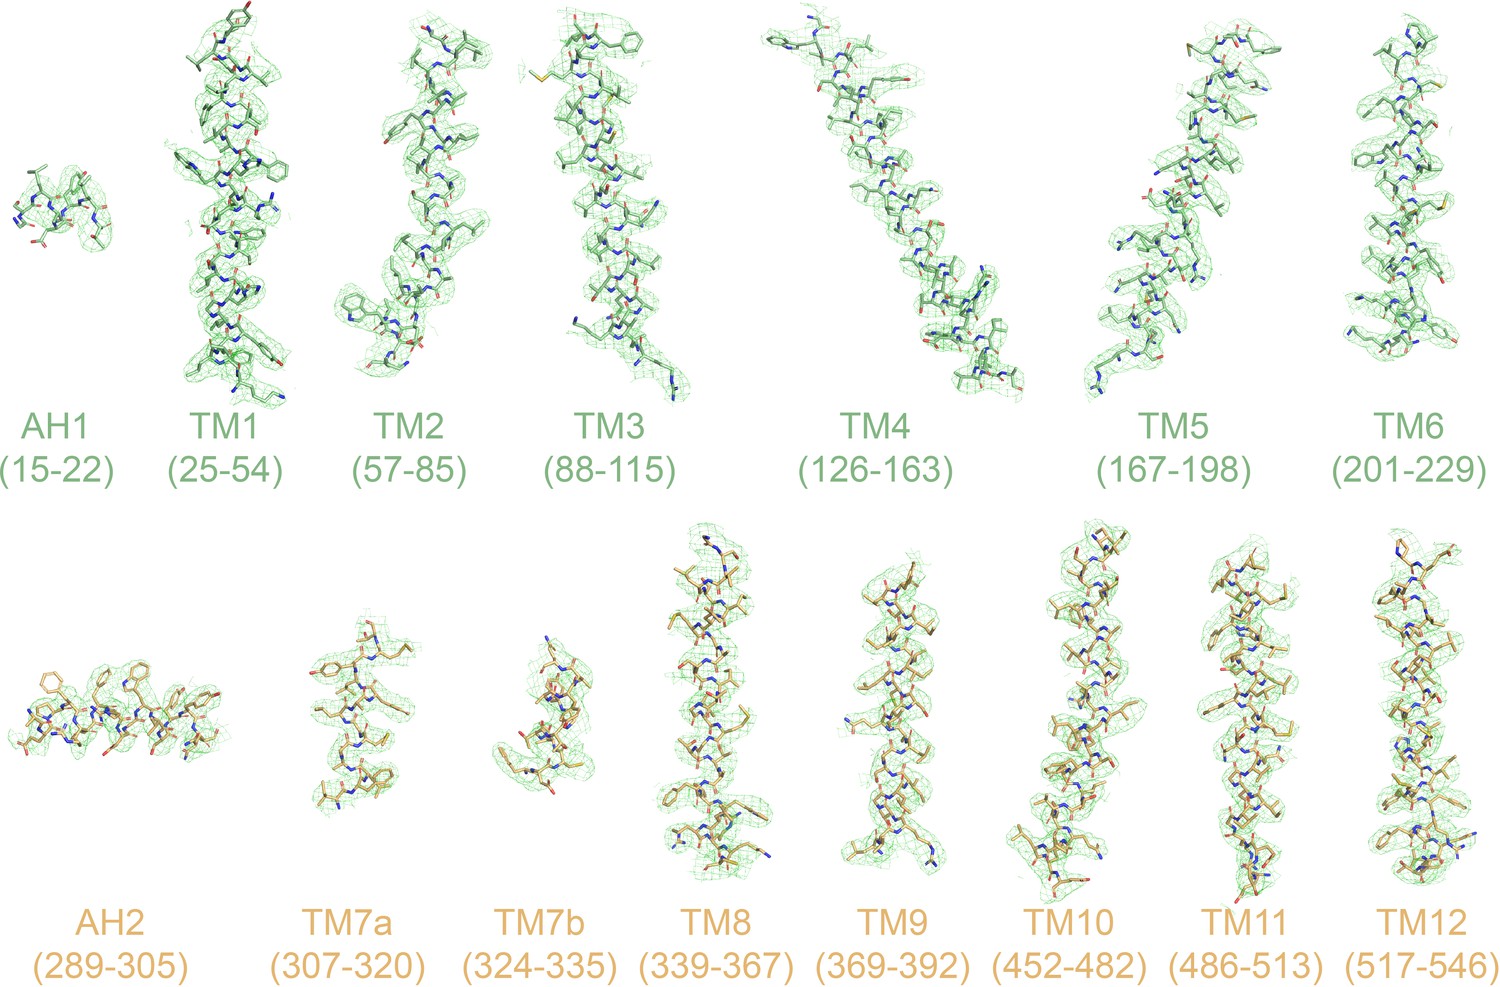
Cryo-EM densities of TM helices and amphipathic helices (AH).
Densities for HsFpn-Ca2+ are shown as green mesh. Residues within the ranges indicated below are rendered in stick representation and colored in pale green for NTD or light orange for CTD.
Figure 2—figure supplement 3

Structural comparisons of Ca2+-bound HsFpn.
(a) Differences in Ca2+ coordination by HsFpn (green) and by BbFpn (deep blue, PDB ID 6BTX). (b) Comparison of Ca2+-bound (green) versus hepcidin-bound (deep purple, PDB ID 6WBV) structure of HsFpn shows further outward movements of NTD. Displacement of the loop between TM3 and TM4 is marked with an arrow and distance. Co2+ ions in the Fpn-hepcidin structure are shown as deep purple spheres.
Figure 3 with 3 supplements
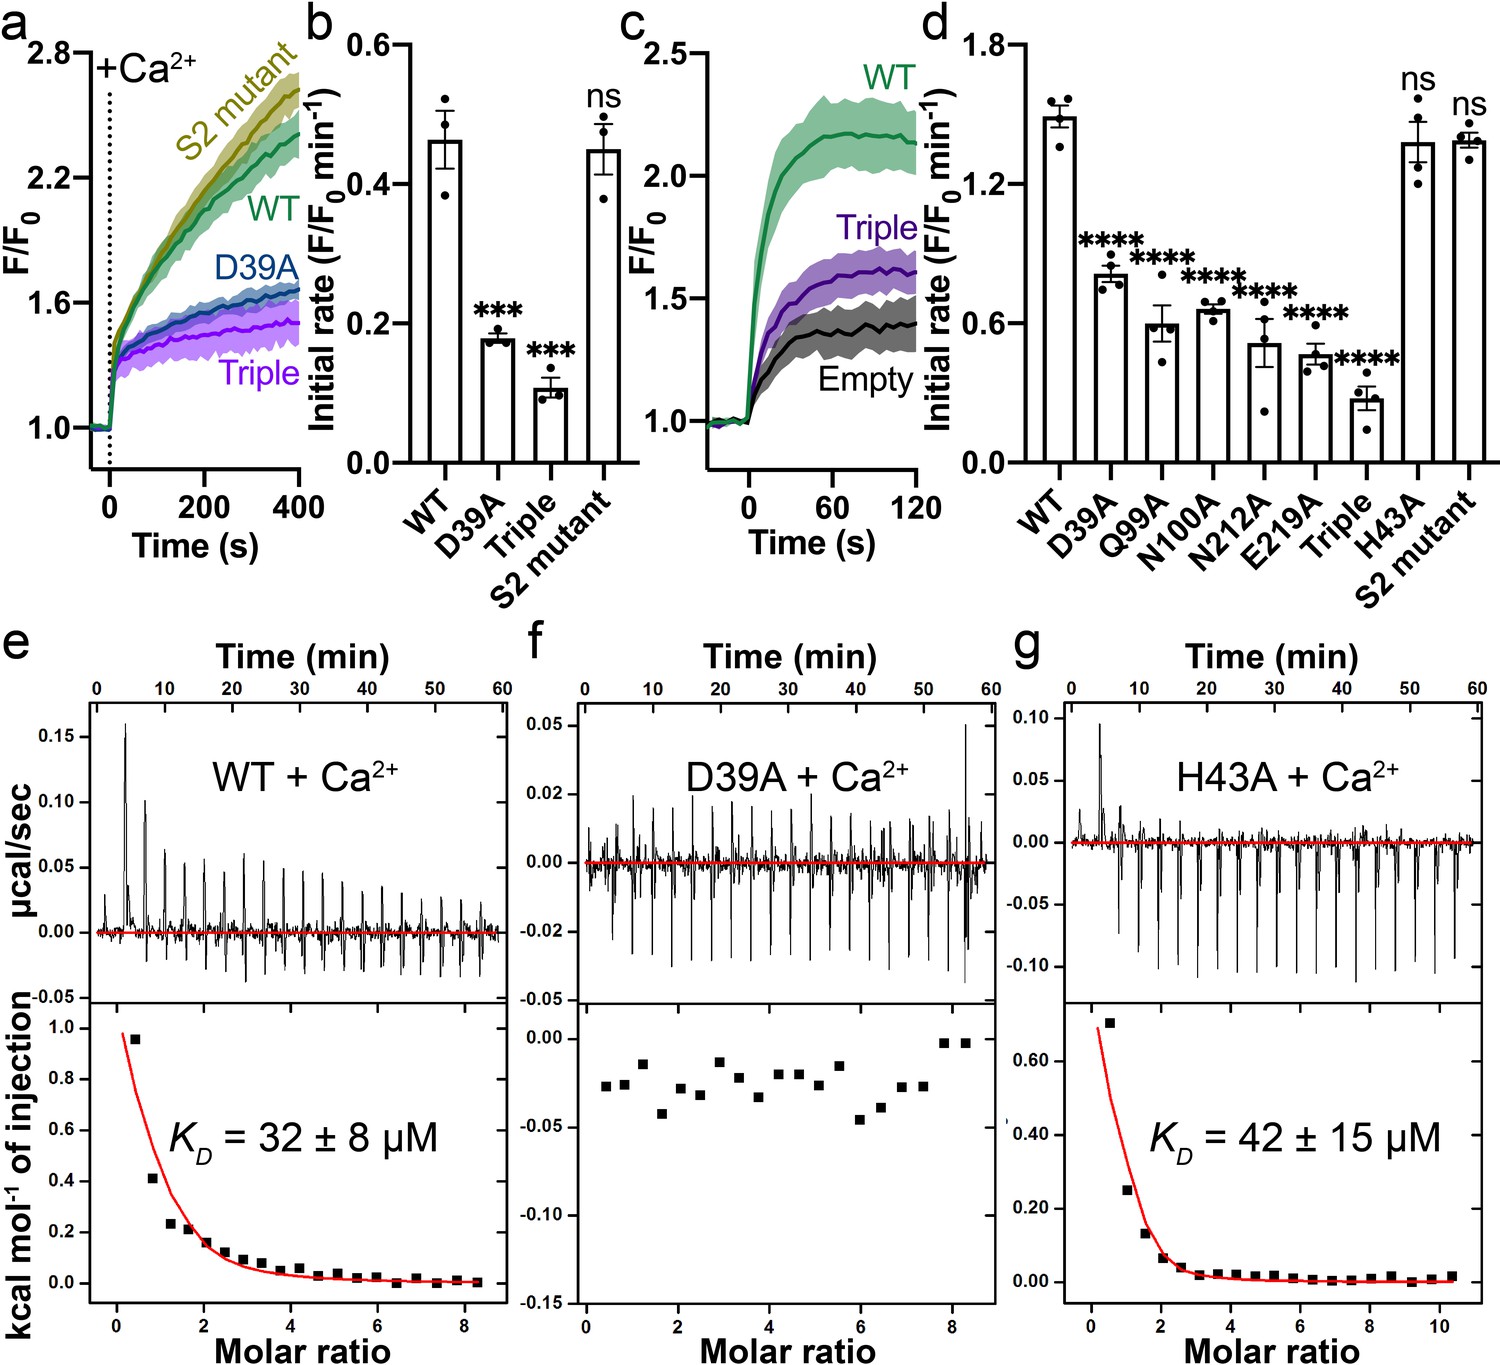
Mutations on the Ca2+ binding site.
(a) Ca2+ influx by WT (green), D39A (blue), and the triple mutant (Q99A_N100A_E219A, purple) of the Ca2+ binding site in proteoliposomes. (b) Comparison of initial rates of Ca2+ influx in (a). (c) Ca2+ uptake in HEK cells expressing WT (green) or the triple mutant (purple) Fpn. (d) Fpn-specific Ca2+ transport activities of WT and mutants. Initial rates are subtracted from the empty control. For statistical significances in (b) and (d), Dunnett’s test was used as a post hoc test following one-way ANOVA with the WT as the control. 500 µM Ca2+ was used in (a–d). Binding of Ca2+ to WT (e), D39A (f), and H43A (g) HsFpn measured by ITC. Upper plot: raw thermogram showing the heat during binding and baseline (red line). Lower plot: integrated heat of each injection (black square) and the fit of data (red line).
Figure 3—figure supplement 1
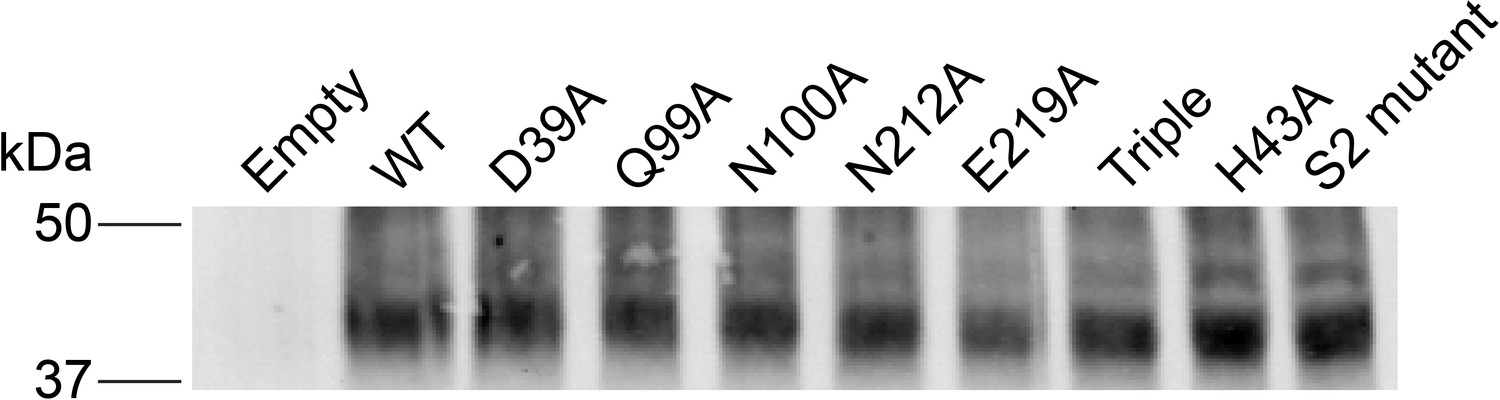
Expression of WT and mutant Fpns in HEK cells assessed by western blot.
-
Figure 3—figure supplement 1—source data 1
Uncropped western blot image of Fpn expressed in HEK cells.
Black dashed rectangle indicates the region of interest.
- https://cdn.elifesciences.org/articles/82947/elife-82947-fig3-figsupp1-data1-v2.zip
Figure 3—figure supplement 2
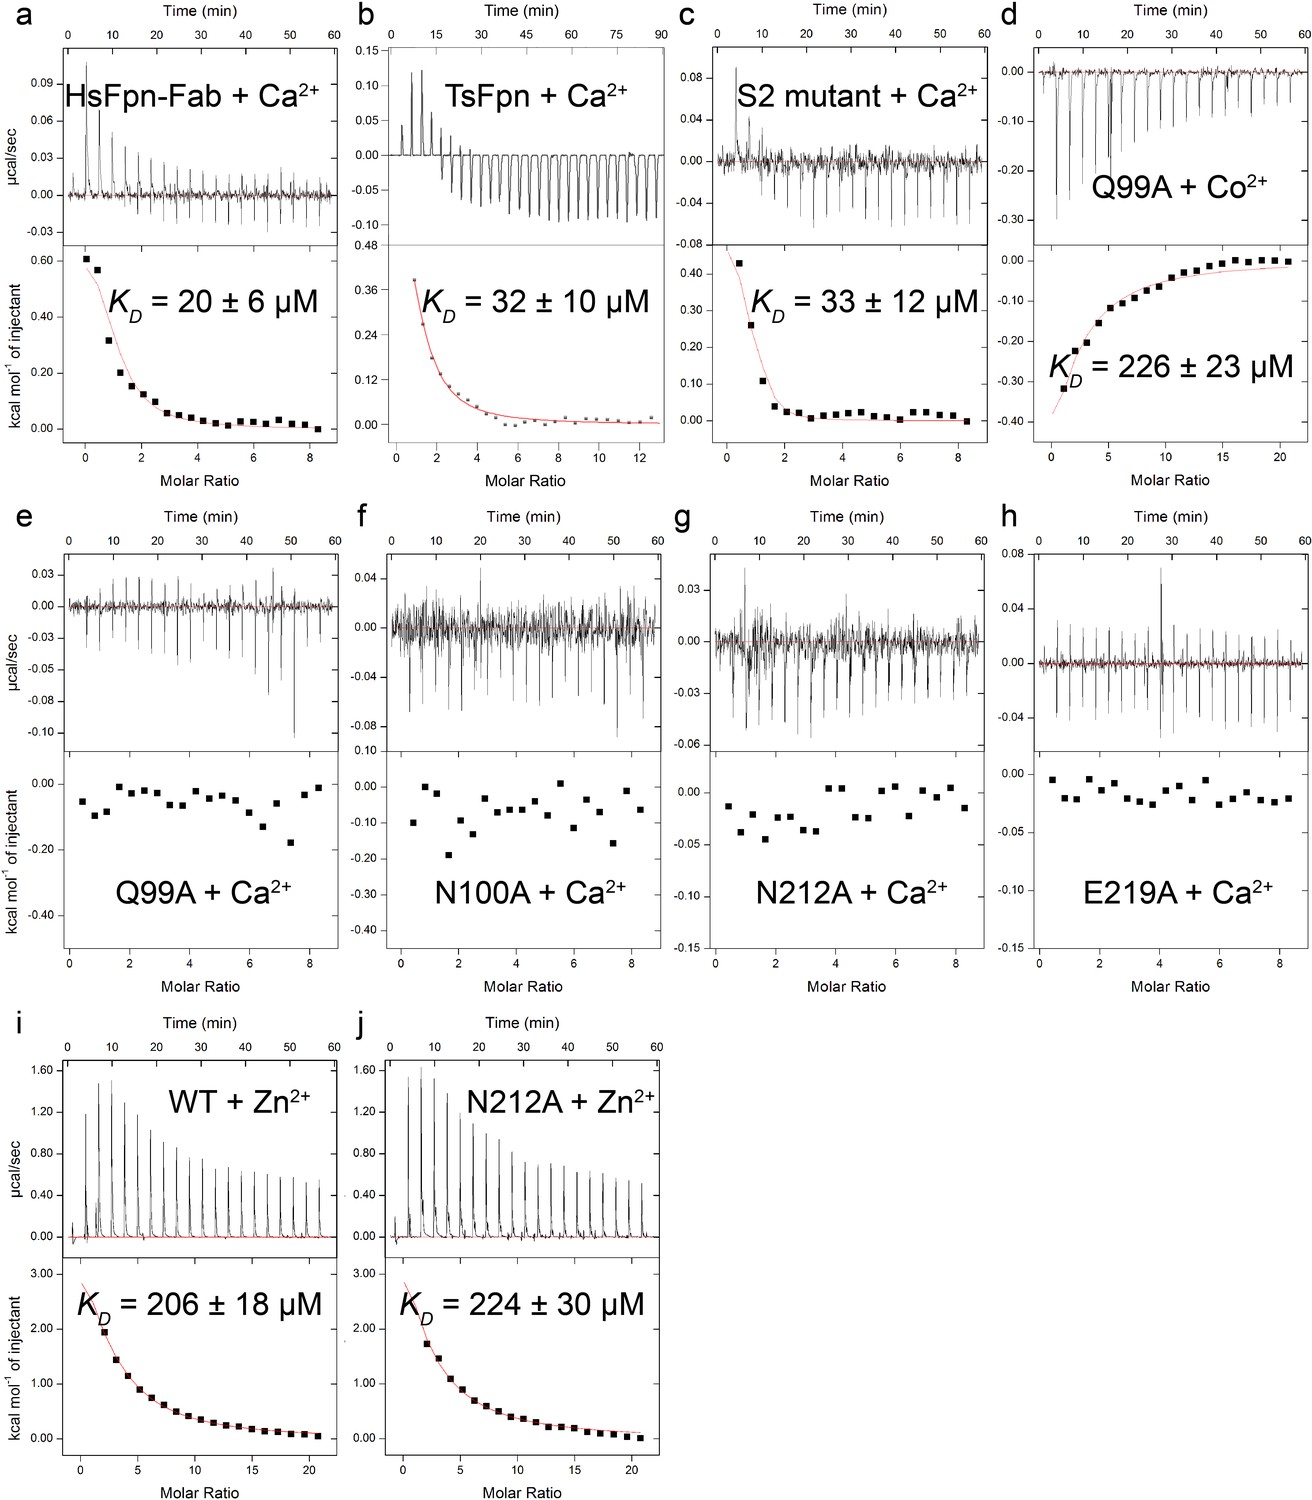
Binding of Ca2+, Co2+, or Zn2+ to WT and mutant Fpns measured by ITC.
Binding of Ca2+ to HsFpn-11F9 complex (a), TsFpn (b), and S2 mutant (c). (d) Binding of Co2+ to the alanine mutant of Q99 in the Ca2+ binding site. Titration of Ca2+ into the alanine mutants of Q99 (e), N100 (f), N212 (g), and E219 (h) in the Ca2+ binding site. Binding of Zn2+ to WT (i) and the alanine mutant of N212 (j) in the Ca2+ binding site.
Figure 3—figure supplement 3

Effect of D39A on Co2+ transport by Fpn.
(a) Co2+ influx in proteoliposomes with symmetrical NaCl buffer. 500 µM Co2+ was added at time zero. (b) Comparison of initial rates of Co2+ transport. Statistical significances were analyzed with unpaired t-test with Welch correction.
Figure 4 with 3 supplements
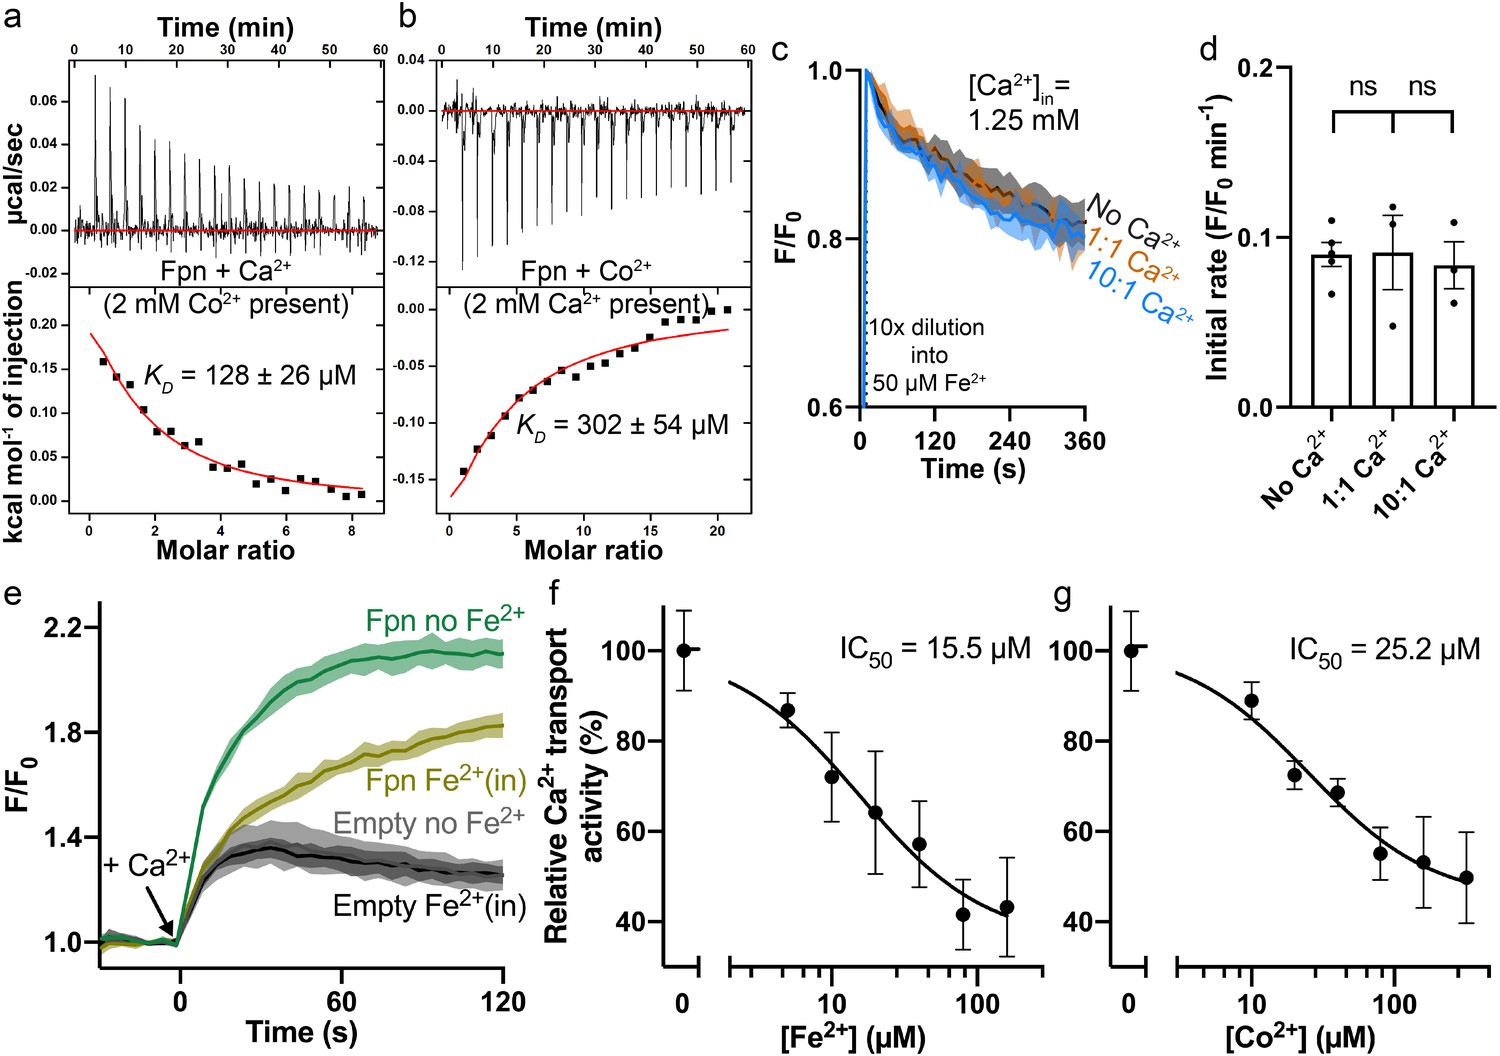
Interplay between Fe2+/Co2+ and Ca2+ in HsFpn.
(a) Ca2+ binding in the presence of 2 mM Co2+. (b) Co2+ binding in the presence of 2 mM Ca2+. (c) Fe2+ transport into proteoliposomes in the presence or absence of Ca2+. The external [Fe2+] is 50 µM. ‘1:1’ indicates symmetrical [Ca2+] at 1.25 mM and “10:1” indicates 1.25 mM Ca2+ inside and 0.125 mM Ca2+ outside. 1 mM sodium ascorbate was included in all samples. All fluorescence traces are subtracted from corresponding blank controls using vesicles with no HsFpn. (d) Comparison of initial rates of Fe2+ transport in (c). One-way ANOVA was used for statistical analysis. (e) Ca2+ (1 mM) uptake by HEK cells expressing HsFpn in the presence (dark yellow) or absence (green) of 80 µM Fe2+ that has been pre-loaded into the cells. Uptake is monitored by jGCaMP7s which is co-expressed in cytosol. Cells transfected with an empty vector (dark and light gray) serve as negative controls. Ca2+ transport at different concentrations of Fe2+ (f) or Co2+ (g). Normalized initial rates of Fpn-specific Ca2+ uptake were used to represent relative Ca2+ transport activities. Data were fitted (black solid line) to an inhibitory dose-response equation to calculate IC50 values.
Figure 4—figure supplement 1
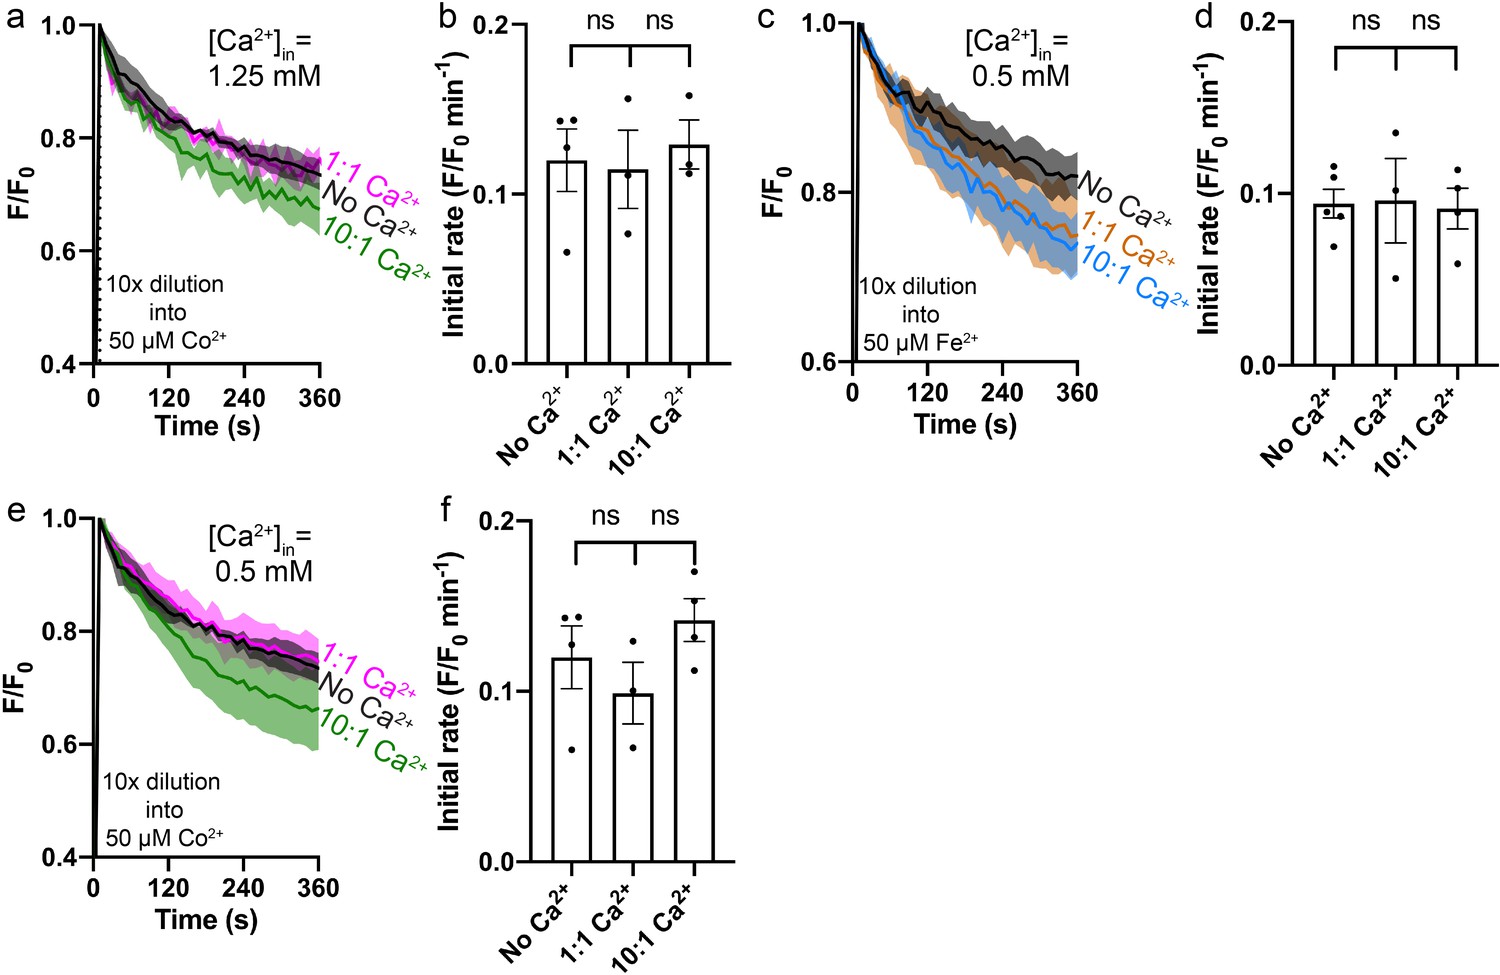
Fe2+/Co2+ transport into proteoliposomes by Fpn in the presence or absence of Ca2+.
(a) Co2+ transport with or without 1.25 mM of intra-vesicular Ca2+. (c) Fe2+ transport with or without 0.5 mM of intra-vesicular Ca2+. (e) Co2+ transport with or without 0.5 mM of intra-vesicular Ca2+. (b), (d), and (f) Comparison of initial rates in (a), (c), and (e). Liposome samples were diluted (10×) into outside buffers containing 50 µM Co2+ or Fe2+. ‘1:1’ or ‘10:1’ denotes the ratio of [Ca2+] inside:outside achieved after 10×dilution. 1 mM sodium ascorbate was included in (c). All fluorescence traces were subtracted from their corresponding no protein controls. One-way ANOVA was used for statistical analysis.
Figure 4—figure supplement 2

Ca2+ transport in the presence of Fe2+ or Co2+ in HEK cells.
(a) Schematic of the Ca2+ transport assay in Fe2+-loaded HEK cells co-expressing Fpn and the Ca2+ sensor jGCaMP7s. (b) Transition metal ions do not interact with jGCaMP7s as indicated by unaltered fluorescence readings during loading of Fe2+ (top) or Co2+ (bottom) into HEK cells expressing Fpn (orange or pink traces) or transfected with empty vectors (gray traces). Black arrows indicate additions of metal ions. (c) Ca2+ transport at different extracellular pHs in the presence of 20 µM Co2+. Two-way ANOVA: among different pHs, p=0.717; among empty, WT, and S2 mutant, p<0.0001; interaction, p=0.130. (d) and (e) Fpn-specific Ca2+ transport in the presence of Fe2+ or Co2+ loaded inside HEK cells. The concentrations of Fe2+ or Co2+ used during the loading step are indicated to the right of each trace. The Fe2+ stock was prepared with a 10-fold molar excess of sodium ascorbate. The raw traces of the empty control group were subtracted from the corresponding traces of the Fpn WT group. Normalized initial rates calculated from the datasets are shown in Figure 4f–g.
Figure 4—figure supplement 3
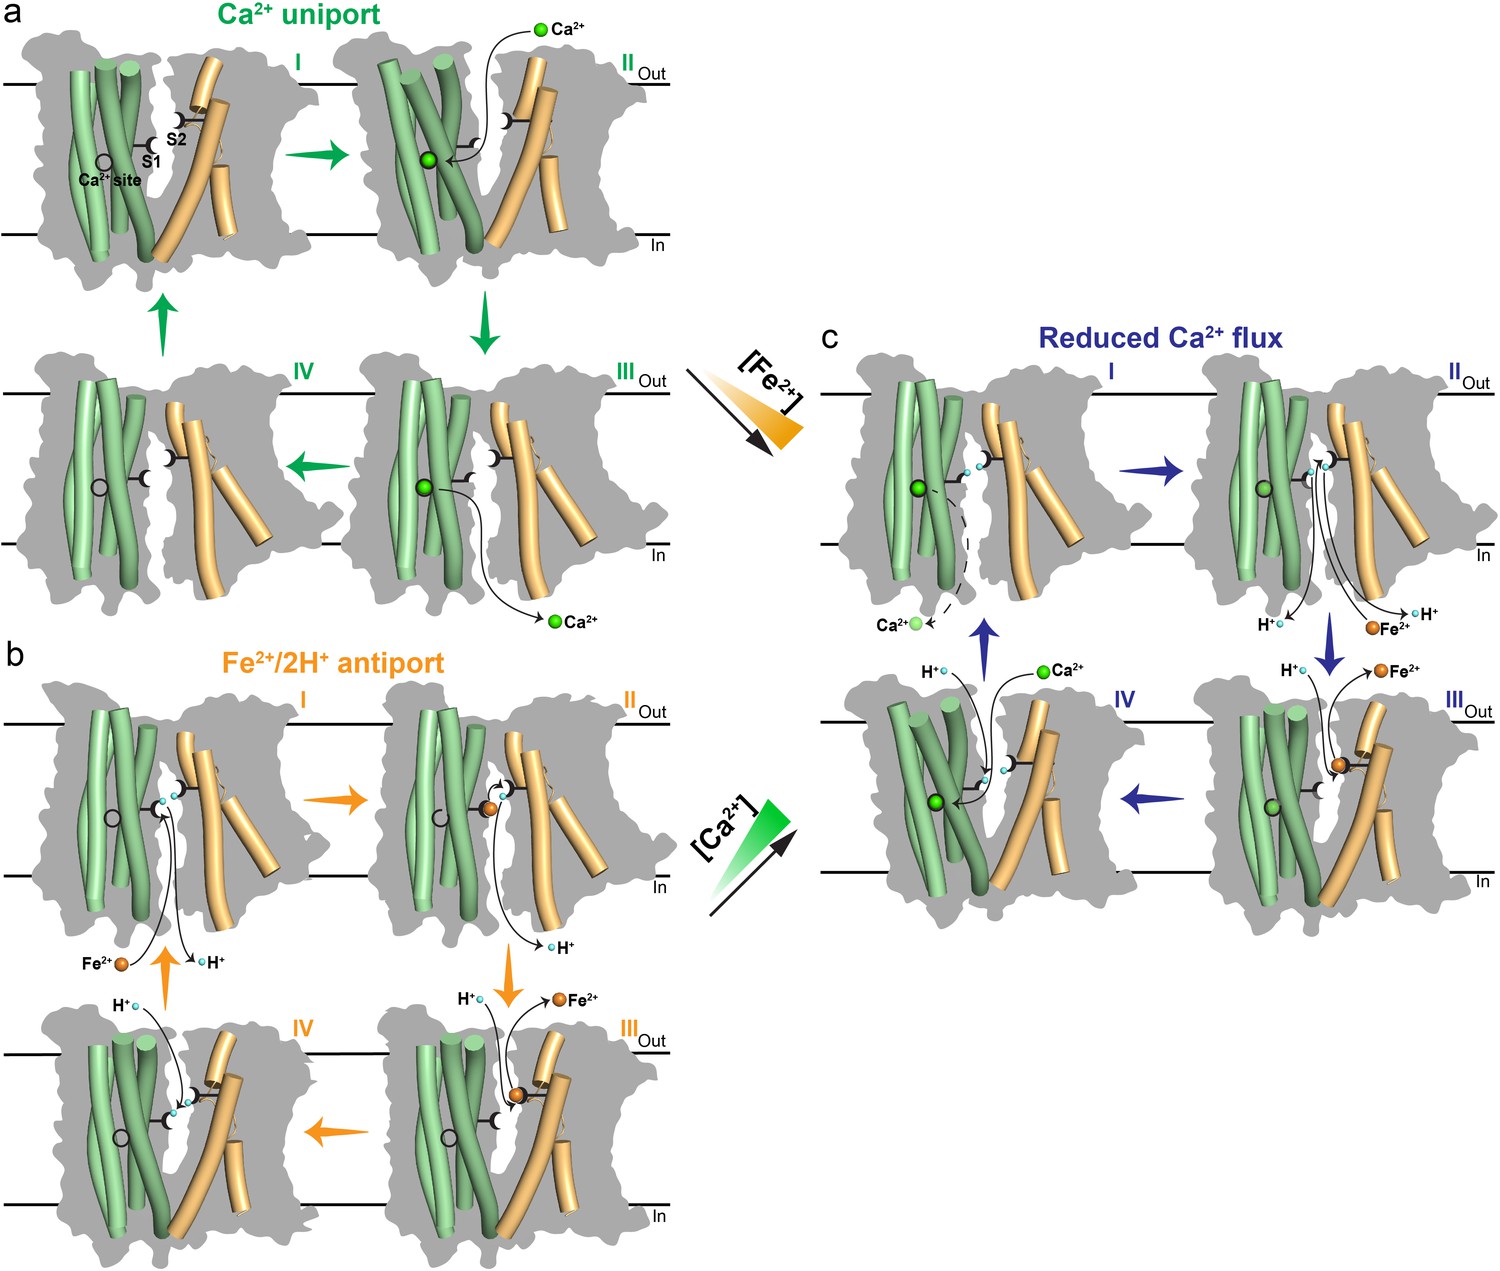
Proposed transport mechanisms of metal ions in Fpn.
(a) Electrogenic Ca2+ uniport in the absence of Fe2+. (b) Electroneutral Fe2+/2H+ antiport in the absence of Ca2+. (c) Reduced Ca2+ flux in the presence of Fe2+. Higher concentration of Fe2+ (orange ramp) shows larger inhibition on Ca2+ transport. The inward-facing model is generated based on the bacterial homolog structure (PDB ID 6BTX). The four-helical bundle (pale green) in NTD, and TM7 and TM11 (light orange) in CTD are shown as cylinders and overlaid on silhouettes (grey) of the whole transporter. S1 and S2 of Fe2+ are indicated as black forks with two tines to represent two ligand residues in each site. The Ca2+ binding site is indicated as a black circle. When Fe2+ is bound to S1, the Ca2+ binding site is drawn as an incomplete circle to indicate its partial disruption. Similarly, the S1 becomes a half fork when Ca2+ is bound. H+ (blue), Fe2+ (orange), and Ca2+ (green) are shown as spheres. The black dashed line and shaded green spheres of Ca2+ in (c) indicate reduced Ca2+ release and occupancy.
Author response image 1
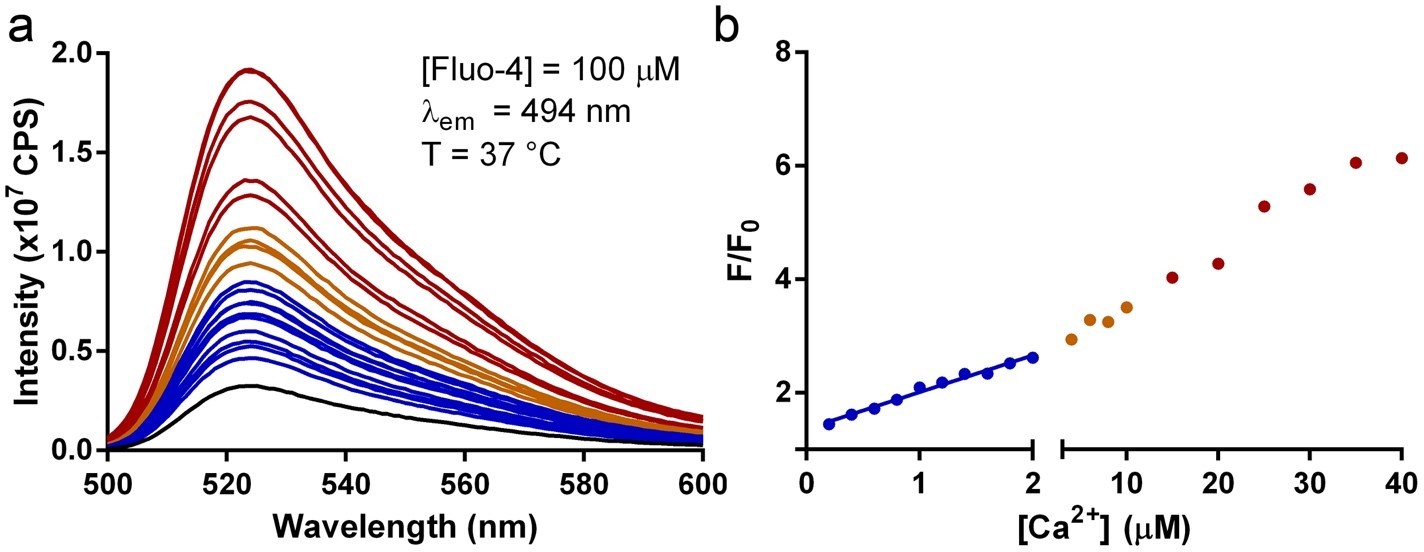
Titration of Ca2+ to Fluo-4 used in liposome transport assays.
(a) Emission spectra of 100 µM Fluo-4 in the inside buffer at 37 °C titrated with increasing [Ca2+] (from blue to red). (b) Correlation of F/F0 to [Ca2+]. The blue line is the linear fit to data in the region of [Ca2+] within 2 µM.
Tables
Table 1
Summary of cryo-EM data collection, processing, and refinement.
| Sample | HsFpn-Ca2+–11 F9 |
|---|---|
| Cryo-EM data collection | |
| Voltage (kV) | 300 |
| Magnification (×) | 81,000 |
| Pixel Size (Å) | 1.10 |
| Electron exposure (e-/Å2/frame) | 1.25 |
| Defocus range (µm) | [-2.5,–0.8] |
| Number of image stacks | 4,498 |
| Number of frames per stack | 40 |
| Cryo-EM data processing | |
| Initial number of particles | 2,184,301 |
| Final number of particles | 437,959 |
| Symmetry imposed | C1 |
| Map resolution (Å) | 3.0 |
| Map resolution range (Å) | 2.4–3.6 |
| FSC threshold | 0.143 |
| Model refinement | |
| Number of amino acids | 875 |
| Total non-hydrogen atoms | 6,192 |
| Average B factor (Å2) | 171.4 |
| Bond length RMSD (Å) | 0.008 |
| Bond angle RMSD (°) | 0.939 |
| Ramachandran Plot | |
| Favored (%) | 93.53 |
| Allowed (%) | 6.24 |
| Outliers (%) | 0.23 |
| Rotamer outliers (%) | 1.25 |
| MolProbity Score | 1.98 |
Key resources table
| Reagent type (species) or resource | Designation | Source or reference | Identifiers | Additional information |
|---|---|---|---|---|
| Chemical compound, druC | n-Dodecyl-β-D-Maltopyranoside | Anatrace | Cat#D310 | |
| Chemical compound, drug | Lauryl maltose neopentyl glycol | Anatrace | Cat#NG310 | |
| Chemical compound, drug | 1-palmitoyl-2-oleoyl-glycero-3-phosphocholine (POPC) | Avanti Polar Lipids | Cat#850457 C | |
| Chemical compound, drug | 1-palmitoyl-2-oleoyl-sn-glycero-3-phosphoethanolamine (POPE) | Avanti Polar Lipids | Cat#850457 C | |
| Chemical compound, drug | 1-palmitoyl-2-oleoyl-sn-glycero-3-phospho-(1'-rac-glycerol) (POPG) | Avanti Polar Lipids | Cat#840457 C | |
| Chemical compound, drug | Calcein | Invitrogen | Cat#C481 | |
| Chemical compound, drug | Fluo-4, Pentapotassium Salt, cell impermeant | Invitrogen | Cat#F14200 | |
| Chemical compound, drug | Valinomycin | Sigma | Cat#V0627 | |
| Peptide, recombinant protein | Hepcidin-25 (human) | Sigma | Cat#SML1118 | |
| Commercial assay, kit | TALON Metal Affinity Resin | TaKaRa | Cat#635504 | |
| Commercial assay, kit | SRT-10C SEC-300 | Sepax Technologies | Cat#239300–10030 | |
| Commercial assay, kit | Q Sepharose Fast Flow | GE Healthcare | Cat#17051010 | |
| Commercial assay, kit | Biobeads SM2 | Bio-Rad | Cat#1528920 | |
| Commercial assay, kit | PD-10 Desalting Column | GE Healthcare | Cat#17085101 | |
| Commercial assay, kit | 400 nm NanoSizer Extruder | T&T Scientific Corporation | Cat#TT-004–0010 | |
| Commercial assay, kit | KOD Hot Start DNA polymerase | Novagen | Cat#71086–3 | |
| Commercial assay, kit | Fluo-4, AM, cell permeant | Invitrogen | Cat#F14201 | |
| Commercial assay, kit | pHrodo Red AM | Invitrogen | Cat#P35372 | |
| Recombinant DNA reagent | pGP-CMV-jGCaMP7s | Addgene | Plasmid #104463 | RRID:Addgene_104463 |
| Software, algorithm | MotionCorr2 | Zheng et al., 2017 | https://msg.ucsf.edu/em/software/motioncor2.html | |
| Software, algorithm | Gctf | Zhang, 2016 | https://www.mrc-lmb.cam.ac.uk/kzhang/Gctf/ | RRID:SCR_016500 |
| Software, algorithm | Relion 3.0 | Kimanius et al., 2016 | https://www3.mrc-lmb.cam.ac.uk/relion | RRID:SCR_016274 |
| Software, algorithm | CryoSPARC | Punjani et al., 2017 | https://cryosparc.com/ | RRID:SCR_016501 |
| Software, algorithm | ChimeraX | Pettersen et al., 2021 | https://www.cgl.ucsf.edu/chimerax/ | RRID:SCR_015872 |
| Software, algorithm | COOT | Emsley et al., 2010 | https://www2.mrc-lmb.cam.ac.uk/personal/pemsley/coot/ | RRID:SCR_014222 |
| Software, algorithm | PHENIX | Adams et al., 2010 | http://www.phenix-online.org/ | RRID:SCR_014224 |
| Software, algorithm | EMringer | Barad et al., 2015 | http://fraserlab.com/2015/02/18/EMringer/ | |
| Other | Grids: R1.2/1.3 Cu 300 mesh | Quantifoil | Cat#Q325CR1.3 | Cryo-EM grid |
Additional files
Download links
A two-part list of links to download the article, or parts of the article, in various formats.
Downloads (link to download the article as PDF)
Open citations (links to open the citations from this article in various online reference manager services)
Cite this article (links to download the citations from this article in formats compatible with various reference manager tools)
Mechanism of Ca2+ transport by ferroportin
eLife 12:e82947.
https://doi.org/10.7554/eLife.82947


