White matter structural bases for phase accuracy during tapping synchronization
- Institute of Neurobiology, Universidad Nacional Autónoma de México, Campus Juriquilla, Mexico
- International Laboratory for Brain, Music and Sound (BRAMS), Canada
Figures
Figure 1
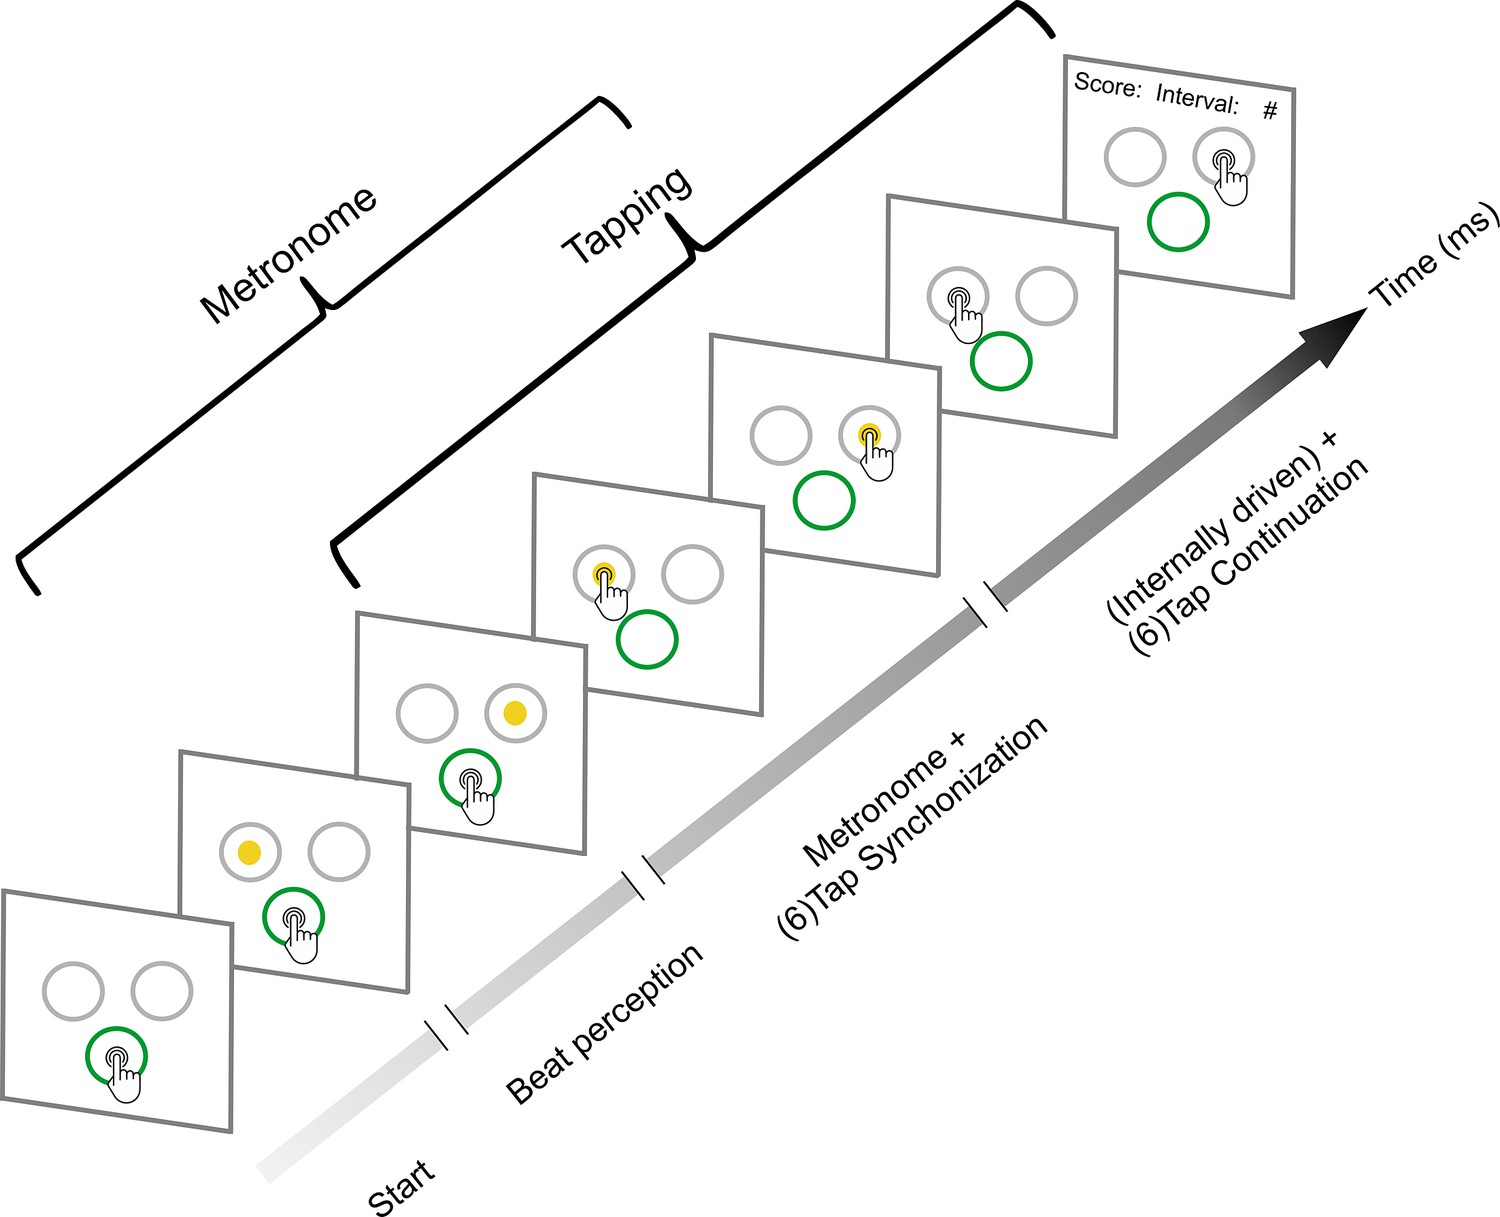
Synchronization-continuation task (SCT).
Initially, the subjects placed their finger at the central-bottom target of a touchscreen to start the trial and maintained the finger in this position while observing a sequence of right–left alternating visual stimuli with a constant interstimulus interval (target duration, perception epoch). The subjects were instructed to start tapping once they got the beat from the metronome; they had two to six stimuli to start tapping. Thus, when they considered they had extracted the beat, subjects tapped the touchscreen on the left or right target in synchrony with the alternating visual metronome for six intervals (synchronization epoch). Finally, they continued tapping on the right or left targets for another six intervals without the metronome (continuation epoch). The mean produced and the target interval were displayed at the end of each trial as feedback. Subjects also performed an auditory metronome version of the SCT, where the metronome consisted of 500 Hz tones that were presented on the right or left side of a headphone. Five target durations (550, 650, 750, 850, or 950 ms) were presented pseudorandomly, with the visual and auditory conditions interleaved between subjects.
Figure 2 with 1 supplement
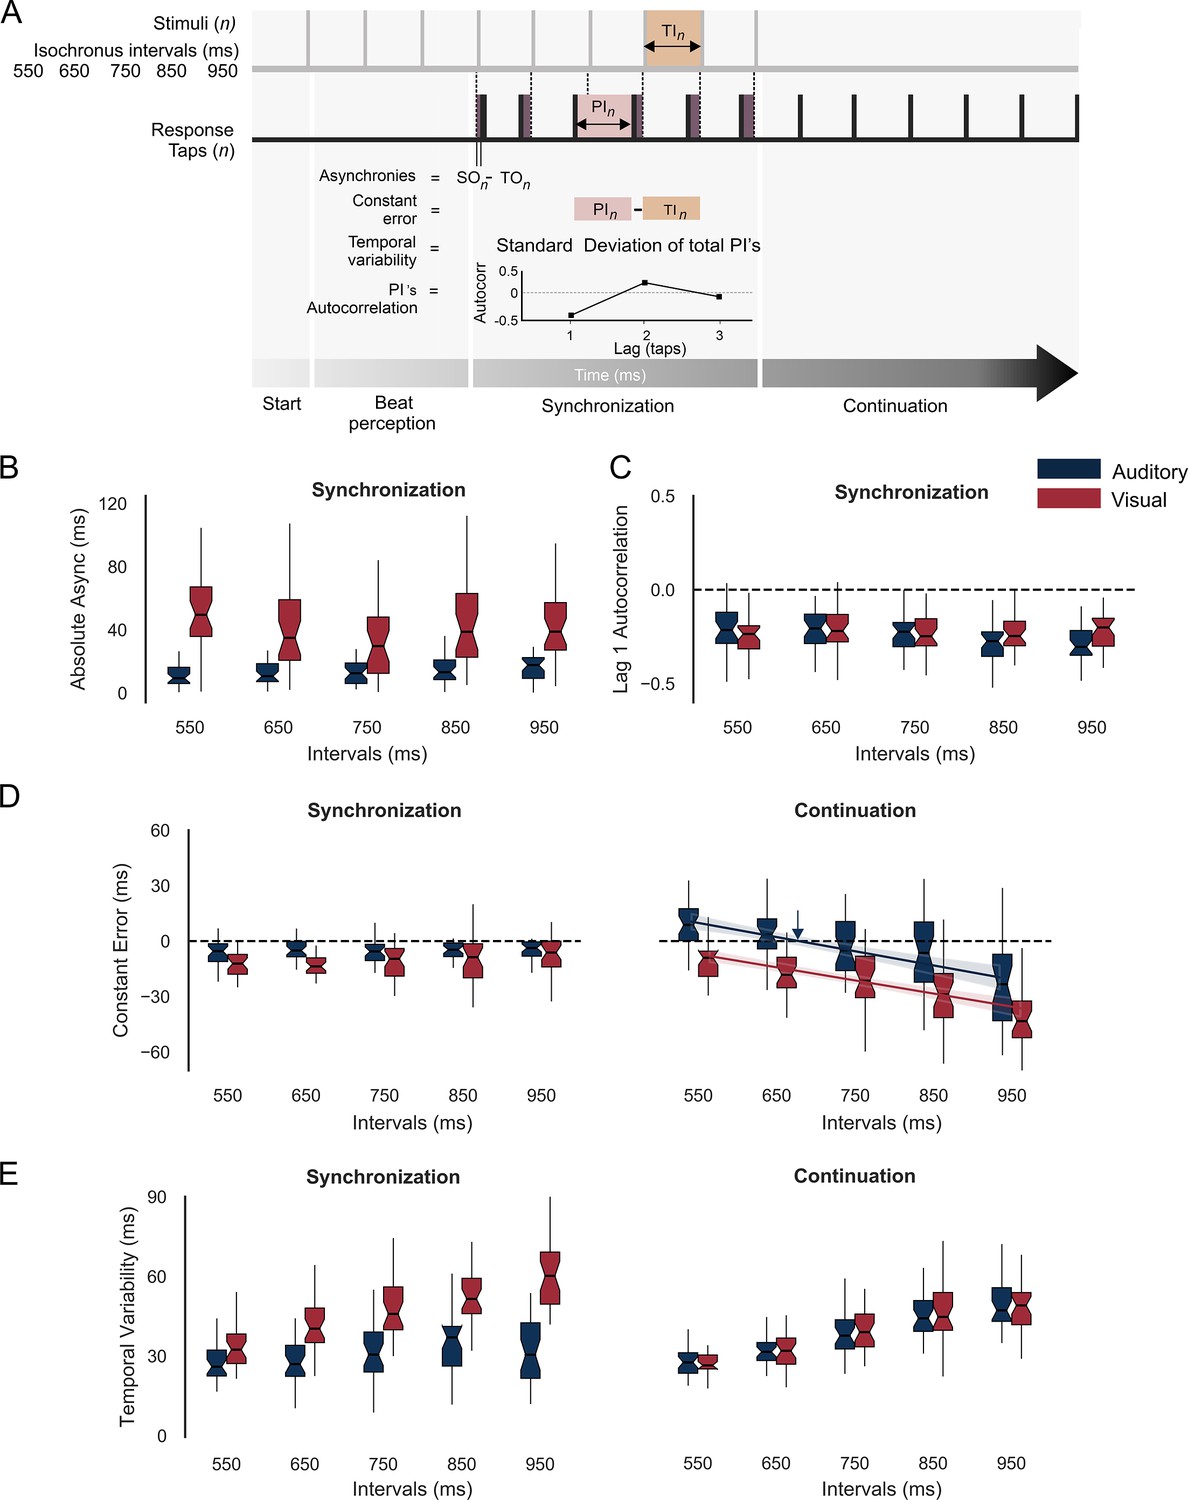
Behavior during the synchronization-continuation task (SCT).
(A) Parameters of rhythmic performance during the SCT. Asynchronies correspond to the time difference between stimulus (SO) and tap onset (TO) across the n intervals of the synchronization epoch. The constant error is the difference between produced (PI) and target intervals (TI), and the temporal variability is the standard deviation of the PI. Finally, the autocorrelation of the PI during synchronization and the lag 1 autocorrelation are computed. A negative value indicates that the subject is using an error correction mechanism (see the text). (B) Absolute asynchronies for each instructed interval and metronome modality (auditory: blue, visual: red) during the synchronization epoch. (C) Lag 1 autocorrelation for each interval and modality during the synchronization epoch. (D) Constant error as a function of target interval for both metronome modalities and the synchronization (left) and continuation (right) epochs of the SCT. The colored lines in D for the continuation epoch correspond to the linear fit between the constant error and the target interval; the indifference interval corresponds to 680 ms (blue vertical arrow) for the auditory condition. (E) Temporal variability as a function of target interval for both metronome modalities and the two epochs of the SCT.
Figure 2—figure supplement 1
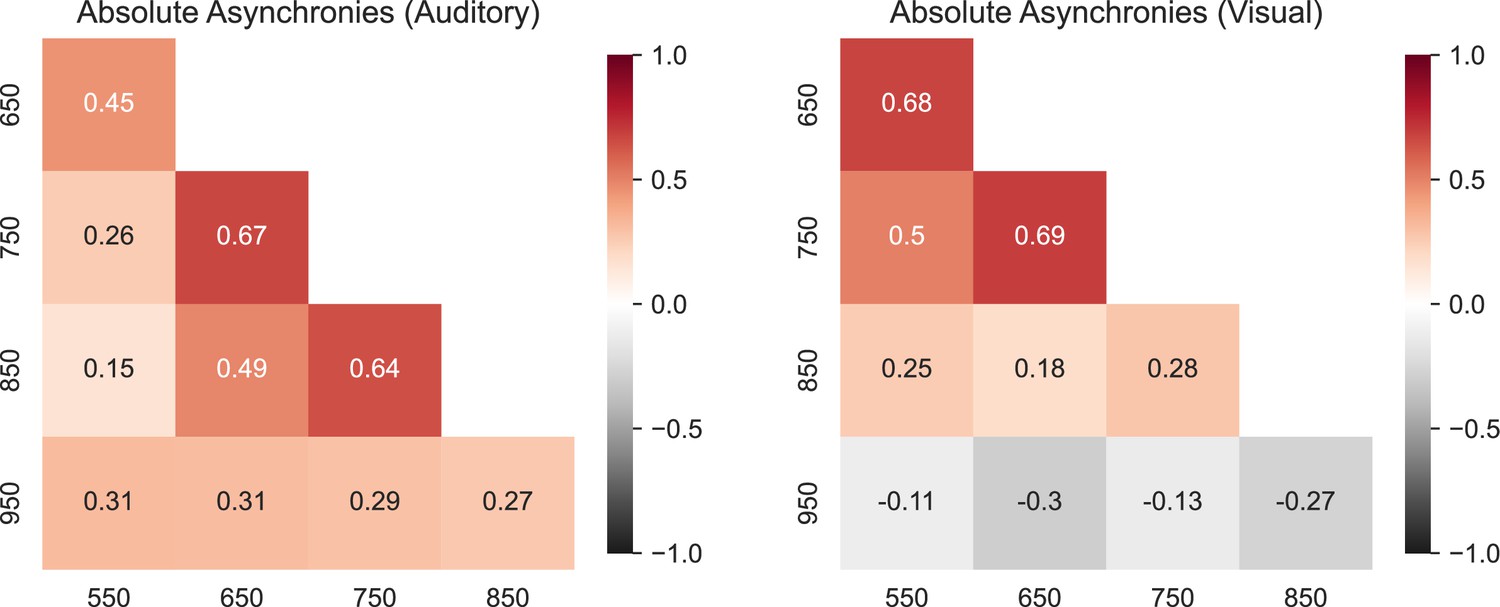
Correlation matrix for the intersubject absolute asynchronies across instructed intervals for the auditory (left) and visual (right) conditions.
Note that only the correlation between the 650 and 750 ms intervals was significant for both the auditory and visual conditions.
Figure 3 with 4 supplements
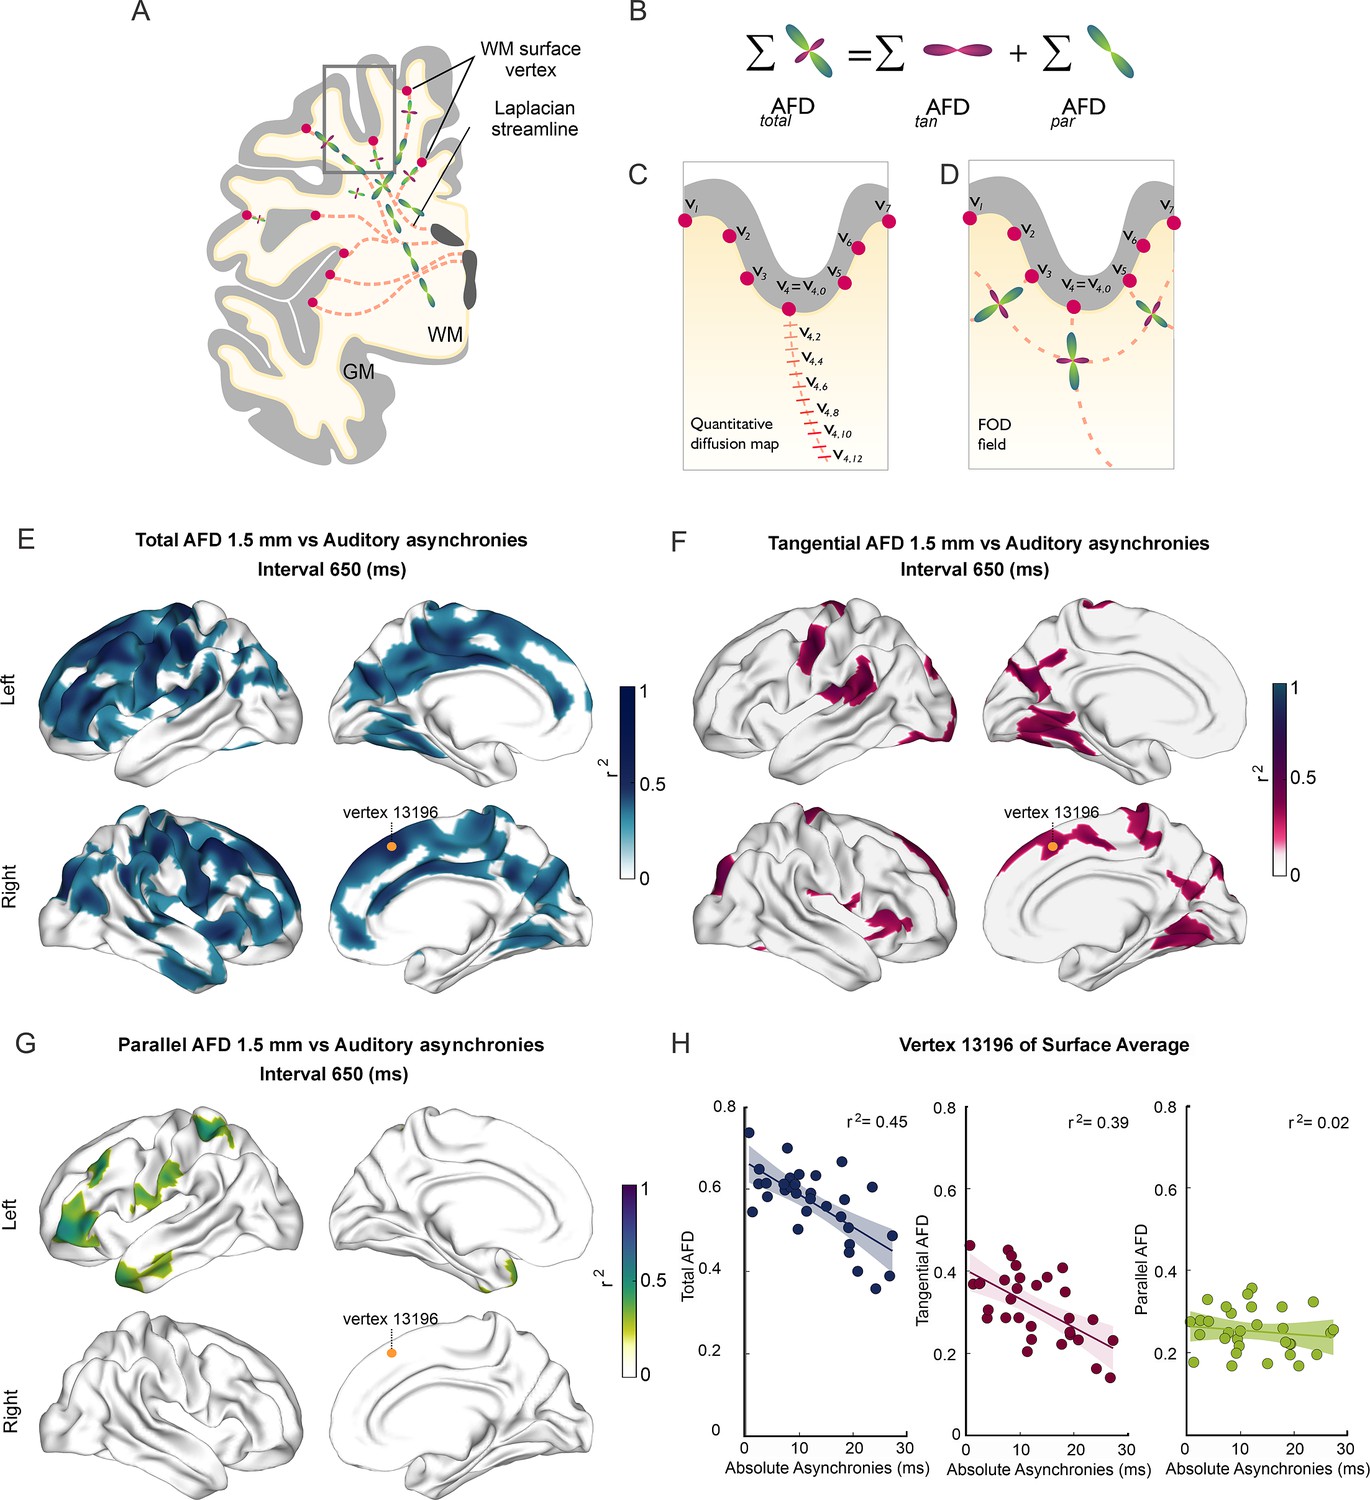
Superficial white matter analysis.
(A–D) Apparent fiber density (AFD) of superficial white matter was systematically sampled (red dashes in C) along synthetic streamlines (red lines in A and C) that extend from each vertex (red circles) of the gray/white matter interface surface toward the ventricles following a Laplacian field (A–C). The integral of all fiber orientation distribution functions (FOD, D) corresponds to the total apparent fiber density (totalAFD), further separated (B) into fiber densities corresponding to fibers entering/exiting the cortex parallel to the Laplacian streamlines (parAFD) and U-fibers running tangentially to the cortex (tanAFD). (E) There are widespread significant correlations between the subjects’ asynchronies during the synchronization-continuation task (SCT) with an auditory metronome and totalAFD, shown here for the 650 ms interval (E). (F) Large areas within the frontal, parietal, and occipital lobes showed significant correlations between behavior and tanAFD. (G) Only restricted frontal and temporal regions showed correlation between parAFD and the asynchronies. (H) Coefficient of determination across the 32 subjects between the three AFD metrics and asynchronies for one exemplary vertex (yellow dot in E–G).
Figure 3—figure supplement 1
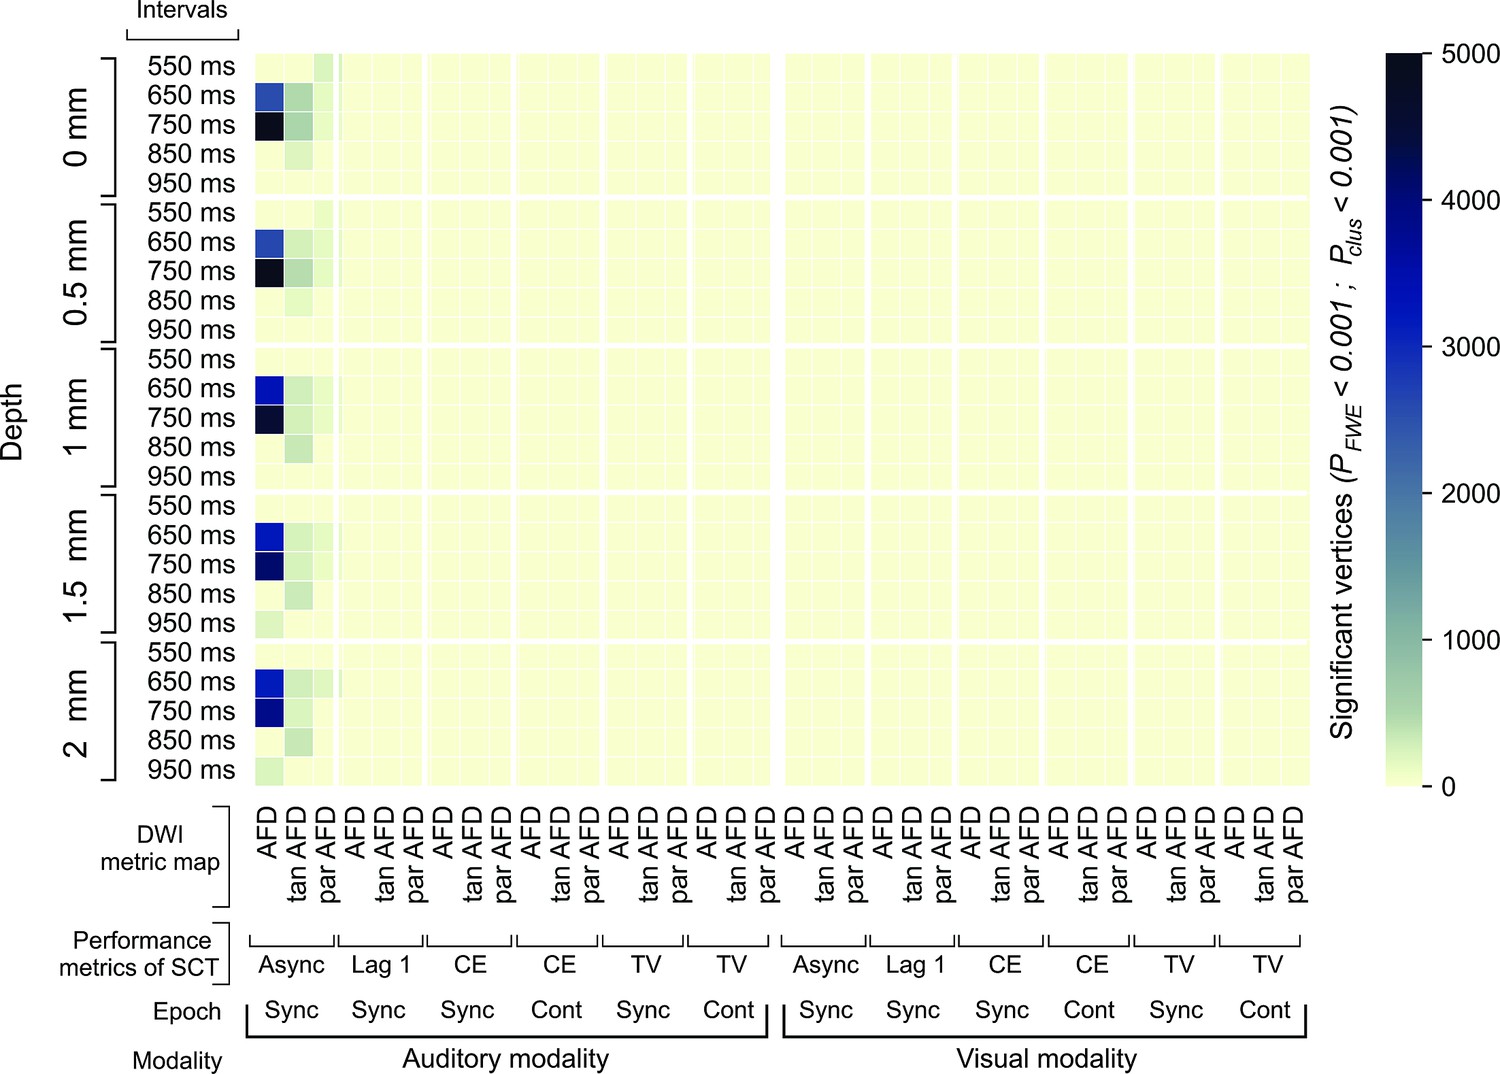
Characterization of the superficial white matter (SWM) properties associated with synchronization-continuation task (SCT) performance.
The surface-based analysis (SBA) was used to assess the association between the performance metrics of the SCT and the metrics to characterize the SWM sampled in five depths with respect to the gray/white matter interface. The number of significant vertices (both hemispheres) after SBA is shown for the three diffusion-weighted imaging (DWI) metric maps, through five depths sampled, and the four behavioral metrics in five intervals, two epochs, and two modalities. The number of vertices for the three apparent fiber density (AFD) metrics showed association only with the absolute asynchronies of the different intervals of the auditory modality. The largest significant clusters were observed between the absolute asynchronies for the 650 and 750 ms intervals through the five depths sampled in the three AFD metrics. The SBA results were corrected to multiple comparisons, using as thresholds pcft < 0.001 and pcluster < 0.001. AFD: apparent fiber density; tanAFD: tangential apparent fiber density; parAFD: parallel apparent fiber density; Async: absolute asynchronies; Lag 1: lag 1 of the autocorrelation for each instructed interval; CE: constant error; TV: temporal variability; Sync: synchronization; Cont: continuation.
Figure 3—video 1
Spatial correlations between the superficial white matter (SWM) apparent fiber density and interval-specific absolute asynchronies of the auditory modality.
Coefficient of determination of the significant cluster vertices after surface-based analysis through the depths sampled (pFWE < 0.001 and pcluster < 0.001).
Figure 3—video 2
Spatial correlations between the tangential superficial white matter (SWM) apparent fiber density and interval-specific absolute asynchronies of the auditory modality.
Coefficient of determination of the significant cluster vertices after surface-based analysis through the depths sampled (pFWE < 0.001 and pcluster < 0.001).
Figure 3—video 3
Spatial correlations between the parallel superficial white matter (SWM) apparent fiber density and interval-specific absolute asynchronies of the auditory modality.
Coefficient of determination of the significant cluster vertices after surface-based analysis through the depths sampled (pFWE < 0.001 and pcluster < 0.001).
Figure 4 with 1 supplement
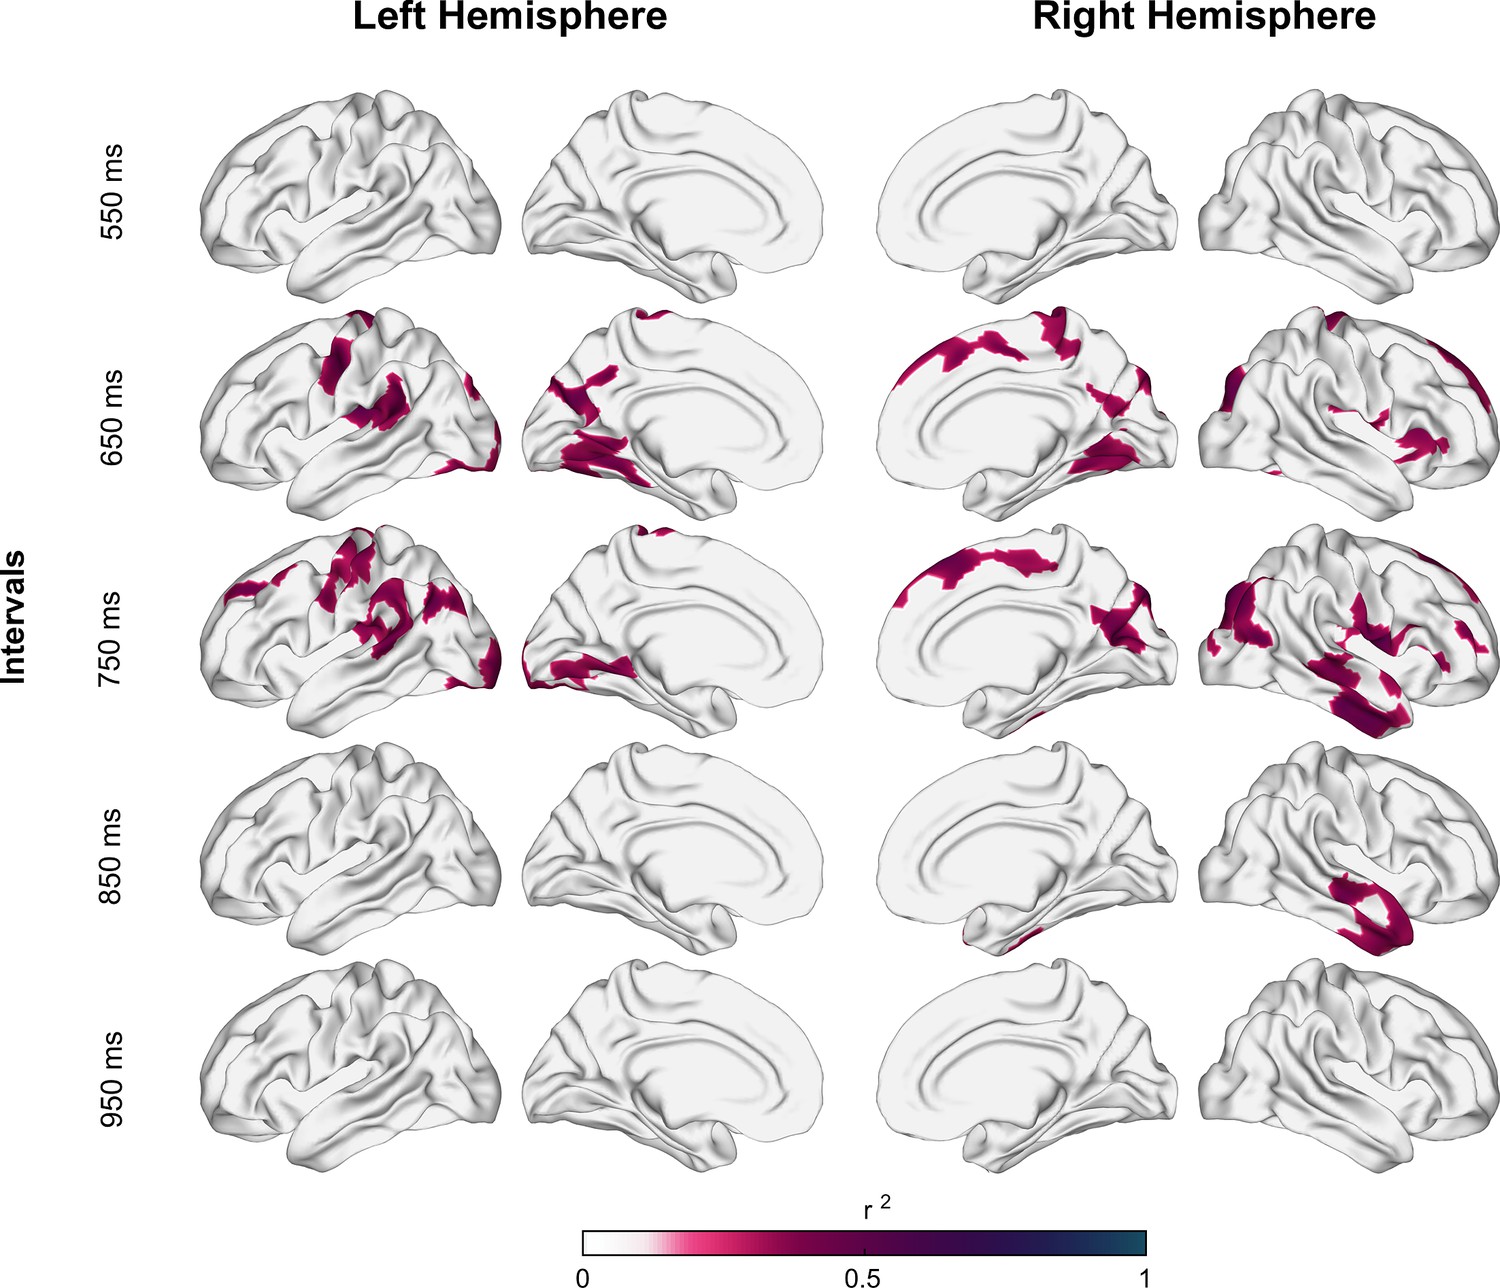
Coefficient of determination between auditory asynchronies and tangential apparent fiber density for each vertex in superficial white matter (sampled at 1.5 mm below the gray/white matter interface) across all tested intervals in the synchronization-continuation task (SCT) for both hemispheres.
Significant correlations were localized in large clusters within motor, auditory, and visual areas, particularly for 650 and 750 ms intervals.
Figure 4—figure supplement 1
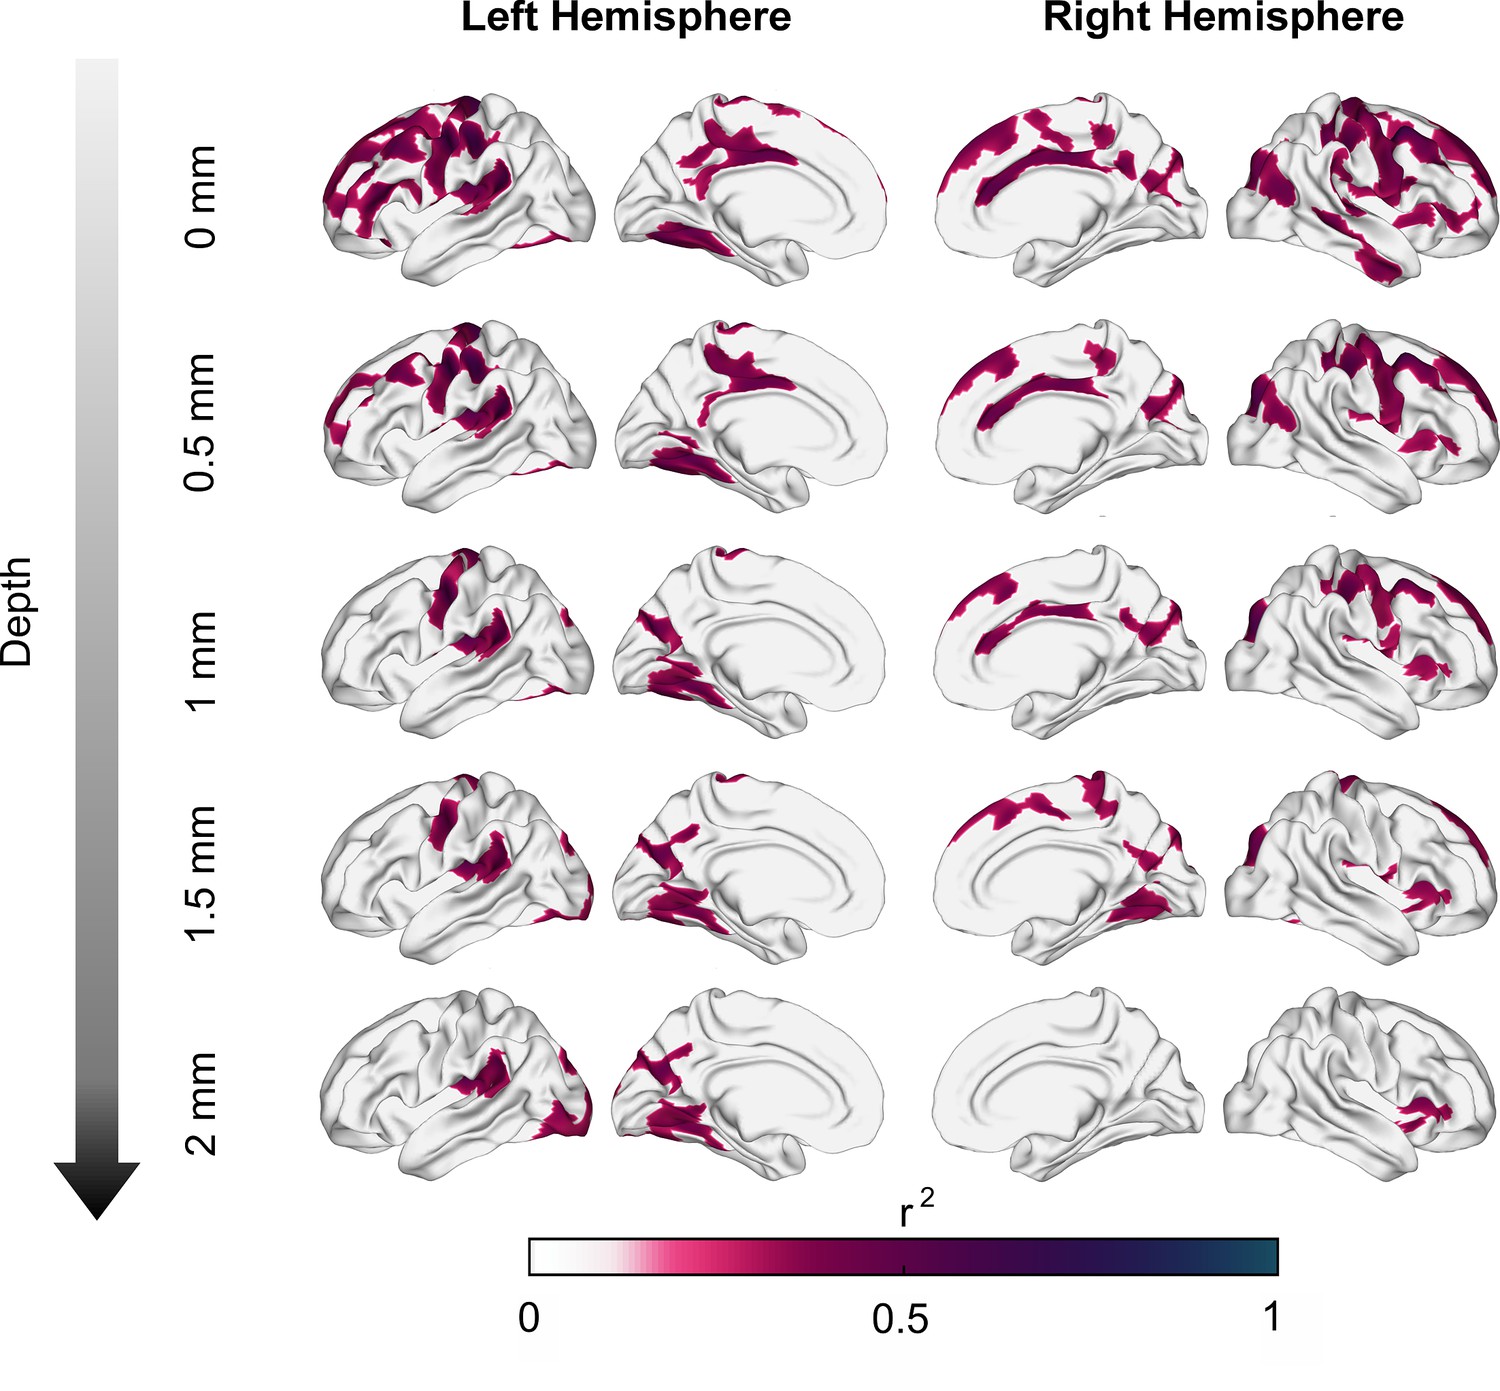
Association between asynchronies (650 ms intervals) and tangential superficial white matter apparent fiber density (tanAFD) at various depths from the gray/white matter interface.
tanAFD sampled at 0 mm shows significant correlations distributed throughout most of the brain, but specific regions (e.g., motor, auditory, and visual areas) consistently show significant correlations as depth increases.
Figure 5 with 1 supplement
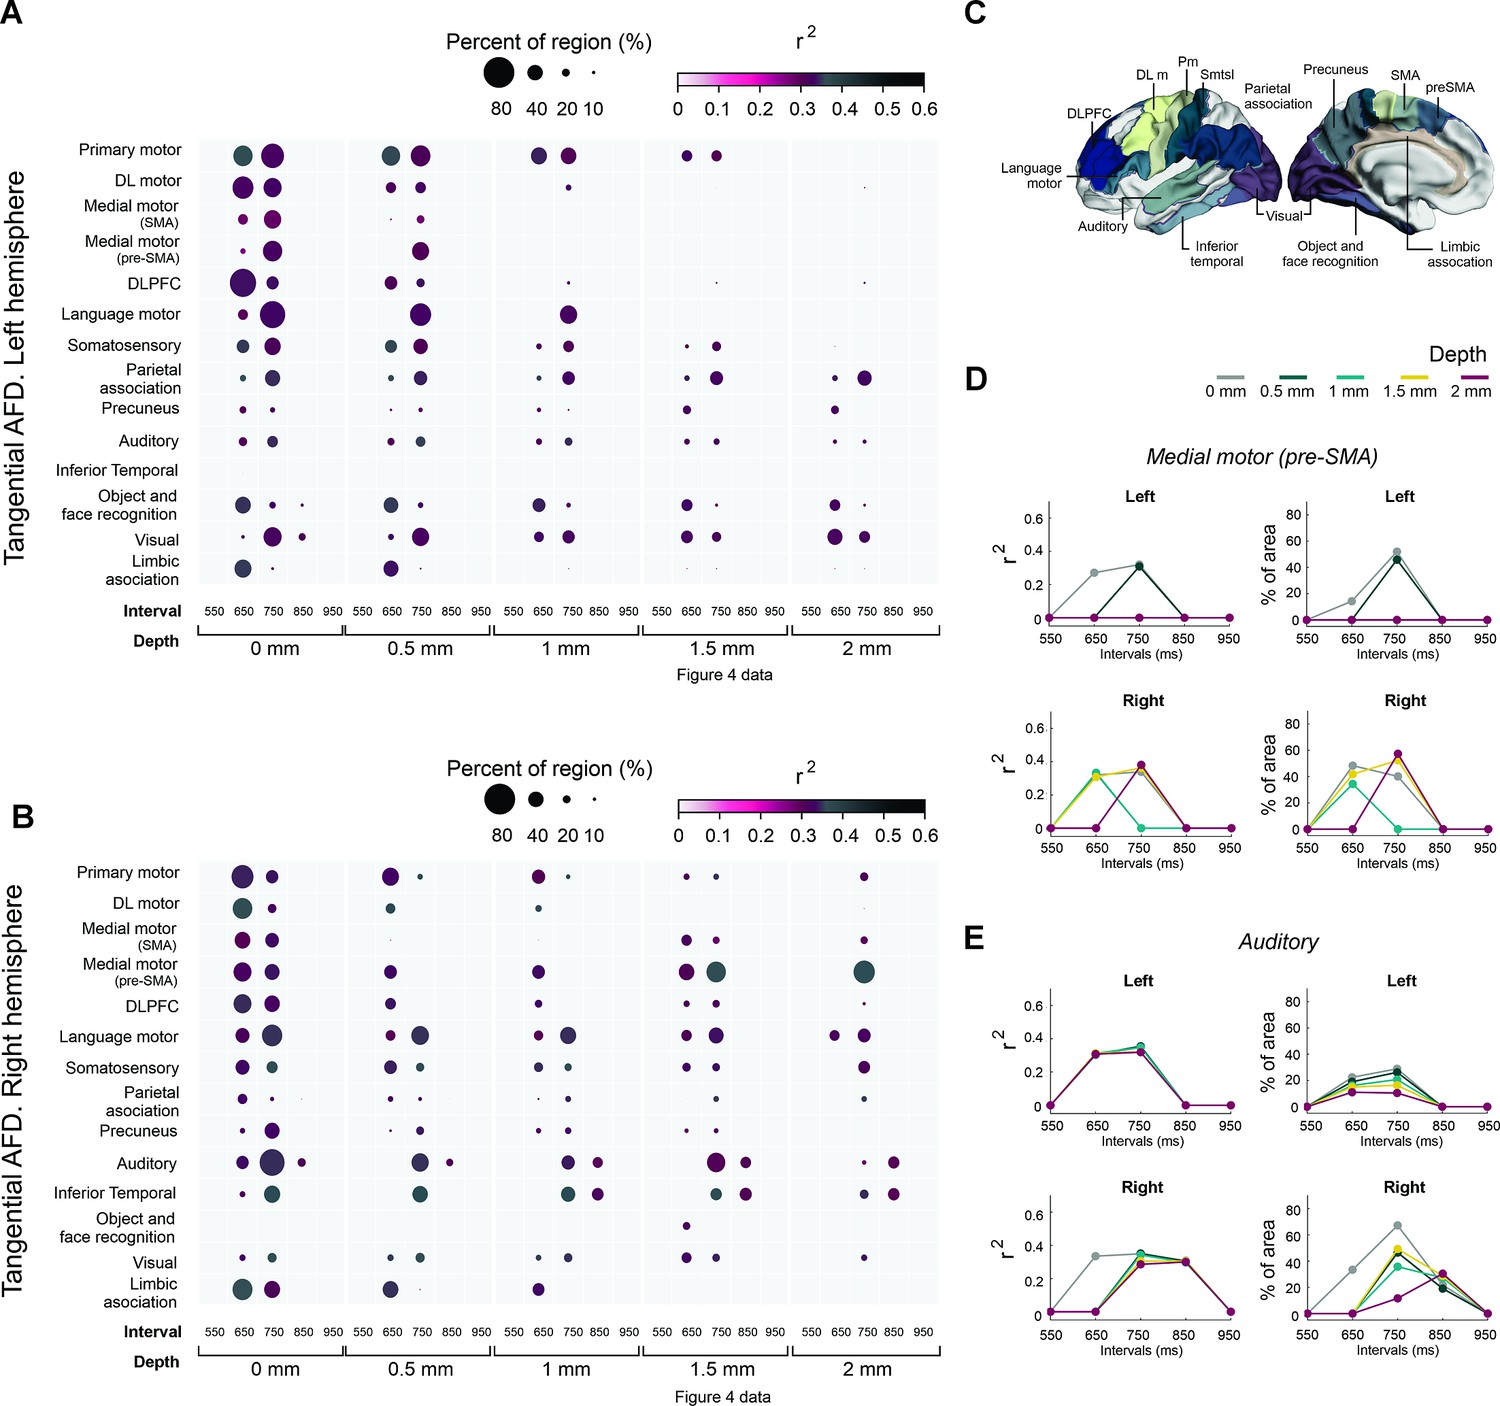
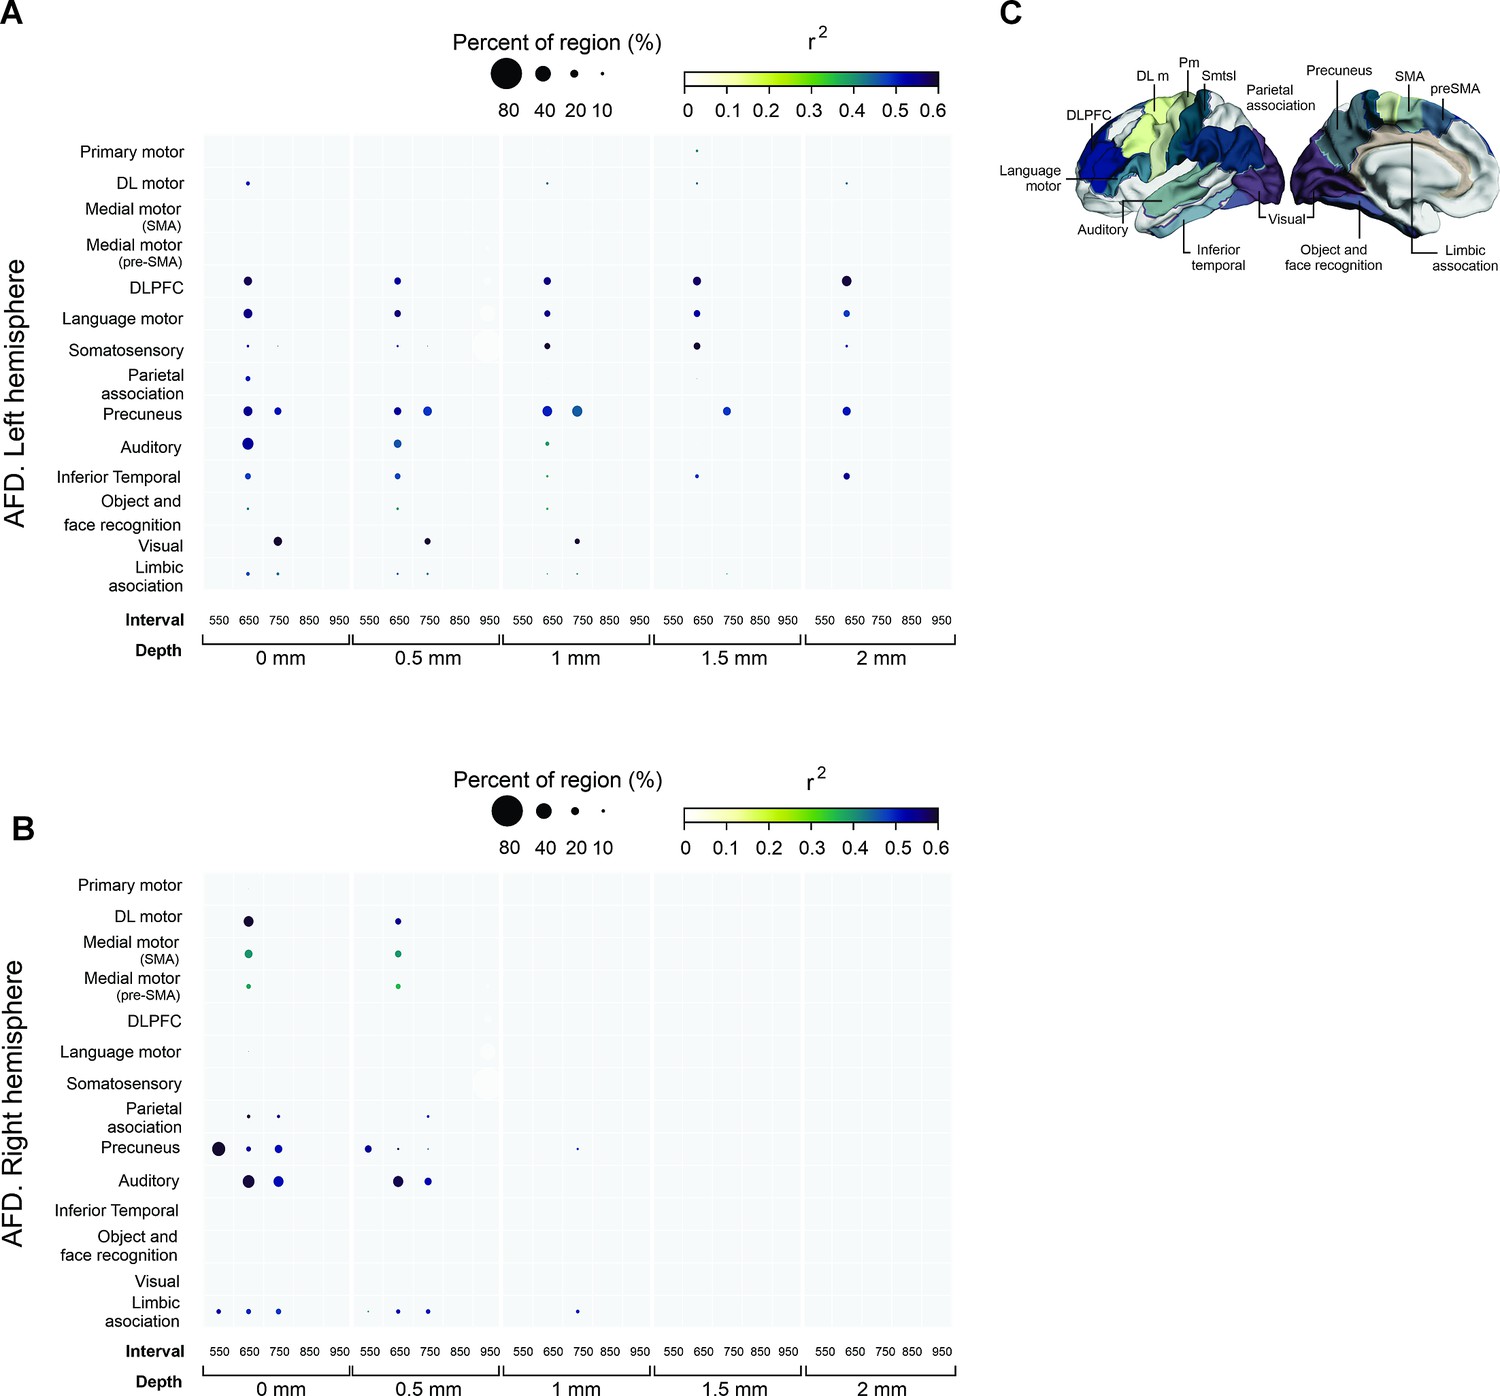
Associations between the asynchronies and regions of interest of tanAFD.
(A, B) Interregional correlation plot of the auditory asynchronies and tanAFD as a function of the instructed interval and depth of the tanAFD. Significant clusters were aggregated into fourteen regions (y-axis) based on the Brainnetome Atlas shown in C. The color and size of the circle for each cluster correspond to the correlation coefficient of determination (critical value r > 0.355 at p < 0.02, df = 29) and the percent of significant vertices in each area, respectively. The left hemisphere (A) showed more areas with significant vertices than the right (B; 17541>16641). A systematic decrease in circle size as a function of depth was observed across areas of both hemispheres. At a depth of 1.5 mm, the regions with a larger percent of significant vertices for the right hemisphere at 750 ms were the medial premotor (supplementary motor area [SMA] and preSMA), auditory, and language motor areas (B). In contrast, few significant vertices were observed across the regions of the left hemisphere (A). (C) Brainnetome Atlas (Fan et al., 2016) showing the 14 regions of interest (ROIs) analyzed in A and B. (D) Interval selectivity curves for the correlation coefficients and percent of significant vertices across tanAFD depths (color coded) for preSMA. (E) Same as D but for the auditory cortex. Note that the preferred interval in the two areas is between 650 and 750 ms.
Figure 5—figure supplement 1
Interregional correlation plot of the auditory asynchronies and parAFD as a function of the instructed interval and the depth of the parAFD calculation.
(A, B) Interregional correlation plot of the auditory asynchronies and parAFD as a function of the instructed interval and the depth of the parAFD calculation. (C) shows the brain parcellation used.
Figure 6
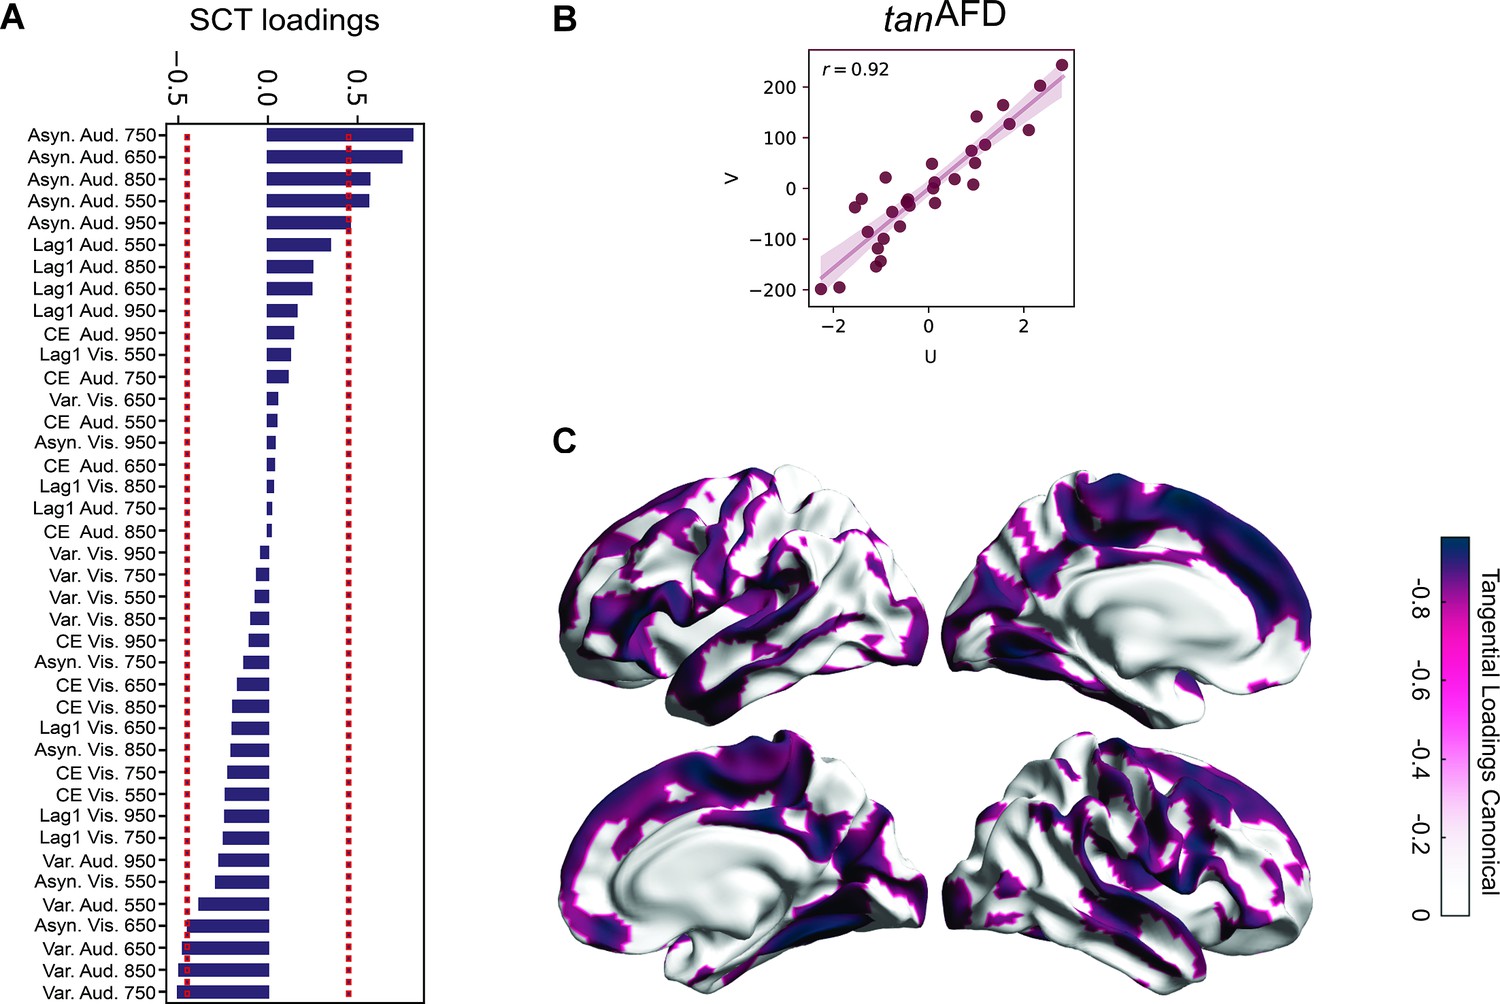
Canonical correlation between behavioral metrics and tanAFD.
(A) Loadings (correlations) of the synchronization-continuation task (SCT) variables for the tanAFD model. Note the absolute asynchronies of the auditory modality showed the highest correlations with the structural data, at the 650–850 ms intervals, in line with previous results. In addition, this approach identified the total variability in the same sensory modality and intervals as significant, although with a lower correlation coefficient and of the opposite sign. (B) Pearson’s correlation of canonical variates (U = behavioral; V = tanAFD across vertices).(C) Loadings of the tanAFD map. Note that the audiomotor system is highly correlated with the SCT behavior.
Figure 7 with 1 supplement
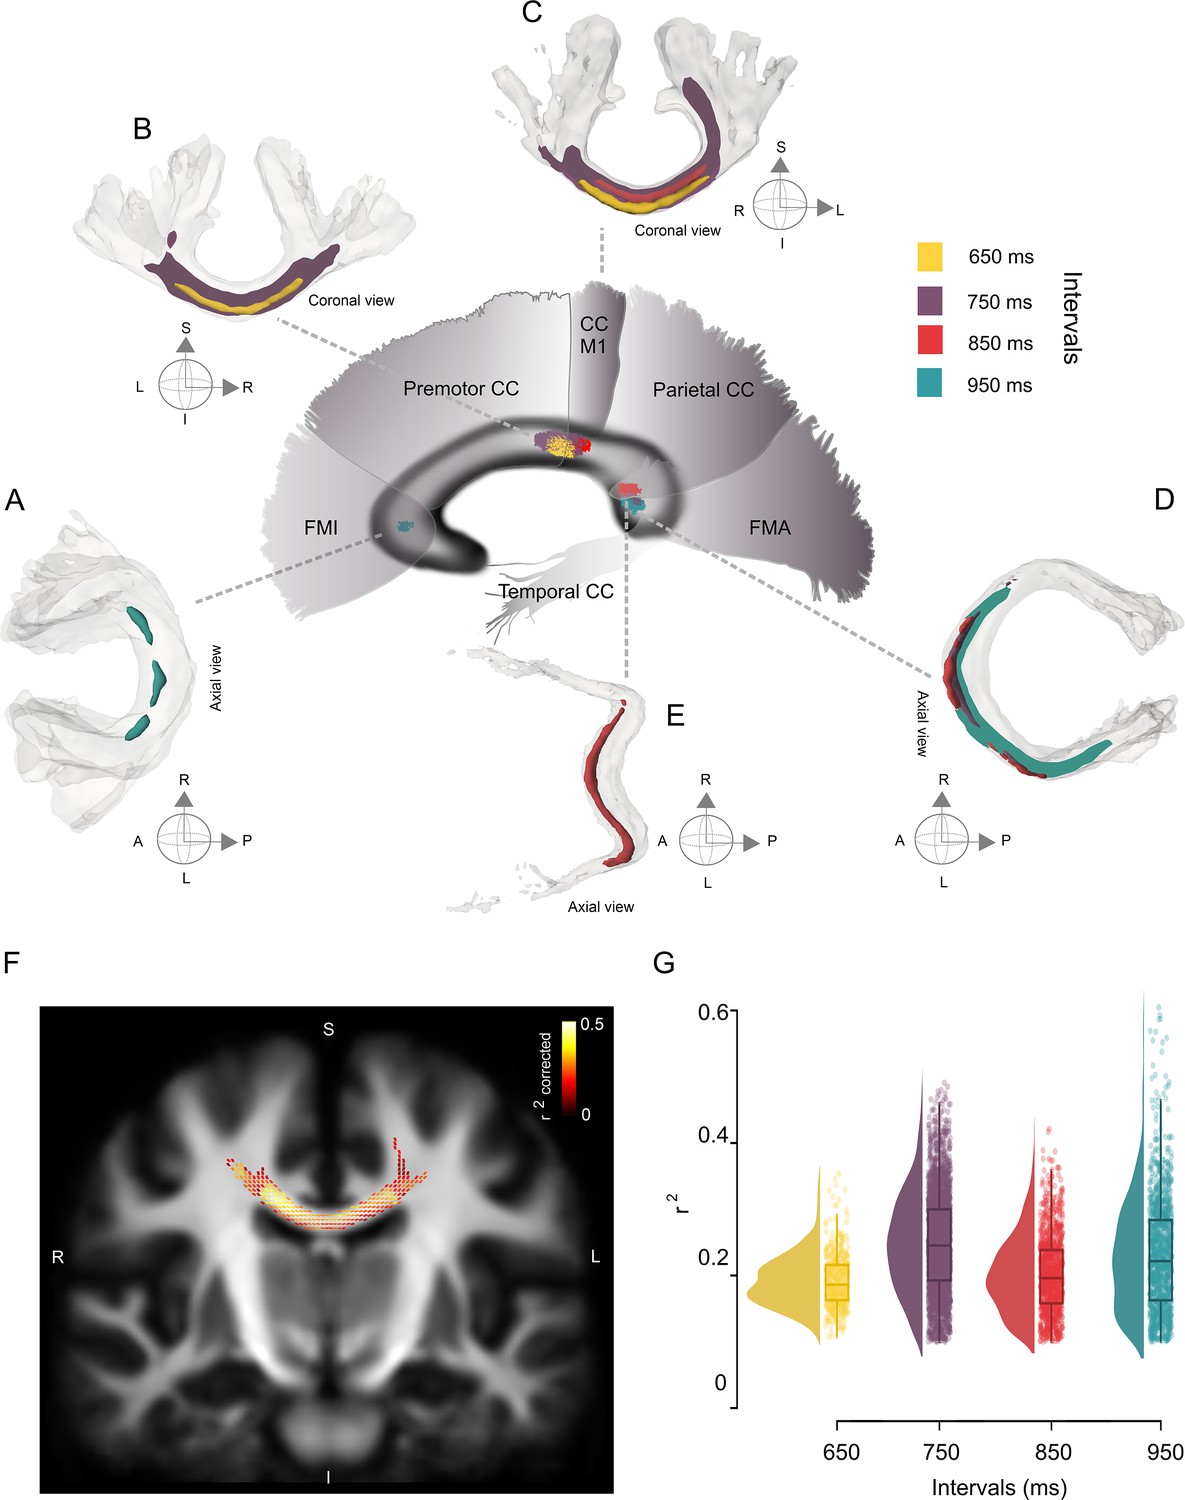
Interval-selective map of the correlations in the deep white matter.
(A–E) Fiber bundles that showed significant correlations between the asynchronies in the synchronization-continuation task (SCT) auditory condition and the fiber density cross-section (FDC) of the corpus callosum (CC). Panels A–C correspond to the anterior coronal sections of the sagittal map depicted in the center of the figure. Panels D and E correspond to the posterior axial sections of the same central sagittal map. An interval-selective map with an anterior posterior gradient is depicted. (F) Coronal section of the CC showing the fixels with a significant correlation coefficient (color-coded r values; only fixels with pcorr < 0.05 are shown) between asynchronies at the 750 ms interval in the auditory condition and FDC. (G) Distribution of the coefficients of determination (r2) of the FDC vs absolute asynchronies for the four intervals listed on the x-axis. The interquartile box plots are depicted on the right.
Figure 7—figure supplement 1
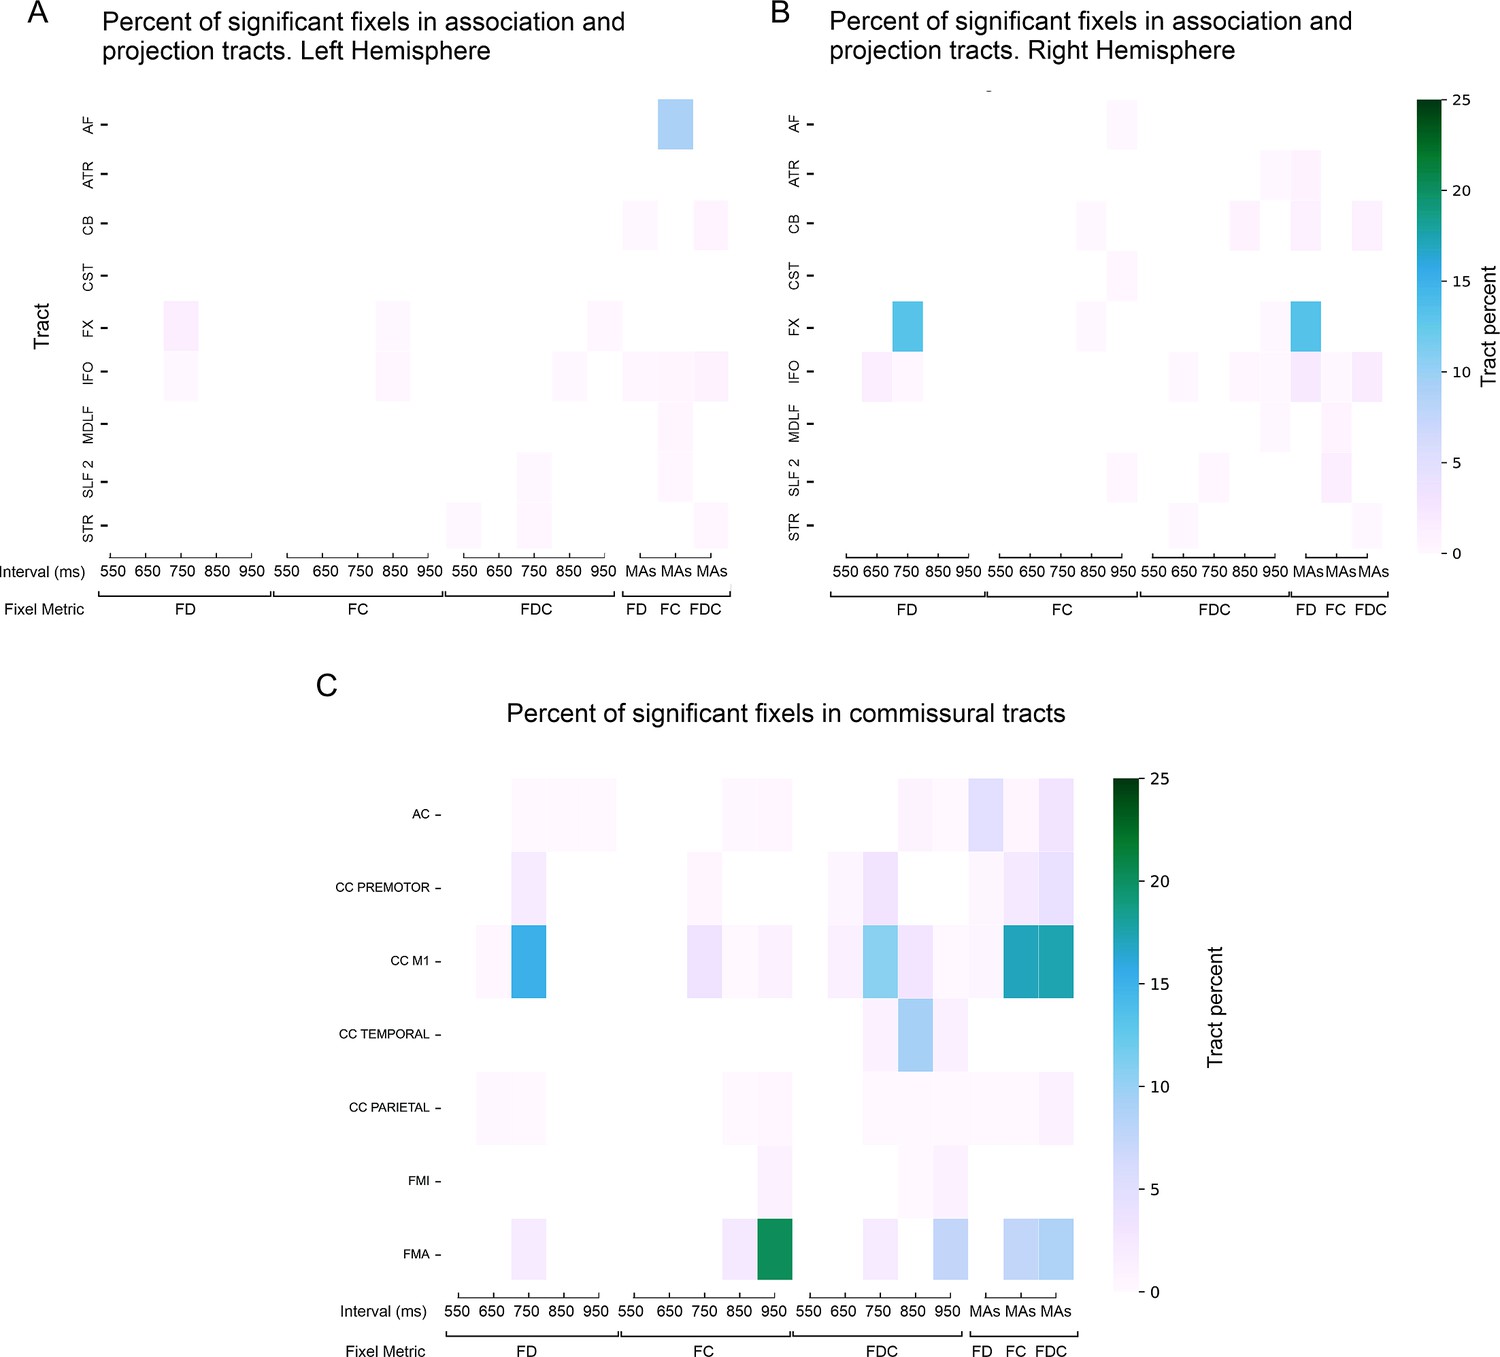
Spatial extent of deep white matter findings.
Percent of significant fixels (five intervals) in the deep white matter in projection tracts in the (A) left hemisphere, (B) right hemisphere, and (C) commissural tracts. AF = arcuate fasciculus; ATR = anterior thalamic radiation; CB = cingulum bundle; CST = corticospinal tract; FX = fornix; IFO = inferior fronto-occipital fasciculus; MdLF = middle longitudinal fasciculus; SLF2 = superior longitudinal fasciculus 2; STR = superior thalamic radiation; AC = anterior commissure; CC = corpus callosum; FMI = forceps minor; FMA = forceps major; FD = fiber density; FC = fiber cross-section; FDC = fiber density and cross-section; MAs = mean asynchronies.
Figure 8 with 1 supplement
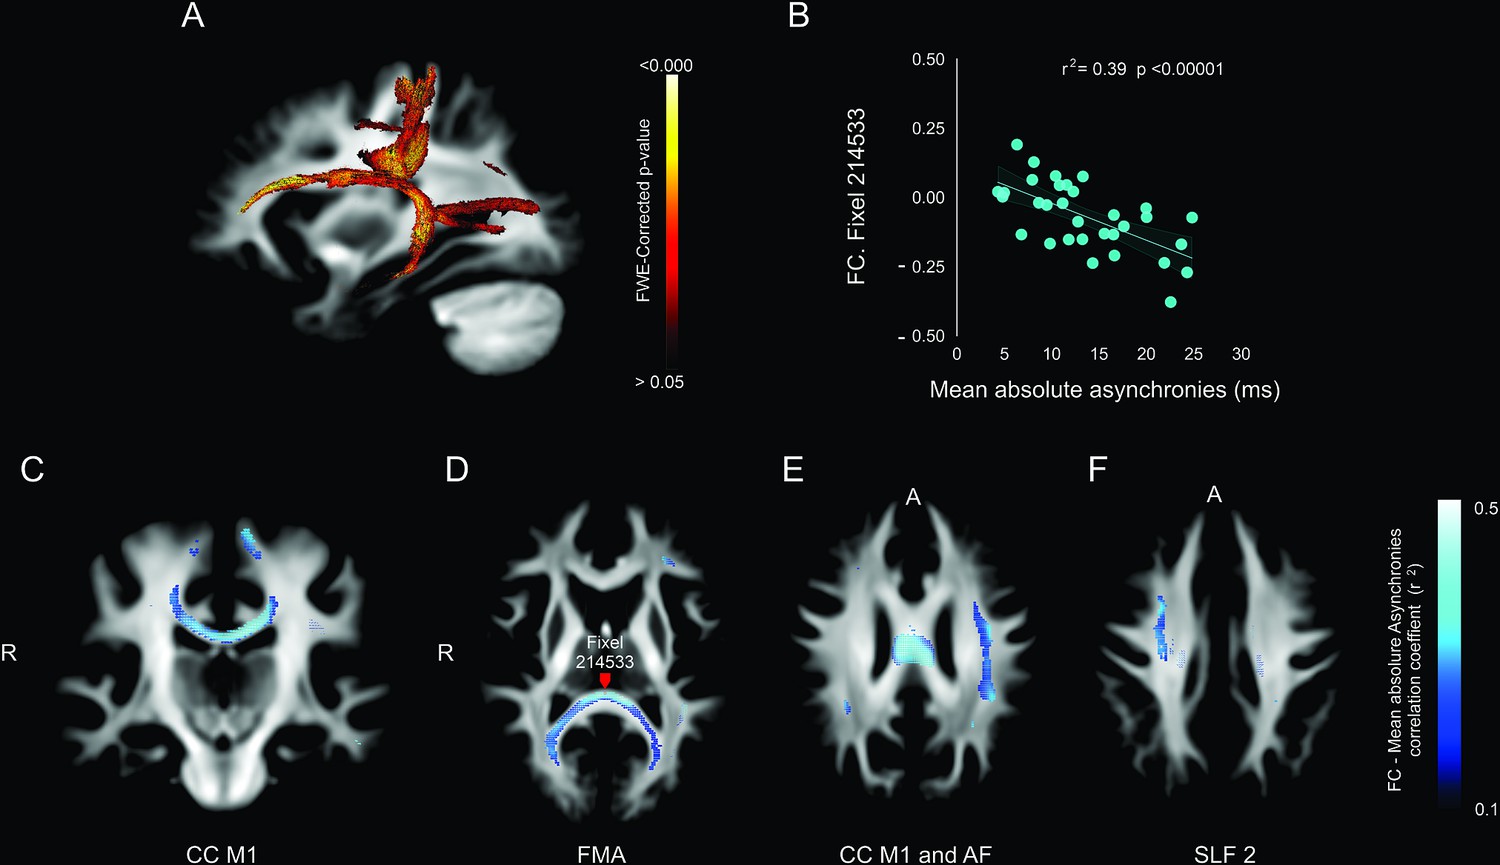
Association between deep white matter and mean absolute asynchronies across all target intervals.
(A) Sagittal brain section showing the p-value of significant fixels. (B) Example of the significant correlation between the fiber cross-section (FC) metric and the mean absolute asynchronies in a single illustrative fixel (red dot in panel D). (C–F) Axial sections showing the negative correlation (r) between FC and mean absolute asynchronies for significant fixels. CC = corpus callosum (C), FMA = forceps major (D), AF = arcuate fasciculus (E), SLF 2 = superior longitudinal fasciculus 2 (F).
Figure 8—figure supplement 1
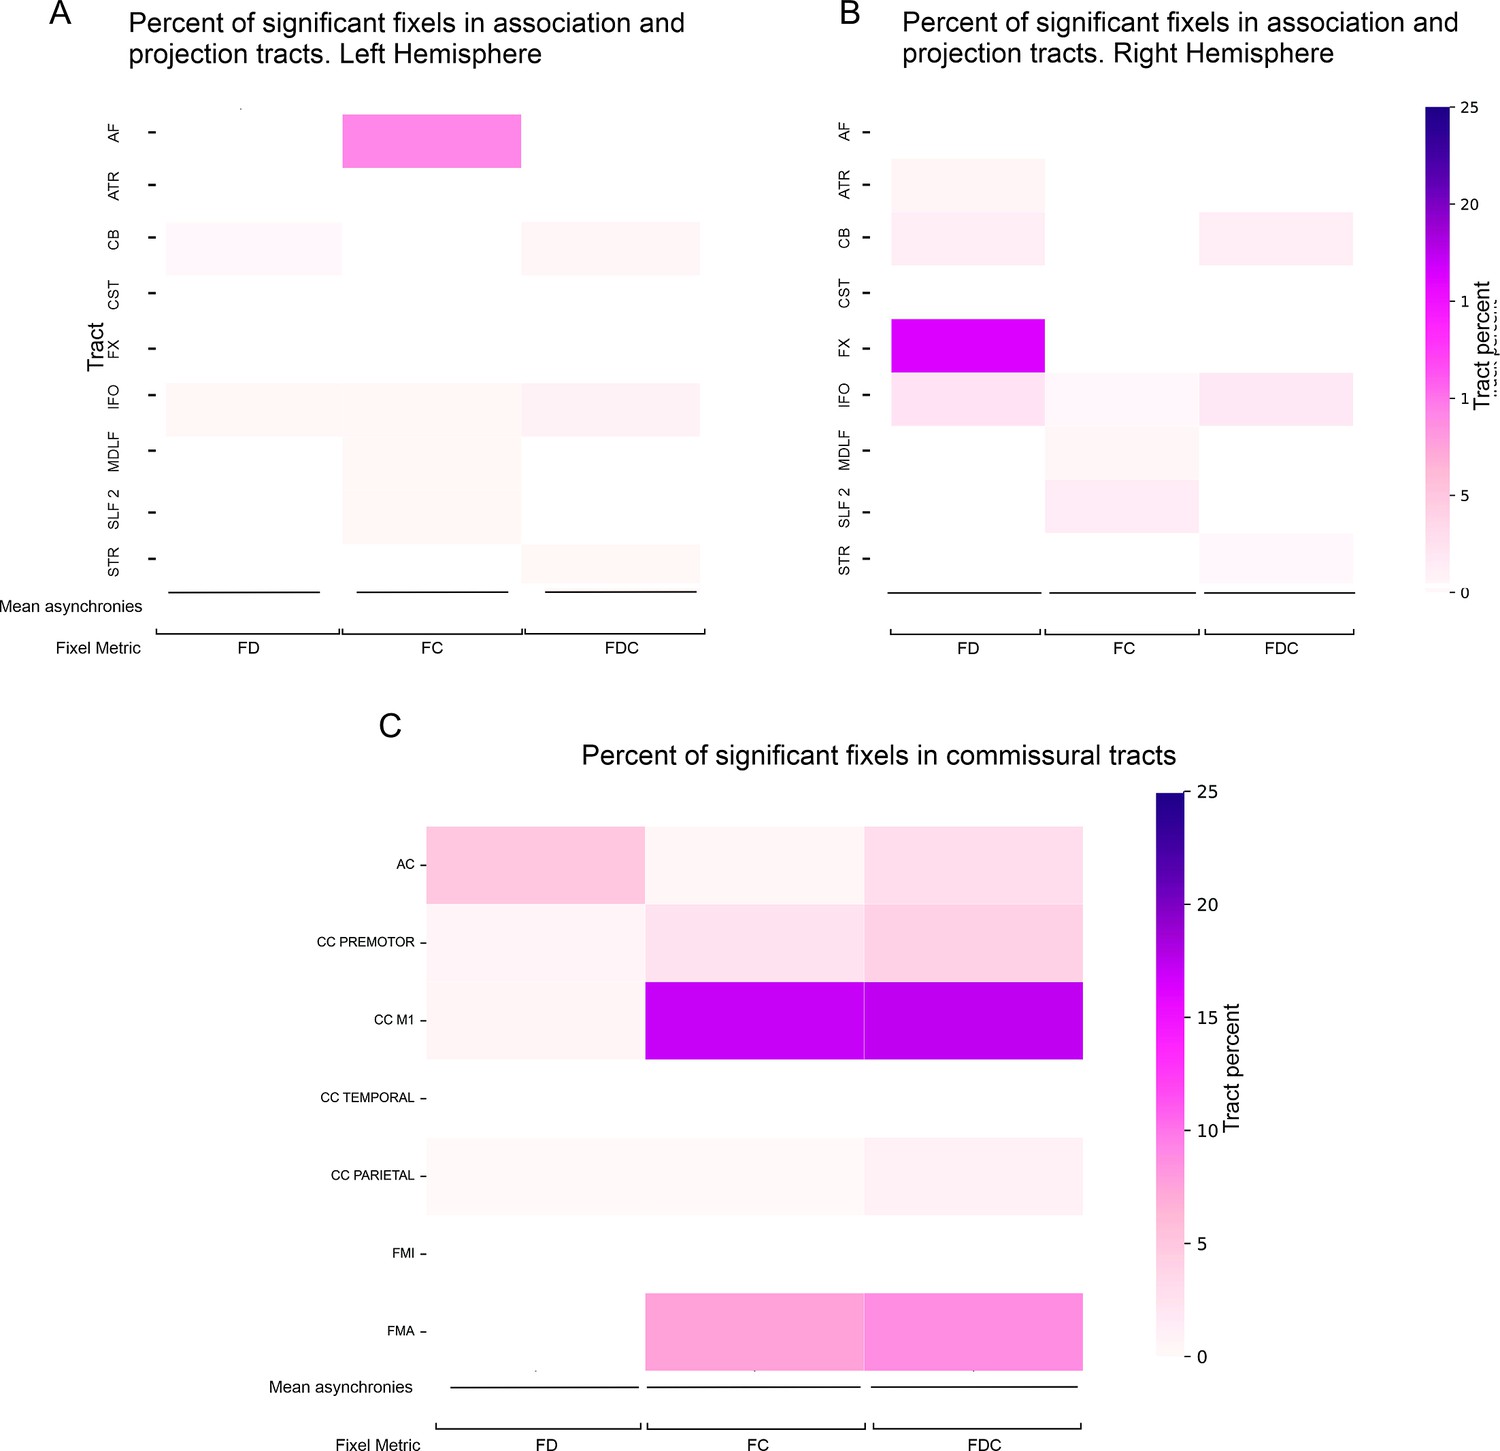
Spatial extent of deep white matter findings.
Percent of significant fixels (mean asynchronies) in thedeep white matterin projection tracts in the (A) left hemisphere, (B) right hemisphere, and (C) commissural tracts (C). AF = arcuate fasciculus; ATR = anterior thalamic radiation; CB = cingulum bundle; CST = corticospinal tract; FX = fornix; IFO = inferiorfronto-occipital fasciculus;MdLF = middle longitudinal fasciculus; SLF2 = superior longitudinal fasciculus 2; STR = superiorthalamicradiation;AC = anterior commissure; CC = corpus callosum; FMI = forceps minor; FMA = forceps major; FD = fiber density; FC = fiber cross-section; FDC = fiber density and cross-section; MAs = mean asynchronies.
Additional files
Download links
A two-part list of links to download the article, or parts of the article, in various formats.
Downloads (link to download the article as PDF)
Open citations (links to open the citations from this article in various online reference manager services)
Cite this article (links to download the citations from this article in formats compatible with various reference manager tools)
White matter structural bases for phase accuracy during tapping synchronization
eLife 13:e83838.
https://doi.org/10.7554/eLife.83838


