The kleisin subunit controls the function of C. elegans meiotic cohesins by determining the mode of DNA binding and differential regulation by SCC-2 and WAPL-1
- MRC London Institute of Medical Sciences, United Kingdom
- Universidad Autónoma de Madrid, Spain
- Imperial College Faculty of Medicine, United Kingdom
Figures
Figure 1 with 1 supplement
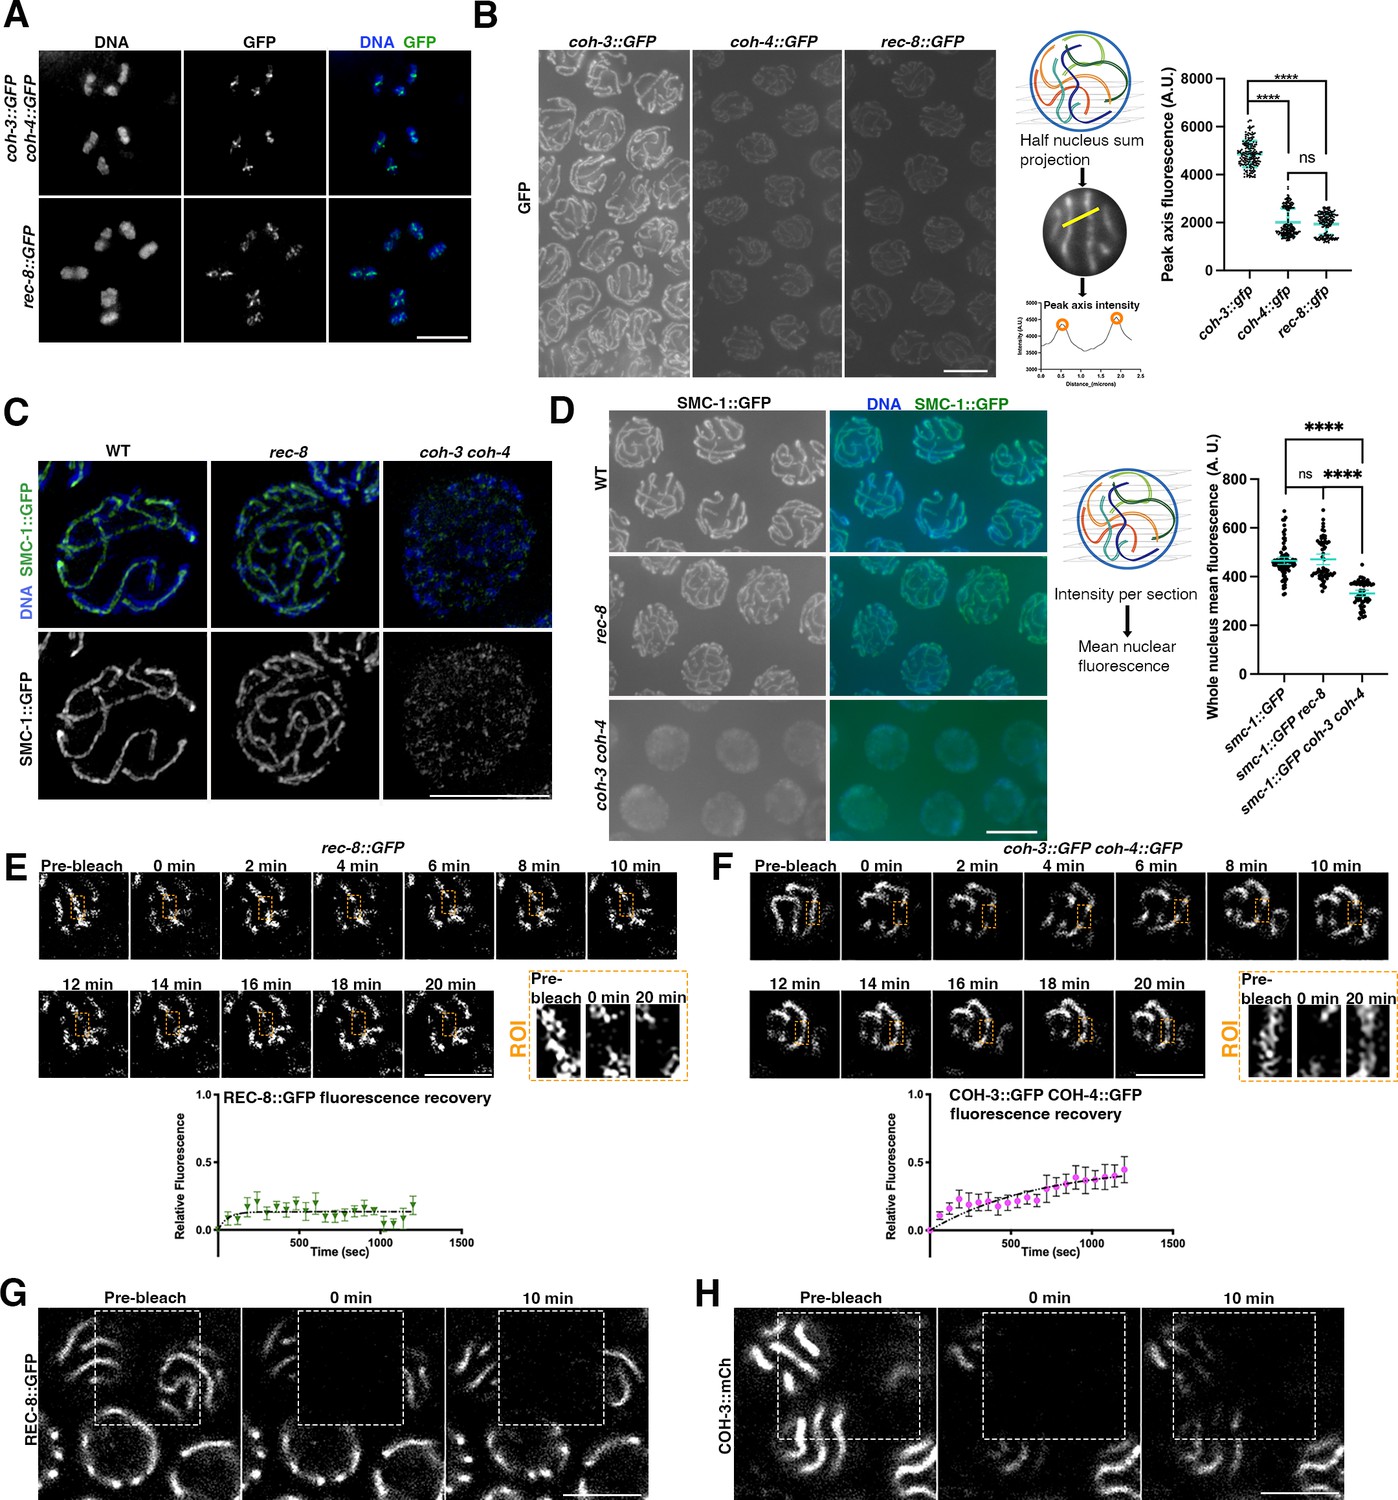
Highly abundant COH-3/4 complexes promote axis integrity and associate dynamically with pachytene chromosomes.
(A) Projections of diakinesis oocytes stained with DAPI and anti-GFP antibodies to visualise COH-3::GFP COH-4::GFP (top panel) or REC-8::GFP (bottom panel). The presence of six bivalents confirms normal chiasma formation. (B) Non-deconvolved projections of pachytene nuclei of indicated genotype stained with anti-GFP antibodies. Images were acquired under the same exposure conditions and panels were adjusted with the same settings to allow direct comparison of anti-GFP staining intensity in the different genotypes. Diagram depicts creation of half-nucleus sum intensity projections to measure anti-GFP signal intensity at axial elements. Graph shows anti-GFP intensity quantification of sum intensity at axial elements, error bars indicate mean and SD, and p-values were calculated using a two-tailed Mann–Whitney U test. N (number of axes analysed [one or two per nucleus]: 192 [coh-3::GFP], 200 [coh-4::GFP], 191 [rec-8::GFP]). Nuclei from three different germlines per genotype were included. (C) Projections of pachytene nuclei from worms expressing SMC-1::GFP of indicated genotypes stained with anti-GFP antibodies and DAPI and imaged by structural illumination microscopy (SIM). Note the presence of continuous-linear structures containing SMC-1::GFP in WT and rec-8 mutants, but not in coh-3 coh-4 double mutants. (D) Non-deconvolved projections of pachytene nuclei of indicated genotype stained with anti-GFP antibodies. Images were acquired under the same exposure conditions and panels were adjusted with the same settings to allow direct comparison of anti-GFP staining intensity in the different genotypes. Diagram depicts creation of whole-nucleus mean intensity projections to measure anti-GFP signal. Graph shows anti-GFP intensity quantification, error bars indicate mean and SD, and p-values were calculated using a two-tailed Mann–Whitney U test. N (number of nuclei analysed): 83 (smc-1::GFP [WT]), 59 (smc-1::GFP rec-8), and 60 (smc-1::GFP coh-3 coh-4). (E, F) Fluorescence recovery after photobleaching (FRAP) analysis of REC-8::GFP and COH-3::GFP COH-4::GFP in pachytene nuclei. Images show pre- and post-photobleaching images at indicated time points, with orange rectangles indicating the photobleached area on the axial element that was followed through the experiment. As nuclei move through the experiment, the focal plane was adjusted to follow the indicated region of the bleached axial element, while other regions can be out of focus. n = 9 nuclei (REC-8::GFP), n = 11 nuclei (COH-3::GFP COH-4::GFP). Error bars indicate SEM. (G) High-resolution FRAP images of worms expressing REC-8::GFP (genotype: rec-8::GFP rec-8Δ) at indicated times before and after photobleaching the area indicated by the dashed rectangle. Note that 10 min after photobleaching there is no recovery of REC-8::GFP signal on bleached axial elements. (H) High-resolution FRAP images of worms expressing COH-3::mCherry and REC-8::GFP (genotype: coh-3::mCherry coh-3Δ rec-8::GFP rec-8Δ) at indicated times before and after photobleaching the area indicated by the dashed rectangle. Note that 10 min after photobleaching there is recovery of COH-3::mCherry signal on bleached axial elements. Scale bar = 5 µm in all panels.
-
Figure 1—source data 1
Source data for graphs in Figure 1B, D, E and F.
- https://cdn.elifesciences.org/articles/84138/elife-84138-fig1-data1-v2.xlsx
Figure 1—figure supplement 1
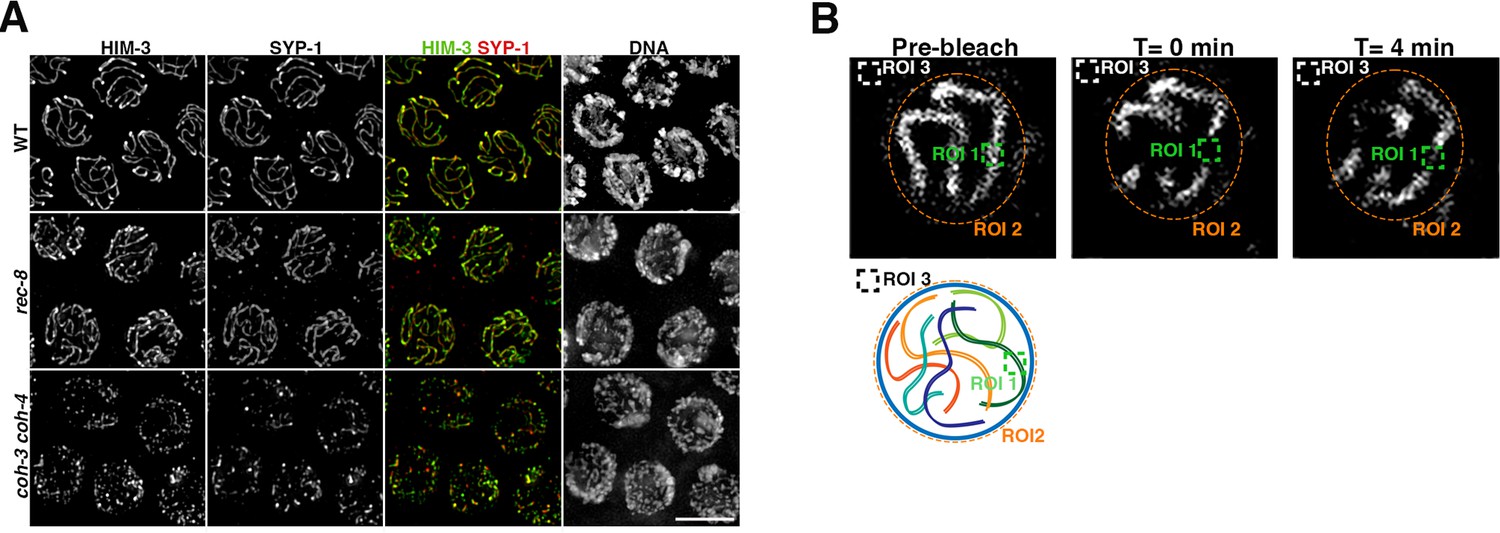
SC staining in kleisin mutants and regions of interest used for FRAP analysis.
(A) Projections of pachytene nuclei of indicated genotypes stained with anti-HIM-3 and anti-SYP-1 antibodies and DAPI. Note discontinuous HIM-3 and SYP-1 staining in coh-3 coh-4 double mutants. Scale bar = 5 µm. (B) Images from Fluorescence recovery after photobleaching (FRAP) experiment in coh-3::GFP coh-4::GFP worms indicating the three regions of interest (ROI) used to calculate FRAP. ROI 1 corresponds to the bleached region, ROI 2 was the whole nucleus and was used to normalise photobleaching with time due to imaging, and ROI 3 is a background region outside the nucleus. The three regions are also indicated in a cartoon of a pachytene nucleus.
Figure 2 with 1 supplement
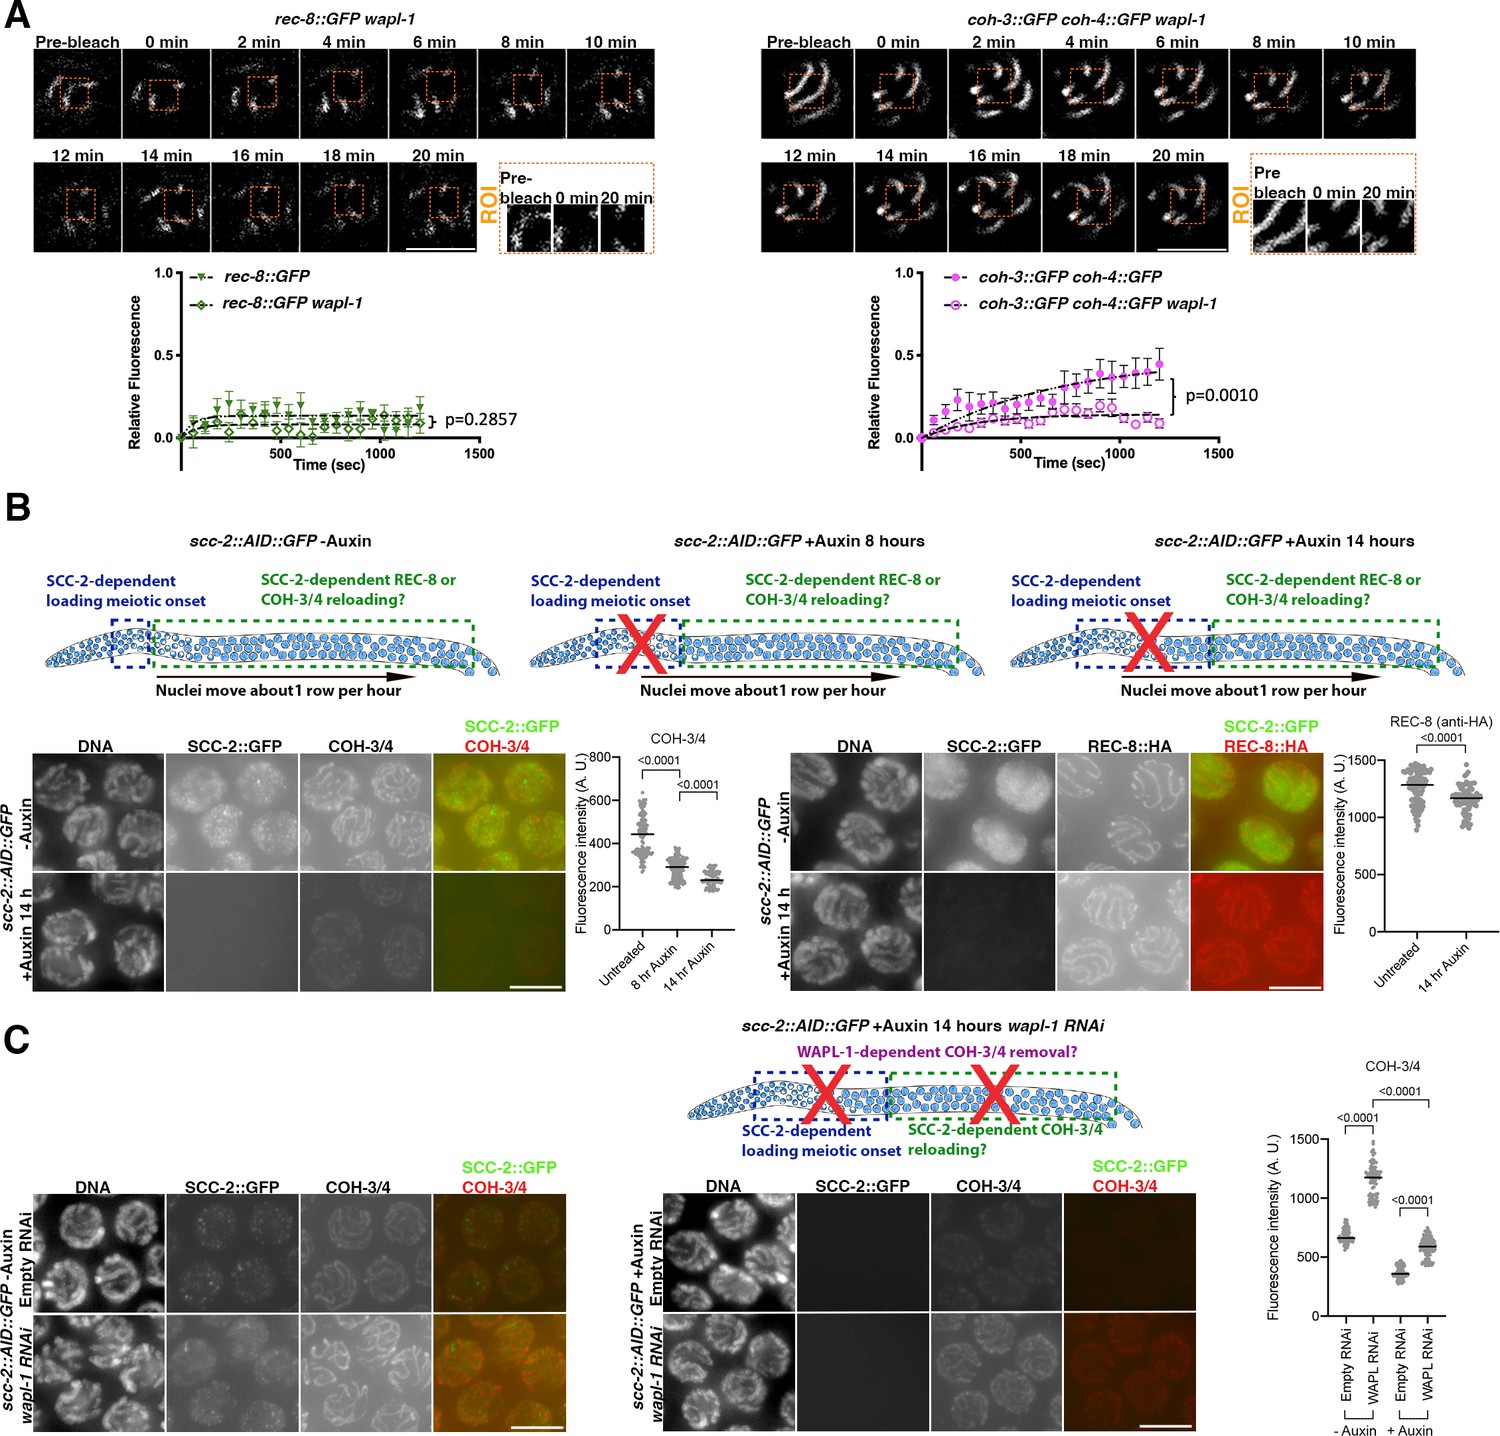
WAPL-1 and SCC-2 control the dynamic association of COH-3/4, but not REC-8, complexes with pachytene chromosomes.
(A) Fluorescence recovery after photobleaching (FRAP) analysis of REC-8::GFP and COH-3::GFP COH-4::GFP in pachytene nuclei of WT and wapl-1 mutants. Data for WT REC-8::GFP and WT COH-3::GFP COH-4::GFP is the same as shown in Figure 1D. Number of nuclei analysed: n = 9 (REC-8::GFP), n = 10 (REC-8::GFP wapl-1), n = 11 (COH-3::GFP COH-4::GFP), and n = 10 (COH-3::GFP COH-4::GFP wapl-1). Error bars indicate SEM, and p-values were calculated by Mann–Whitney tests between the Ymax predicted values of the one-phase association curves of individual experiments. (B) Effect of SCC-2 on REC-8 and COH-3/4 cohesin levels in pachytene nuclei. Diagrams on the top row of the panel indicate the population of nuclei affected by auxin-mediated SCC-2::AID::GFP depletion at different times of auxin exposure. Nuclei in regions marked by green rectangle underwent meiotic S-phase before auxin treatment, allowing the evaluation of a potential requirement of SCC-2 post S-phase. Projections of raw images from pachytene nuclei from scc-2::AID::GFP (left) and scc-2::AID::GFP rec-8::HA (right) from control worms (untreated) and from worms treated with 4 mM auxin for 14 hr. Nuclei from worms of the same genotype were acquired under the same exposure conditions and panels were adjusted with the same settings to allow direct comparison of -auxin and +auxin images. SCC-2::GFP was visualised using anti-GFP antibodies, COH-3/4 using anti-COH-3/4 antibodies, and REC-8 using anti-HA antibodies. As REC-8::HA and COH-3/4 were visualised with different antibodies, their relative staining intensity is not directly comparable, or comparable to those on Figure 1B in which REC-8, COH-3, and COH-4 were all tagged with GFP and visualised using anti-GFP antibodies. SCC-2::AID::GFP was efficiently depleted following auxin treatment, inducing strong decrease of COH-3/4 but not REC-8::HA signal. Graphs show quantification of whole-nucleus mean intensity in projections of pachytene nuclei before and after auxin treatment. Number of nuclei analysed: COH-3/4 (133 untreated, 193 +auxin 8 hr, 96 +auxin 14 hr) REC-8 (105 untreated, 89 +auxin), lines indicate median and p-values were calculated by two-tailed Mann–Whitney U test. (C) Effect of removing SCC-2::AID::GFP from germlines lacking WAPL-1. Diagram shows nuclei affected by SCC-2::AID::GFP depletion 14 hr after auxin treatment. Projections of raw images from pachytene nuclei from scc-2::AID::GFP of indicated treatments (+/-auxin, +/-wapl-1 RNAi) acquired under the same exposure conditions and adjusted with the same settings to allow direct comparison of anti-COH-3/4 staining in all conditions. Quantification of whole-nucleus mean intensity shows that SCC-2 prevents WAPL-1-dependent and -independent COH-3/4 removal. Number of nuclei analysed: -auxin empty RNAi (79), -auxin wapl-1 RNAi (80), +auxin empty RNAi (173), +auxin wapl-1 RNAi (113), lines indicate median and p-values were calculated by two-tailed Mann–Whitney U test. Scale bar = 5 µm in all panels.
-
Figure 2—source data 1
Source data for graphs in Figure 2A–C.
- https://cdn.elifesciences.org/articles/84138/elife-84138-fig2-data1-v2.xlsx
Figure 2—figure supplement 1
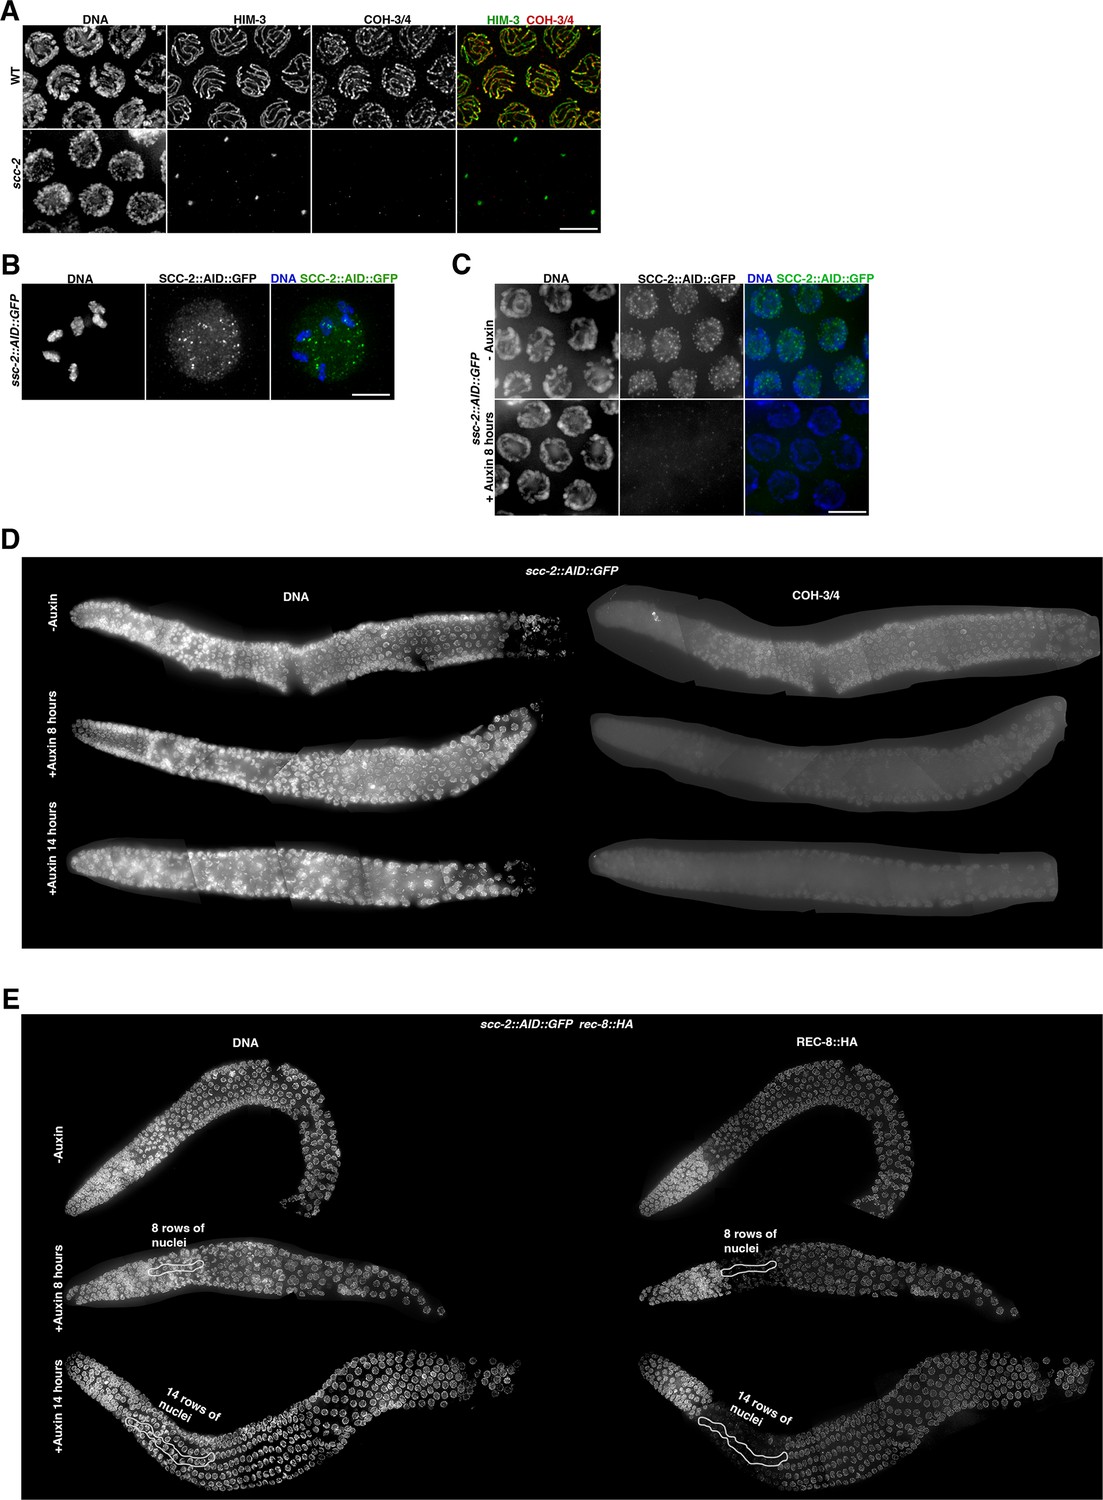
Effect of SCC-2 depletion on pachytene nuclei.
(A) Projections of pachytene nuclei of indicated genotypes stained with anti-HIM-3 and anti-COH-3/4 antibodies and DAPI. Note HIM-3 and COH-3/4 do not associate with chromosomes in scc-2(fq1) mutants. (B) Projection of diakinesis oocyte from an scc-2::AID::GFP worm not treated with auxin stained with anti-GFP antibodies and DAPI. Note the presence of six bivalents indicating normal chiasma formation. (C) Projections of pachytene nuclei from scc-2::AID::GFP worms stained with anti-GFP antibodies and DAPI. Note that auxin treatment for 8 hr induces efficient depletion of SCC-2::AID::GFP. (D) Whole germline projections from raw images of scc-2::AID::GFP worms stained with anti-COH-3/4 antibodies and DAPI. Images were acquired under the same exposure conditions and adjusted with the same settings to allow direct comparison of anti-COH-3/4 staining in all conditions. Note reduction of anti-COH-3/4 signal intensity in all regions of meiotic prophase after 8 hr of auxin treatment and a further reduction in signal intensity in the germline treated with auxin for 14 hr. (E) Whole germline projections from deconvolved images of scc-2::AID::GFP rec-8::HA worms stained with DAPI and anti-HA antibodies. Note that auxin treatment for 8 hr induces loss of REC-8-labelled axial elements in about eight rows of nuclei (indicated by area outlined with white line) in early meiotic prophase, and that auxin treatment for 14 hr extends this to a larger region of about 14 rows of nuclei. Nuclei in mid and late pachytene, which underwent meiotic S-phase before SCC-2::AID::GFP depletion, retain strong REC-8::HA staining on axial elements. Scale bar = 5 µm in all panels.
Figure 3 with 1 supplement
REC-8 complexes provide sister chromatid cohesion (SCC).
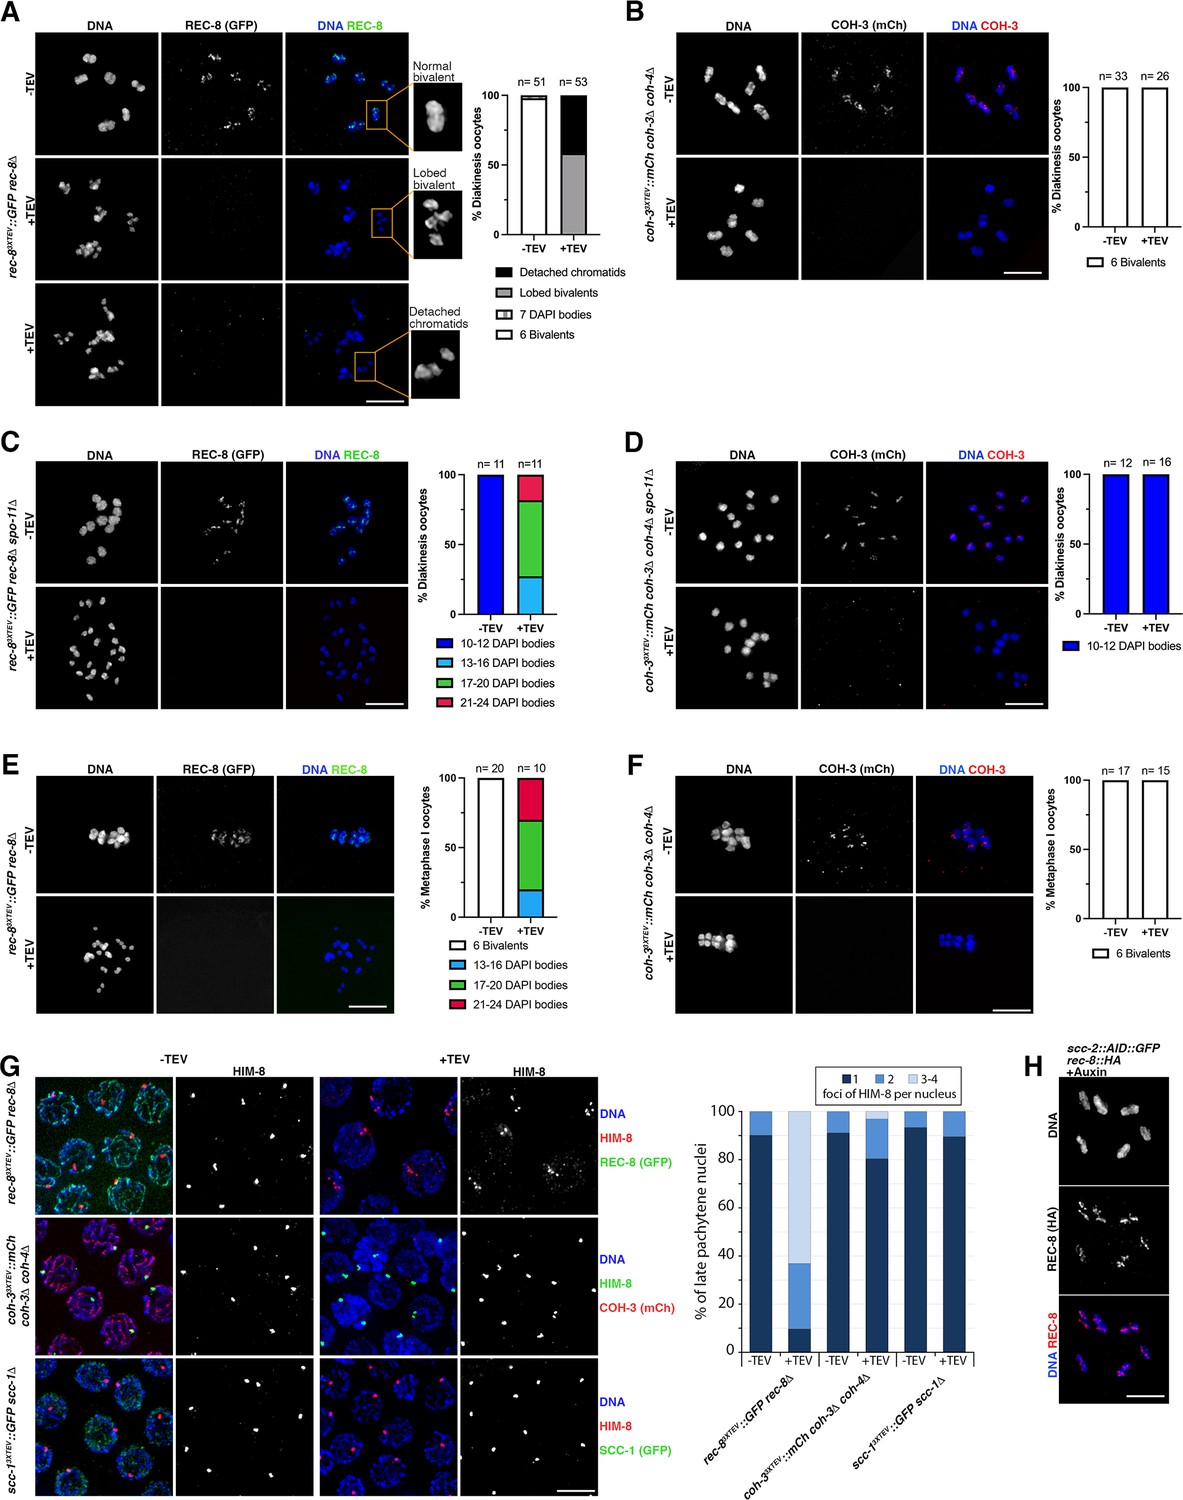
(A–D) Diakinesis oocytes of indicated genotypes stained with DAPI and anti-GFP (REC-8) or anti-mCherry (COH-3) antibodies from untreated controls (-TEV) and 3.5 hr post TEV-mediated kleisin removal. Note that REC-8 removal transforms bivalents into lobed structures (middle panel in A) and also induces appearance of detached chromatids (bottom panel in A). Bivalent morphology remains unaffected by COH-3 removal (B). See magnified bivalents in (A) for examples of the different morphological categories used for the quantification of diakinesis oocytes. (C, D) REC-8, but not COH-3, removal induces separation of sister chromatids in spo-11 mutant oocytes. (E, F) Metaphase I-arrested oocytes (apc-2 RNAi) stained with DAPI and anti-GFP (REC-8) or anti-mCherry (COH-3) antibodies from untreated controls (-TEV) and 3.5 hr post-TEV-mediated kleisin removal. Note separation of sister chromatids following REC-8, but not COH-3, removal. (G) Late pachytene nuclei stained with DAPI, anti-HIM-8 antibodies, and anti-GFP (REC-8 or SCC-1) or anti-RFP (COH-3) antibodies from untreated controls (-TEV) and 3.5 hr following TEV-mediated kleisin removal. Note that removal of REC-8, but not COH-3 or SCC-1, leads to the appearance of nuclei with three or four HIM-8 foci, indicating separation of sister chromatids. Number of nuclei analysed = REC-8 (92 -TEV, 92 +TEV), COH-3 (135 -TEV, 128 +TEV), and SCC-1 (67 -TEV, 143 +TEV). (H) Diakinesis oocytes of scc-2::AID::GFP rec-8::HA worms exposed to auxin for 14 hr to induce SCC-2 depletion stained with DAPI and anti-HA (REC-8) antibodies. Note the presence of six bivalents displaying normal REC-8 staining and intact SCC. Scale bar = 5 µm in all panels.
-
Figure 3—source data 1
Source data for graphs in Figure 3A–G.
- https://cdn.elifesciences.org/articles/84138/elife-84138-fig3-data1-v2.xlsx
Figure 3—figure supplement 1
Effect of removing different cohesin subunits in diakinesis and metaphase I oocytes.
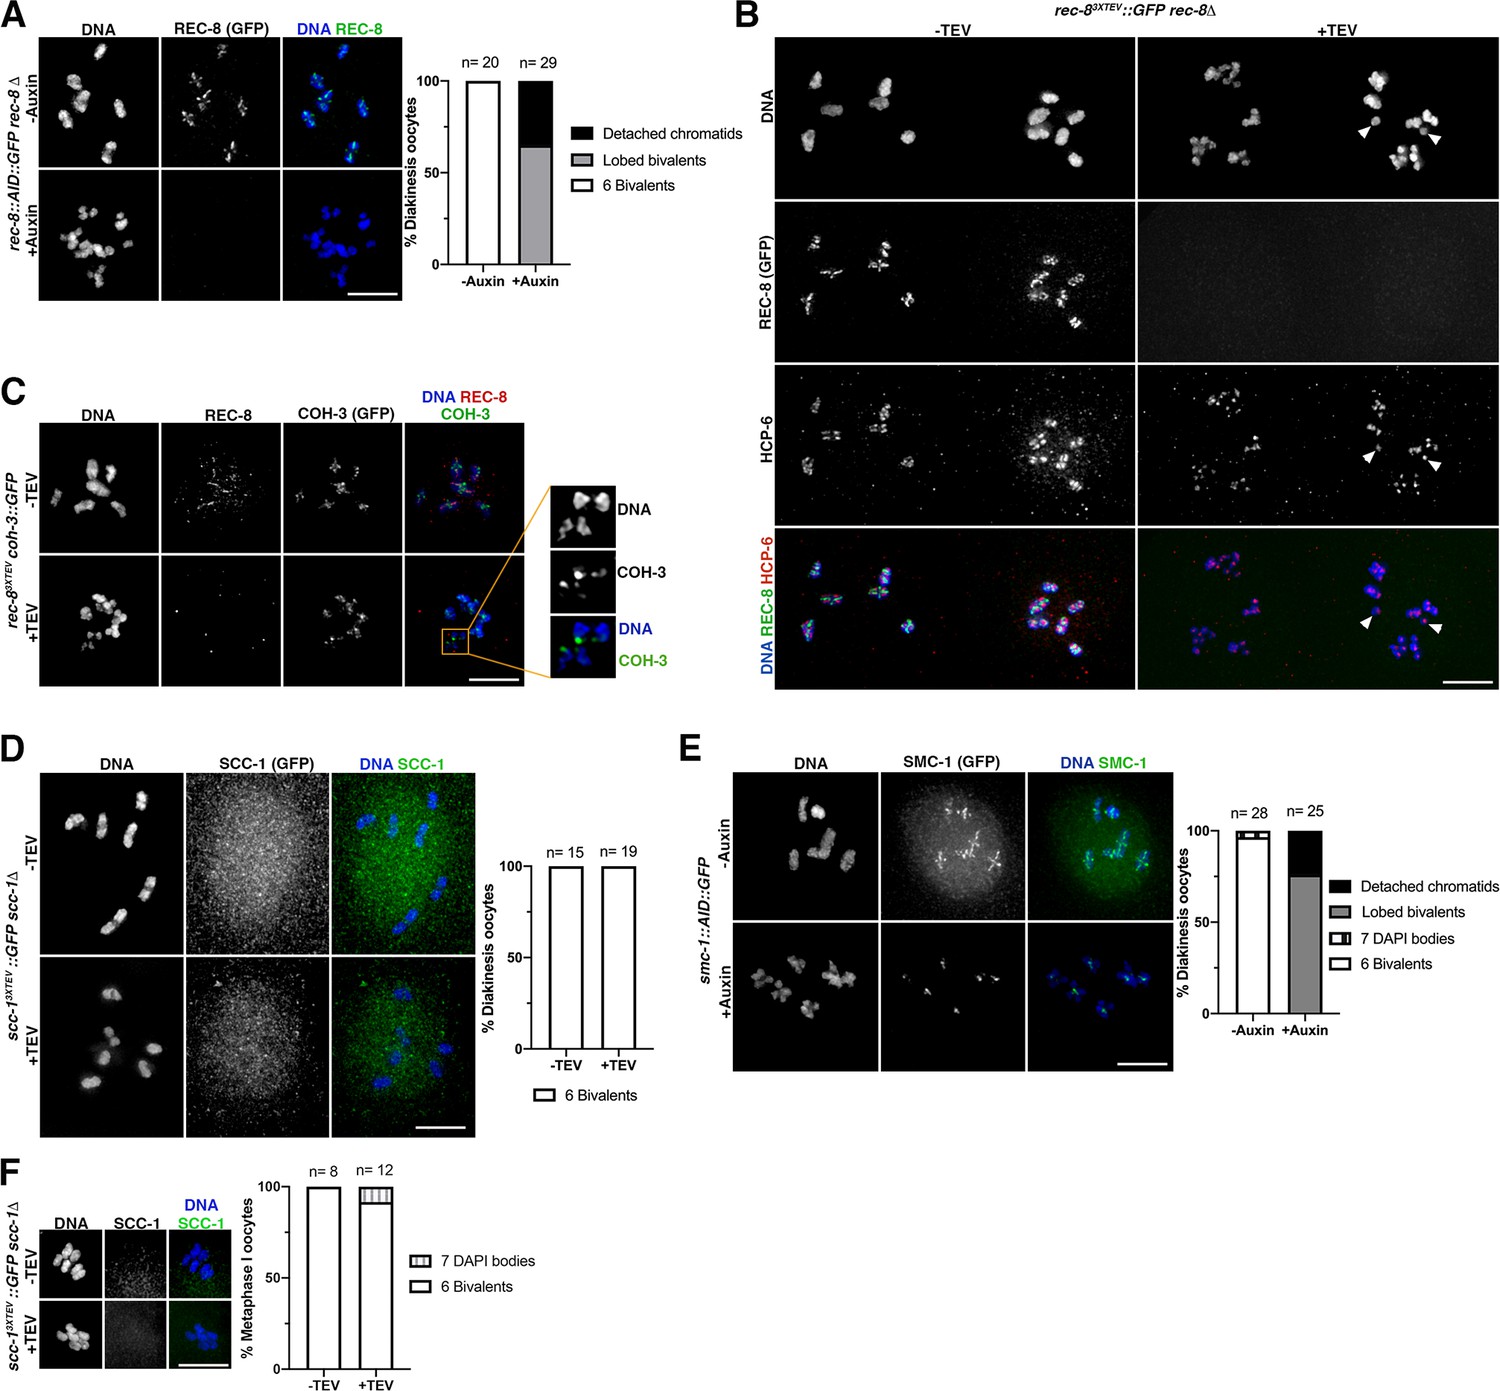
(A) Diakinesis oocytes of rec-8::AID::GFP worms stained with DAPI and anti-GFP antibodies from control worms (-Auxin) or from worms exposed to auxin for 8 hr (+Auxin), which induces loss of GFP signal (REC-8) and the appearance of lobed bivalents and detached chromatids. (B) Diakinesis oocytes of rec-83XTEV::GFP rec-8Δ worms stained with DAPI, anti-GFP, and anti-HCP-6 (condensin II) antibodies from untreated controls (-TEV) and 3.5 hr after TEV-mediated REC-8 removal. Note that HCP-6 signals remain associated with both partially and fully separated (arrowheads) chromatids following REC-8 removal. (C) Diakinesis oocytes of rec-83XTEV coh-3::GFP worms (both alleles generated by CRISPR) stained with DAPI, anti-GFP, and anti-REC-8 antibodies from untreated controls (-TEV) and 3.5 hr after TEV-mediated REC-8 removal. Note that COH-3 signal remains associated with chromosomes following REC-8 removal, including with fully detached chromatids (inset). (D) Diakinesis oocytes of scc-13XTEV::GFP scc-1Δ worms stained with DAPI, anti-GFP antibodies from untreated controls (-TEV) and 3.5 hr after TEV-mediated SCC-1 removal. Bivalents remain intact in TEV-treated oocytes. (E) Diakinesis oocytes of smc-1::AID::GFP worms stained with DAPI and anti-GFP antibodies from control worms (-Auxin) or from worms exposed to auxin for 8 hr. Note that auxin treatment results in the appearance of lobed bivalents and large loss of GFP signal, apart from small signals associated with the chiasma site. (F) Metaphase I-arrested oocytes of scc-13XTEV::GFP scc-1Δ worms stained with DAPI and anti-GFP antibodies from untreated controls (-TEV) and 3.5 hr after TEV-mediated SCC-1 removal. Bivalents remain intact following SCC-1 removal. Scale bar = 5 µm in all panels.
-
Figure 3—figure supplement 1—source data 1
Source data for graphs in Figure 3—figure supplement 1A, D, E, and F.
- https://cdn.elifesciences.org/articles/84138/elife-84138-fig3-figsupp1-data1-v2.xlsx
Figure 4
REC-8 complexes promote double-strand break (DSB) repair.
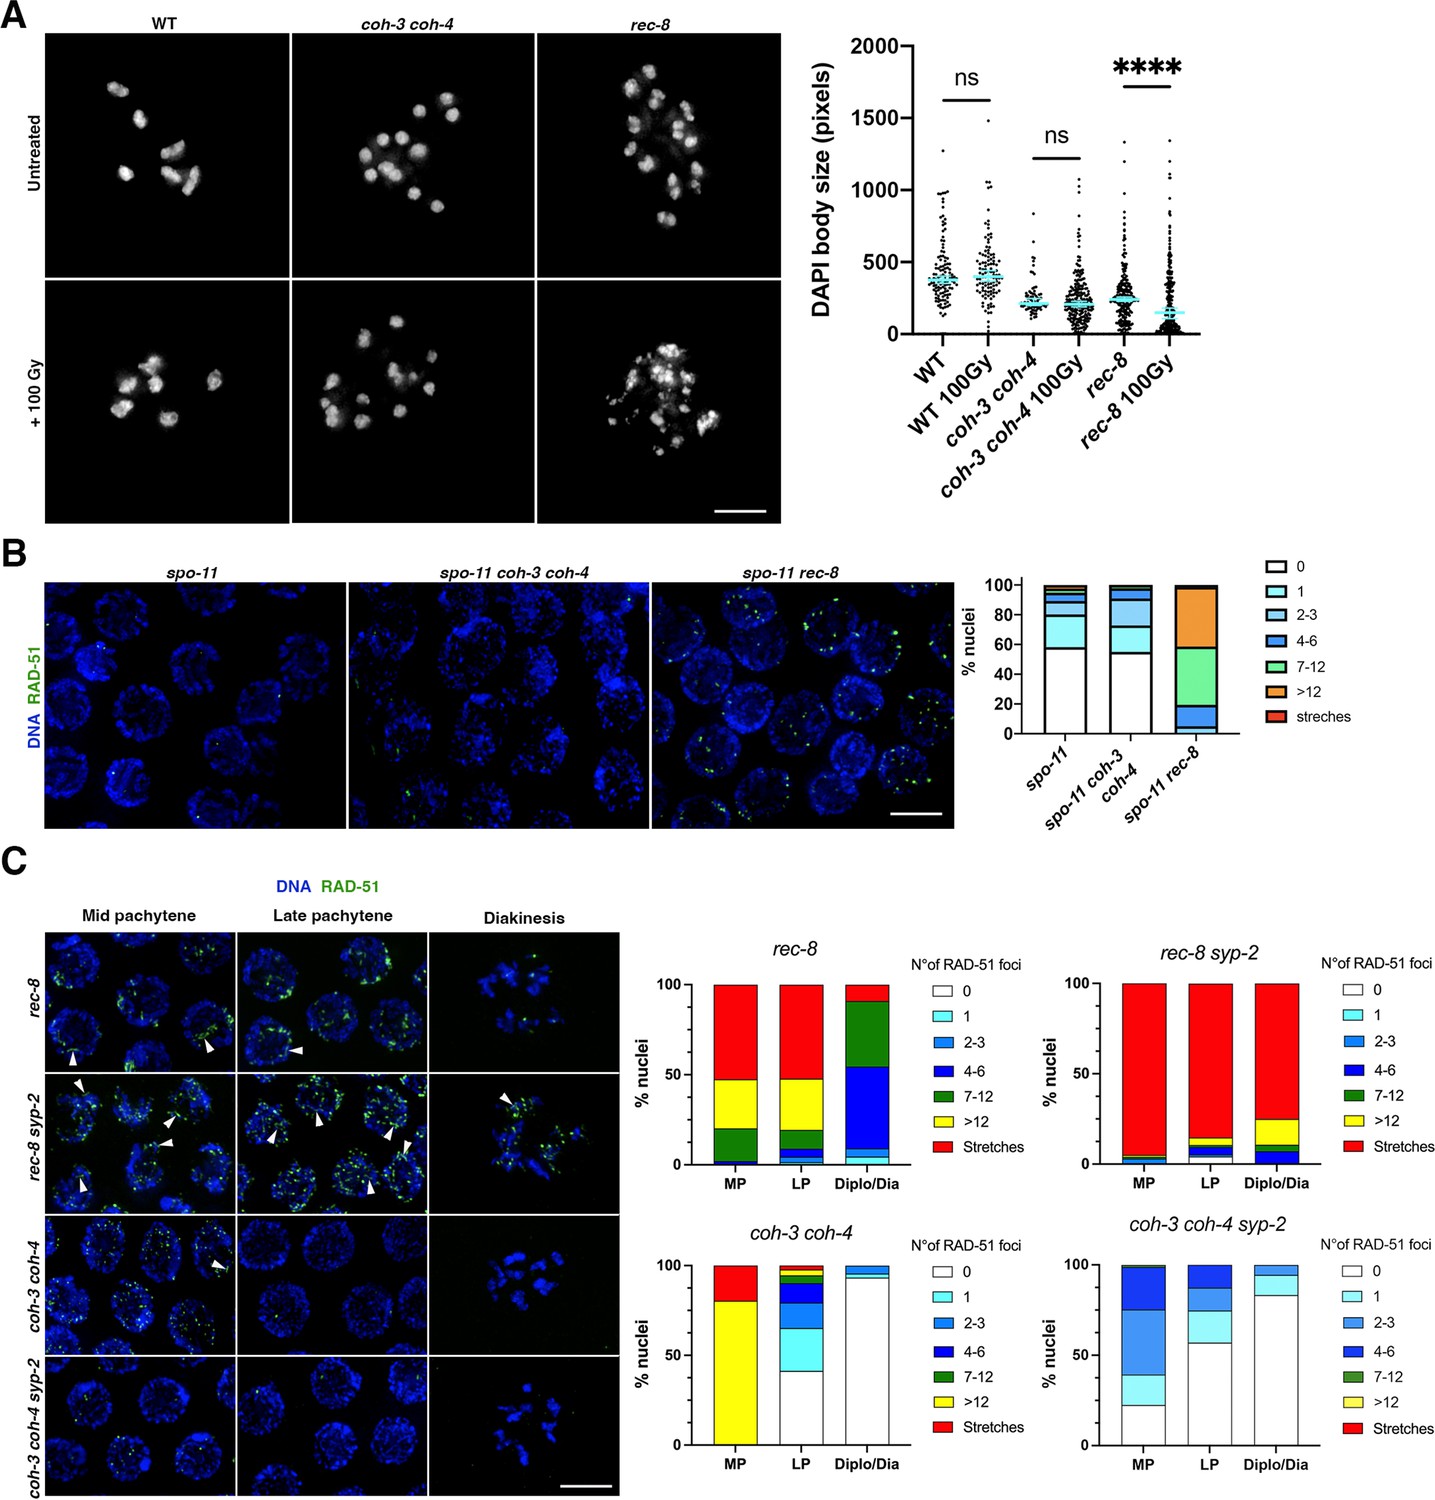
(A) Diakinesis oocytes of indicated genotypes stained with DAPI in untreated controls and 26 hr after worms were exposed to 100 Gy of IR. Note the extensive appearance of small chromatin bodies in rec-8 mutants, which indicate chromosome fragmentation. Graphs show the distribution of DAPI-stained bodies with a given area in full nucleus projections of diakinesis oocytes. Number of oocytes: WT n = 22 oocytes (0 Gy), n = 19 (100 Gy); rec-8 n = 20 (0 Gy), n = 16 (100 Gy); coh-3 coh-4 n = 7 (0 Gy), n = 22 (100 Gy). Error bars indicate median with 95% CI, p-values were calculated by two-tailed Mann–Whitney test. (B) Late pachytene nuclei of indicated genotypes stained with DAPI and anti-RAD-51 antibodies 24 hr after worms were exposed to 10 Gy of IR. Note high number of RAD-51 foci in rec-8 spo-11, but not in spo-11 coh-3 coh-4 or spo-11 mutants. Number of nuclei analysed = 298 (spo-11), 276 (spo-11 coh-3 coh-4), and 237 (spo-11 rec-8). (C) Nuclei of indicated genotypes stained with DAPI and anti-RAD-51 antibodies. Note much higher numbers of RAD-51 foci in rec-8 syp-2 compared to coh-3 coh-4 syp-2. Arrowheads point to examples of elongated RAD-51 structures (stretches). Graphs show the percentage of nuclei with a given number of RAD-51 foci at the indicate stages (mid pachytene [MP], late pachytene [LP], diplotene/diakinesis [Diplo/Dia]) and genotypes. Number of nuclei analysed: rec-8 (99 MP, 67 LP, 22 Diplo/Dia); coh-3 coh-4 (102 MP, 92 LP, 45 Diplo/Dia); rec-8 syp-2 (100 MP, 95 LP, 28 Diplo/Dia); coh-3 coh-4 syp-2 (89 MP, 79 LP, 18 Diplo/Dia). Nuclei from three germlines per genotype were included in the quantification, nuclei from the –1 and –2 diakinesis oocytes were not included. Scale bar = 5 µm in all panels.
-
Figure 4—source data 1
Source data for graphs in Figure 4A–C.
- https://cdn.elifesciences.org/articles/84138/elife-84138-fig4-data1-v2.xlsx
Figure 5
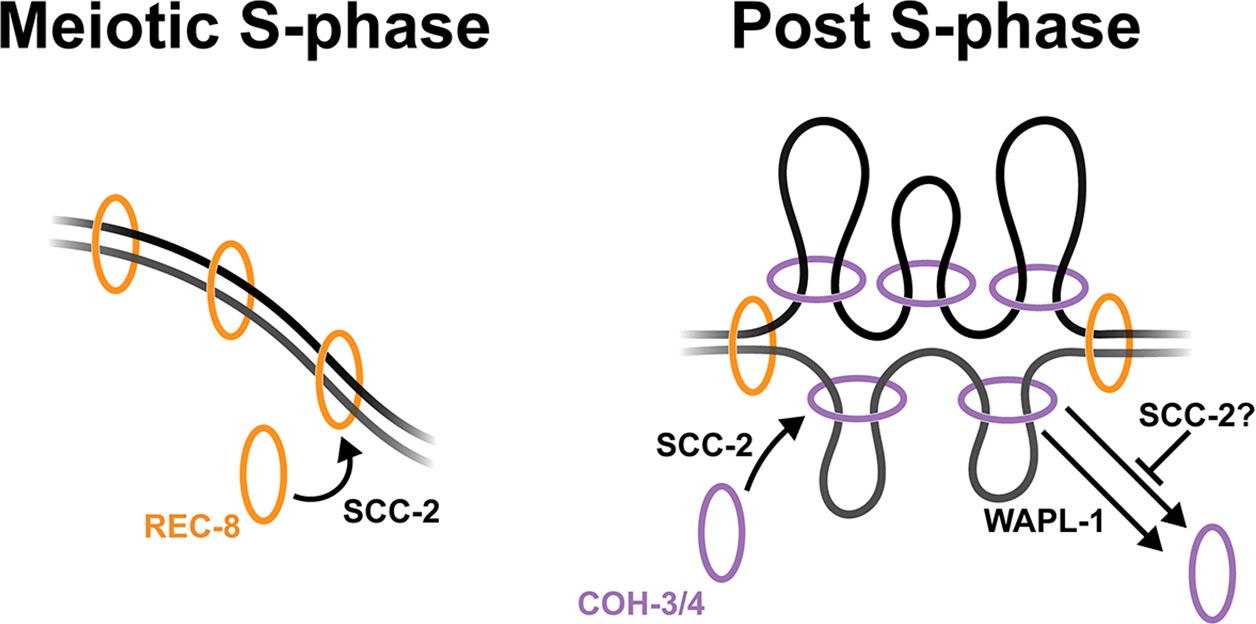
Model of functional specialisation of REC-8 and COH-3/4 cohesin.
SCC-2-dependent loading of REC-8 cohesin during S-phase establishes sister chromatid cohesion. Non-cohesive COH-3/4 cohesin associates dynamically with individual chromatids post S-phase to control higher-order chromosome organisation in a process mediated by the loading and removal activities of SCC-2 and WAPL-1. SCC-2 may also act to prevent WAPL-1-independent removal of COH-3/4 cohesin.
Tables
Table 1
C. elegans strains used in this study.
| Strain | Genotype | Origin |
|---|---|---|
| ATG473 | rec-8(syb803 [rec-8::GFP]) IV | This study |
| ATG472 | coh-3(syb751 [coh-3::GFP]) V | This study |
| ATG556 | coh-4(syb1273 [coh-4::GFP]) V | This study |
| ATG707 | coh-4(syb1273 [coh-4::GFP]) coh-3(syb751 [coh-3::GFP]) V | This study |
| ATG228 | smc-1 fq20 [smc-1::GFP] I | Crawley |
| ATG252 | smc-1 fq20 [smc-1::GFP] I; rec-8(ok978) IV / nT1 [qls51] (IV;V) | This study |
| ATG253 | smc-1 fq20 [smc-1::GFP] I; coh-4(tm1857) coh-3(gk112) V / nT1 [qls51] (IV;V) | This study |
| ATGSi23 | fqSi23 II; rec-8 (ok978) IV | Crawley et al., 2016 |
| ATGSi191 | fqSi18 I; fqSi23 II; rec-8 (ok978) IV; coh-3 (gk112) V | This study |
| ATGSi521 | fqSi25 scc-1(ok1017) II | This study |
| ATG571 | wapl-1(tm1814) rec-8(syb803 [rec-8::GFP]) IV /nT1 [unc-? (n754) let-? qls50] (IV;V) | This study |
| ATG570 | wapl-1(tm1814) IV; coh-3(syb751 [coh-3::GFP]) V /nT1 [unc-? (n754) let-? qls50] (IV;V) | This study |
| ATG572 | wapl-1(tm1814) IV; coh-4(syb1273 [coh-4::GFP]) coh-3(syb751 [coh-3::GFP]) V //nT1 [unc-? (n754) let-? qls50] (IV;V) | This study |
| ATG282 | scc-2(fq23 [scc-2::AID::GFP]) II; ieSi38 IV | This study |
| ATG693 | scc-2(fq23 [scc-2::AID::GFP]) II; ieSi38 rec-8(fq169[rec-8::3XHA]) IV | This study |
| ATGSi355 | fqSi16 II; rec-8(ok978) IV | Castellano-Pozo et al., 2020 |
| ATGSi441 | fqSi15 II; coh-4(1857) coh-3(gk112) V | Castellano-Pozo et al., 2020 |
| ATGSi392 | fqSi16 II; rec-8(ok978) spo-11(ok79) IV / nT1 [qls51] (IV;V) | This study |
| ATGSi470 | fqSi15 II; spo-11(ok79) IV; coh-4(1857) coh-3(gk112) V / nT1 [unc-? (n754) let-? qls50] (IV;V) | This study |
| ATG323 | fqSi17 II; ieSi38 rec-8(ok978) IV | Castellano-Pozo et al., 2020 |
| ATG541 | rec-8(fq32[rec-8::TEV]) IV; coh-3(syb751[coh-3::GFP]) | This study |
| ATG415 | smc-1 (fq64[smc-1::AID::GFP]) I; ieSi38 IV | Castellano-Pozo et al., 2020 |
| TY5120 | coh-4(tm1857) coh-3(gk112) V/nT1 [qls51] (IV;V) | CGC |
| VC666 | rec-8(ok978) IV/nT1 [qls51] (IV;V) | CGC |
| AV106 | spo-11(ok79) IV/nT1 [unc-? (n754) let-?] (IV;V) | CGC |
| ATG137 | rec-8(ok978) IV; spo-11(ok79) IV/ nT1 [qls51] (IV;V) | Crawley et al., 2016 |
| ATG213 | spo-11(ok79) IV; coh-4(tm1857) coh-3(gk112) V/ nT1 [unc-? (n754) let-?] (IV;V) | Crawley et al., 2016 |
| ATG83 | rec-8(ok978); syp-2(ok307)/nT1 [unc-? (n754) let-? qls50] (IV;V) | This study |
| ATG186 | syp-2(ok307) coh-4(tm1857) coh-3(gk112)/nT1 [unc-? (n754) let-? qls50] (IV;V) | Crawley et al., 2016 |
Table 2
Transgenes used in this study.
| Transgene | Genotype |
|---|---|
| fqSi23 | [Prec-8 rec-8::GFP 3’UTR rec-8; cb-unc-119(+)] |
| fqSi18 | [Pcoh-3 coh-3::mCherry 3’UTR coh-3; cb-unc-119(+)] |
| ieSi38 | [Psun-1 TIR1::mRuby 3’UTR sun-1; cb-unc-119(+)] |
| fqSi16 | [Prec-8 rec-83XTEV::GFP 3’UTR rec-8; cb-unc-119(+)] |
| fqSi15 | [Pcoh-3 coh-3::3XTEV::mCherry 3’UTR coh-3; cb-unc-119(+)] |
| fqSi17 | [Prec-8 rec-8::AID::GFP 3’UTR rec-8; cb-unc-119(+)] |
| fqSi25 | [Pscc-1 scc-13XTEV 3’UTR scc-1; cb-unc119(+)] |
Additional files
Download links
A two-part list of links to download the article, or parts of the article, in various formats.
Downloads (link to download the article as PDF)
Open citations (links to open the citations from this article in various online reference manager services)
Cite this article (links to download the citations from this article in formats compatible with various reference manager tools)
The kleisin subunit controls the function of C. elegans meiotic cohesins by determining the mode of DNA binding and differential regulation by SCC-2 and WAPL-1
eLife 12:e84138.
https://doi.org/10.7554/eLife.84138


