Zn2+ is essential for Ca2+ oscillations in mouse eggs
- Department of Veterinary and Animal Sciences, University of Massachusetts Amherst, United States
- Molecular and Cellular Biology Graduate Program, University of Massachusetts, United States
Figures
Figure 1 with 1 supplement
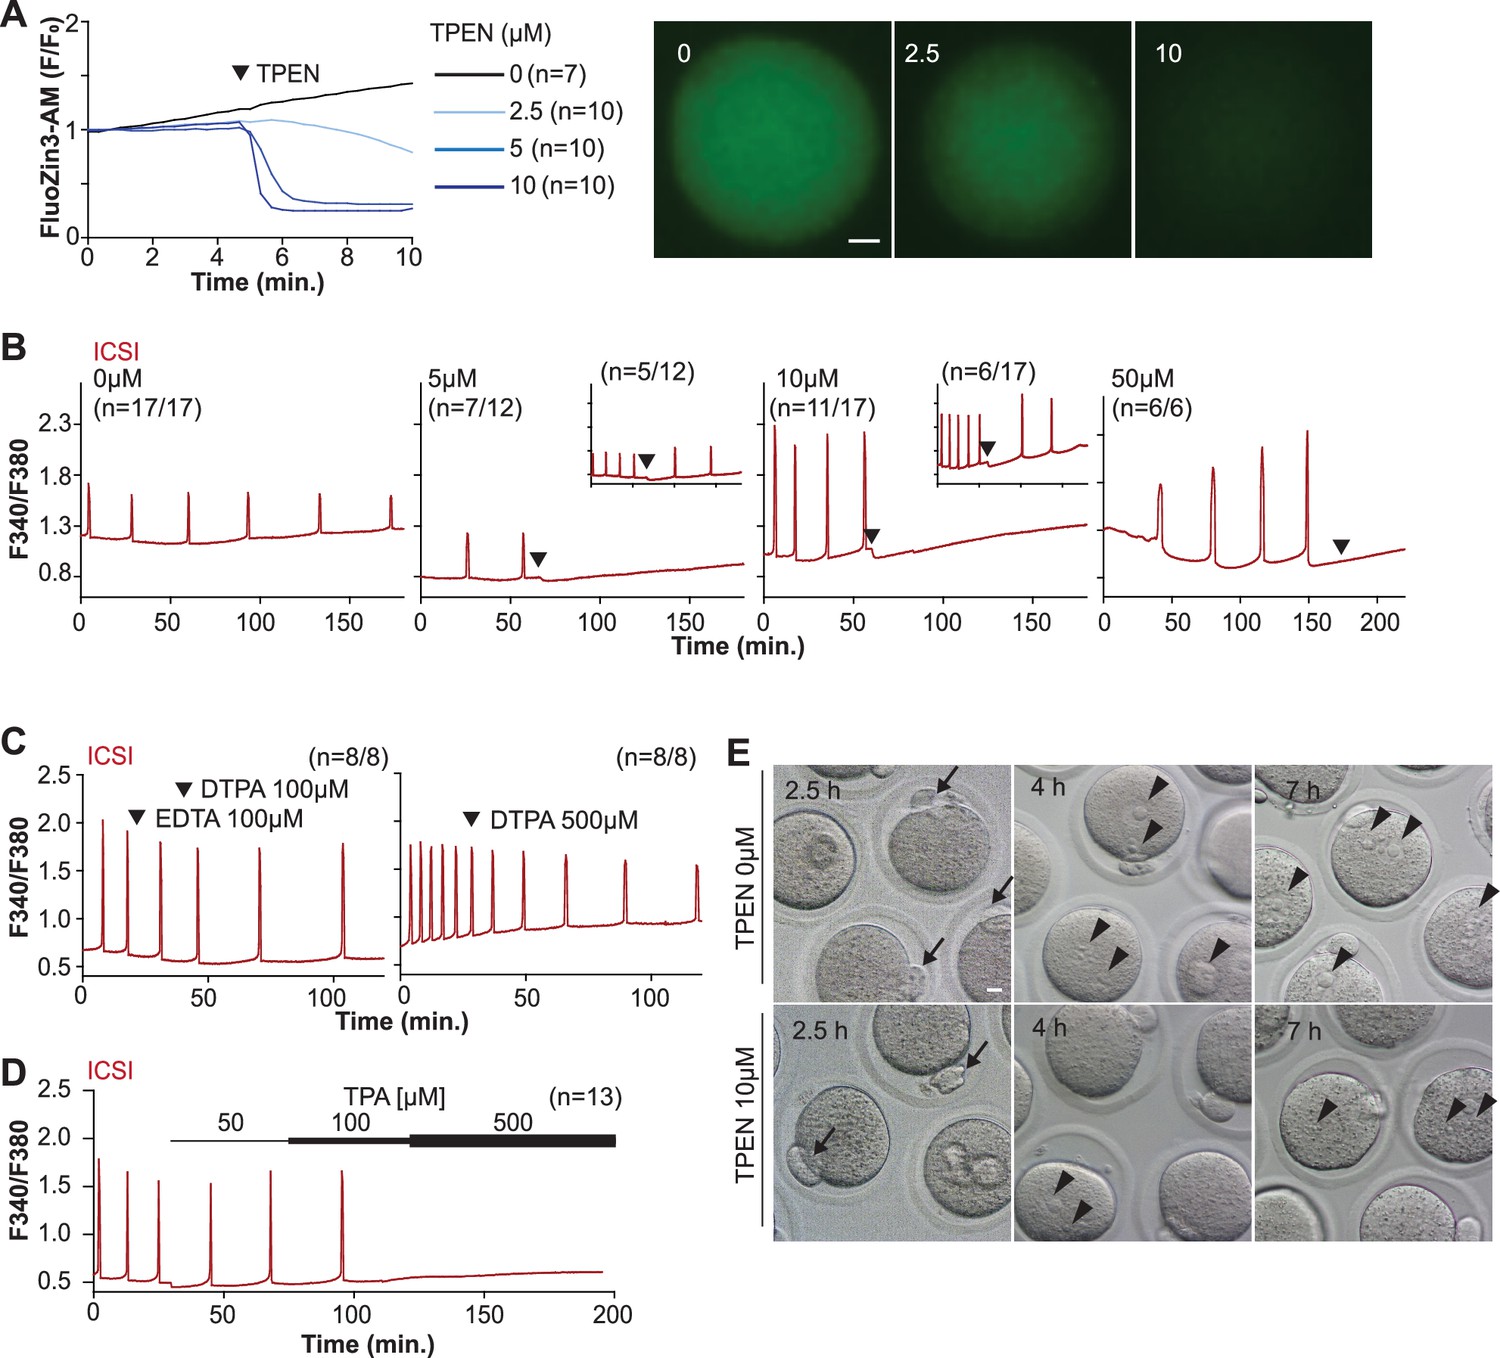
TPEN-induced Zn2+ deficiency inhibits fertilization-initiated Ca2+ oscillations in a dose-dependent manner.
(A) Left panel: representative normalized Zn2+ recordings of MII eggs loaded with FluoZin-3AM following the addition of increasing concentrations of TPEN (0 µM, DMSO, black trace; 2.5 µM, sky blue; 5 µM, blue; 10 µM, navy). TPEN was directly added to the monitoring media. Right panel: representative fluorescent images of MII eggs loaded FluoZin-3AM supplemented with 0, 2.5, and 10 µM of TPEN. Scale bar: 10 µm. (B–D) (B) Representative Ca2+ oscillations following intracytoplasmic sperm injection (ICSI) after the addition of 0, 5, 10, or 50 µM TPEN (arrowheads). Insets show representative traces for eggs that resumed Ca2+ oscillations after TPEN. (C) As above, but following the addition of 100 µM EDTA, 100 or 500 µM DTPA (time of addition denoted by arrowheads). (D) Ca2+ oscillations following ICSI after the addition of 50, 100, and 500 µM TPA (horizontal bars of increasing thickness). (E) Representative bright field images of ICSI-fertilized eggs 2.5, 4, and 7 hr after sperm injection. Arrows and arrowheads denote the second polar body and pronuclear (PN) formation, respectively. Scale bar: 10 µm.
Figure 1—figure supplement 1

Cell-impermeable chelators effectively reduce Zn2+ levels in external media but do prevent initiation or continuation of Ca2+ oscillations.
(A) A representative trace of FluoZin3 fluorescence in replete monitoring media (TL-HEPES). The media was supplemented with cell-impermeable FluoZin-3, and after initiation of monitoring, the addition of EDTA (100 μM) occurred at the designated point (triangle). (B) The left black trace represents Ca2+ oscillations initiation by injection of mPlcz1 mRNA (0.01 μg/μl). The oscillations were monitored in Ca2+ and Mg2+-free media and in the presence of EDTA (110 μM) to chelate residual divalent cations derived from the water source or reagents used to make the media. The right red trace represents the initiation of oscillations as above, but after a period indicated by the black and green bars, Ca2+ and Mg2+ were sequentially added back.
Figure 2
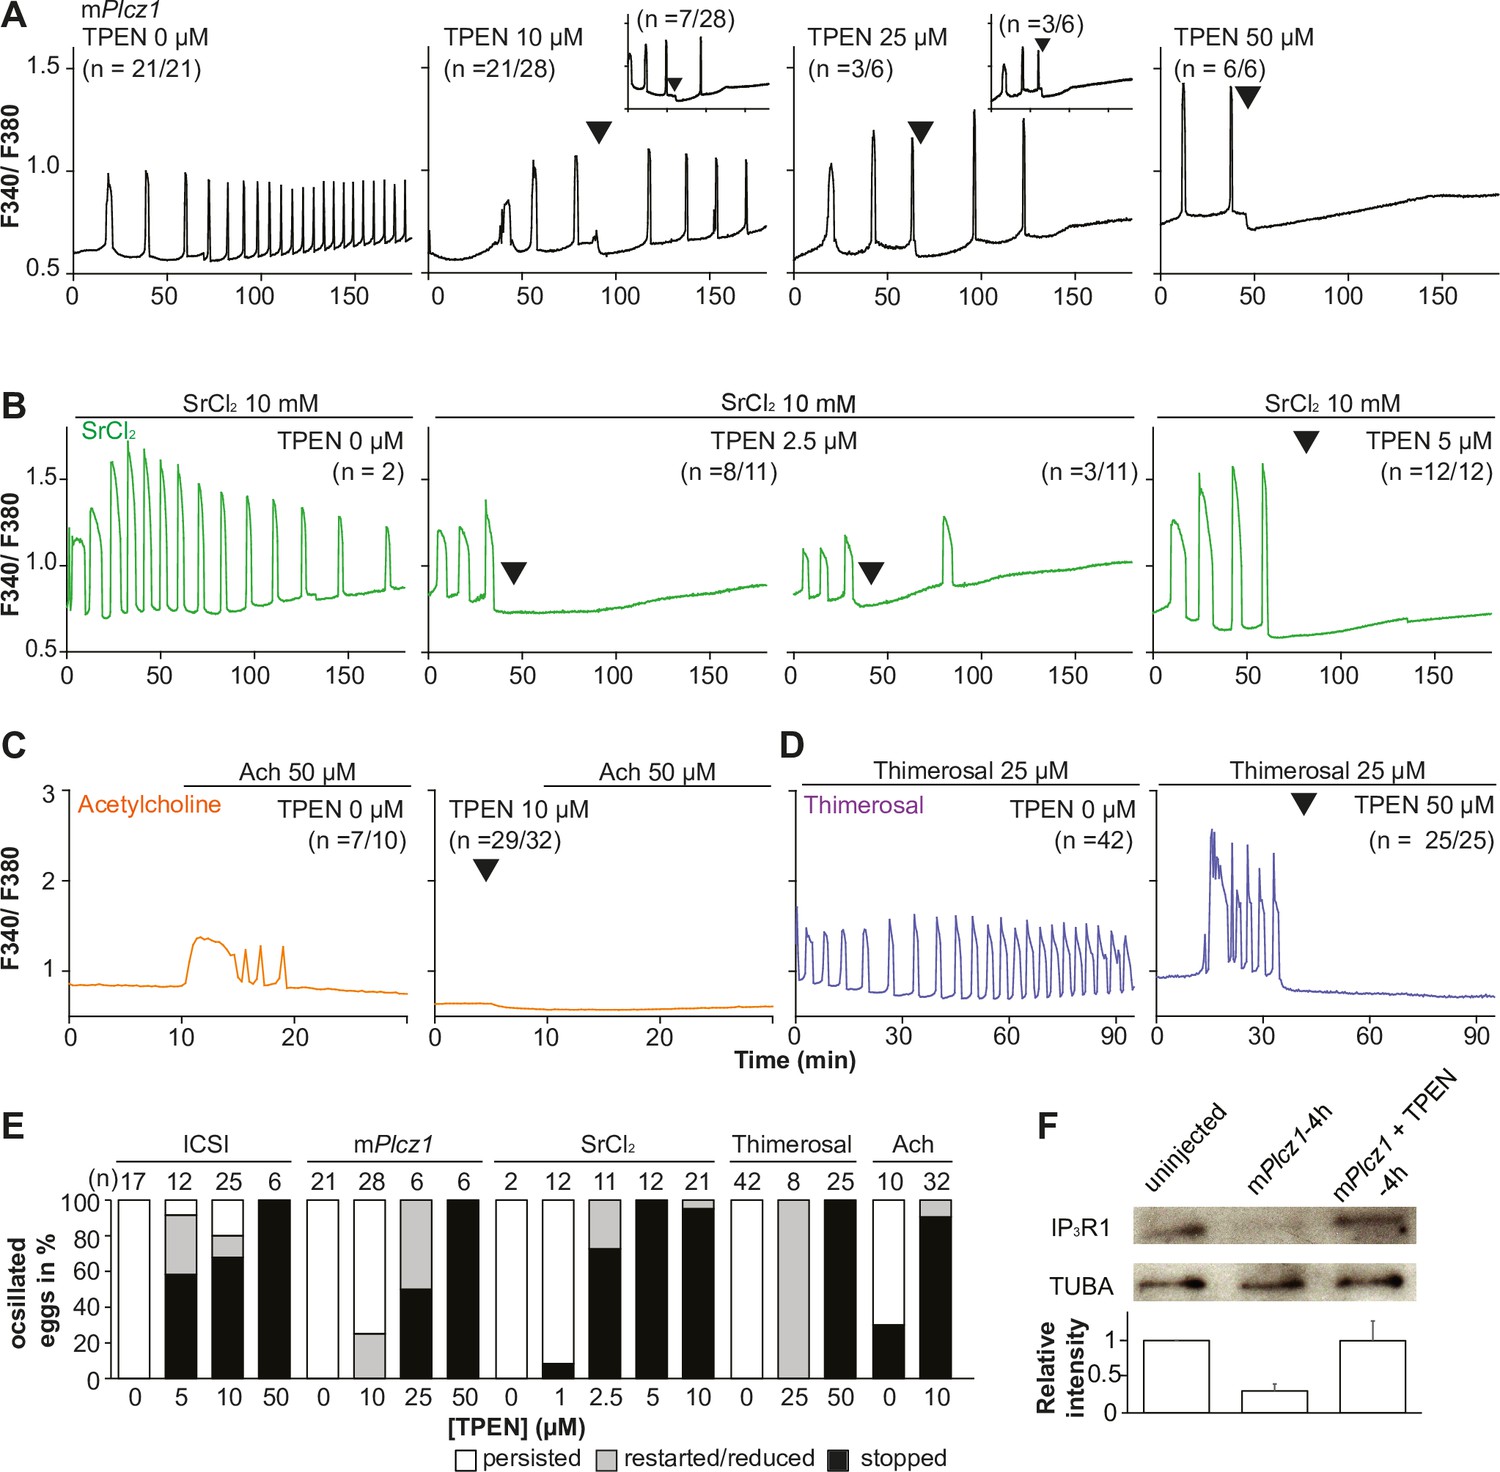
TPEN dose-dependently inhibits Ca2+ oscillations in eggs triggered by a broad spectrum of agonists that stimulate the PI pathway or IP3R1.
(A–D) Representative Ca2+ responses induced by (A) mPlcz1 mRNA microinjection (0.01 µg/µl, black traces), (B) strontium chloride (10 mM, green), (C) acetylcholine chloride (50 µM, orange), and (D) thimerosal (25 µM, purple) in MII eggs. Increasing concentrations of TPEN were added to the monitoring media (arrowheads above traces denotes the time of adding). Insets in the upper row show representative traces of eggs that stop oscillating despite others continuing to oscillate. (E) Each bar graph summarizes the TPEN effect on Ca2+ oscillations at the selected concentrations for each of the agonists in (A–D). (F) Western blot showing the intensities of IP3R1 and alpha-tubulin bands in MII eggs or in eggs injected with mPlcz1 mRNA and incubated or not with TPEN above (p<0.01). Thirty eggs per lane in all cases. This experiment was repeated twice, and the mean relative intensity of each blot is shown in the bar graph below.
-
Figure 2—source data 1
IP3R1 and TUBA western blottings.
- https://cdn.elifesciences.org/articles/88082/elife-88082-fig2-data1-v1.zip
Figure 3 with 1 supplement
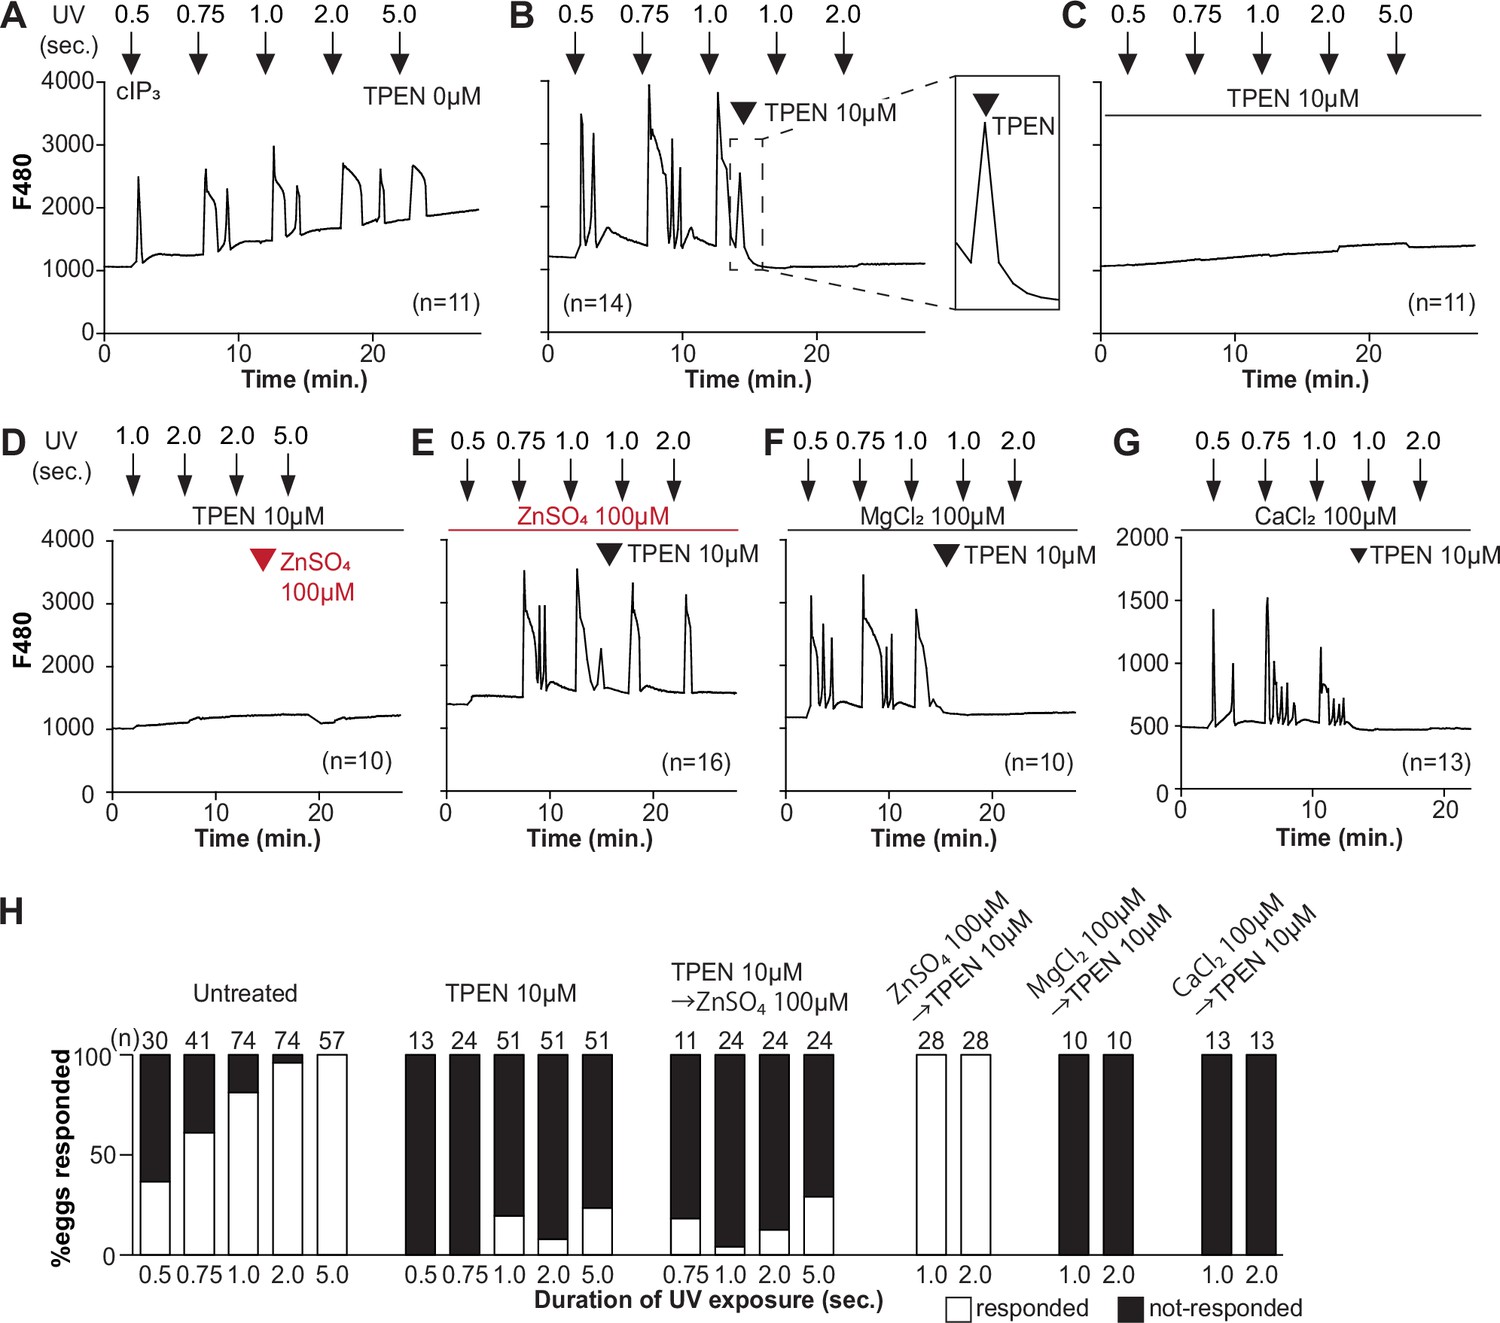
TPEN inhibition of cIP3-induced Ca2+ release is precluded by ZnSO4 supplementation before TPEN exposure.
(A–G) Representative Ca2+ responses in MII eggs triggered by the release of caged IP3 (cIP3) induced by UV light pulses of increasing duration (arrows). (A) A representative control trace without TPEN, and (B) following the addition of 10 µM TPEN between the third and the fourth pulses. The broken line rectangle is magnified in the inset, farthest right side of the panel displaying the near immediate termination of an ongoing rise. (C, D) Recordings started in the presence of 10 µM TPEN but in (D) 100 µM ZnSO4 was added between the second and the third pulses. (E) Recording started in the presence of 100 µM ZnSO4 followed by the addition of 10 µM TPEN between the third and the fourth pulses. (F, G) Recording started in the presence of 100 µM MgSO4 (F) or 100 µM CaCl2 (G) and 10 µM TPEN added as above. Arrowheads above the different panels indicate the time of TPEN or divalent cation addition. (H) Bar graphs summarizing the number and percentages of eggs that responded to a given duration of UV pulses under each of the TPEN ± divalent ions.
Figure 3—figure supplement 1
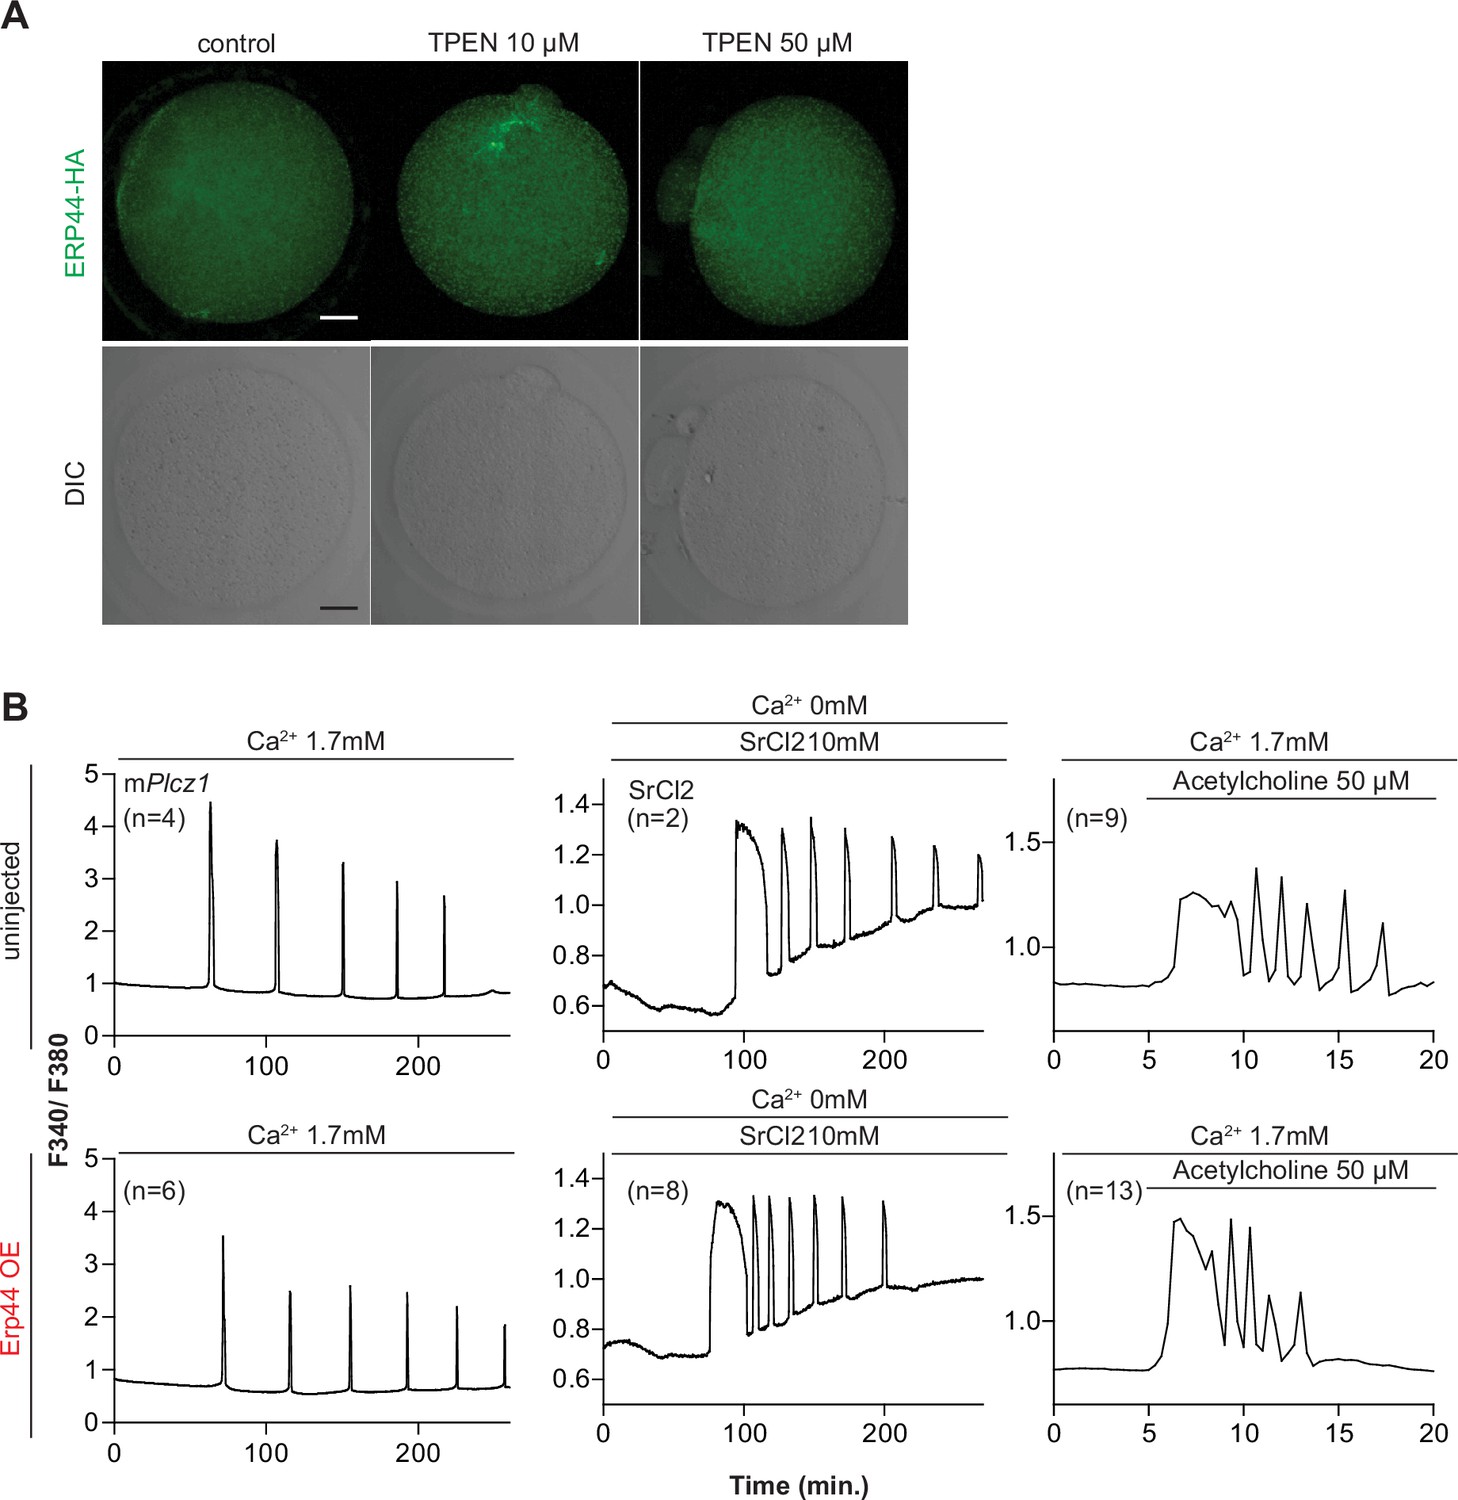
Overexpression of endoplasmic reticulum (ER) accessory protein ERp44 did not change the Ca2+ responses initiated by mPlcz1 mRNA microinjection, acetylcholine, or SrCl2.
(A) Representative immunofluorescent images of MII eggs with overexpression of ERp44. At 5 hr. post microinjection, eggs were treated with 10 or 50 µM of TPEN and incubated for 1 hr, after which they were fixed and stained. An anti-HA antibody was used. Scale bar: 10 µm. (B) Representative Ca2+ responses induced by mPlcz1 mRNA microinjection (0.01 µg/µl, left column), SrCl2 (10 mM, center column), and acetylcholine (50 µM, right column) in eggs with (top panels) or without (bottom panels) ERp44 overexpression.
Figure 4
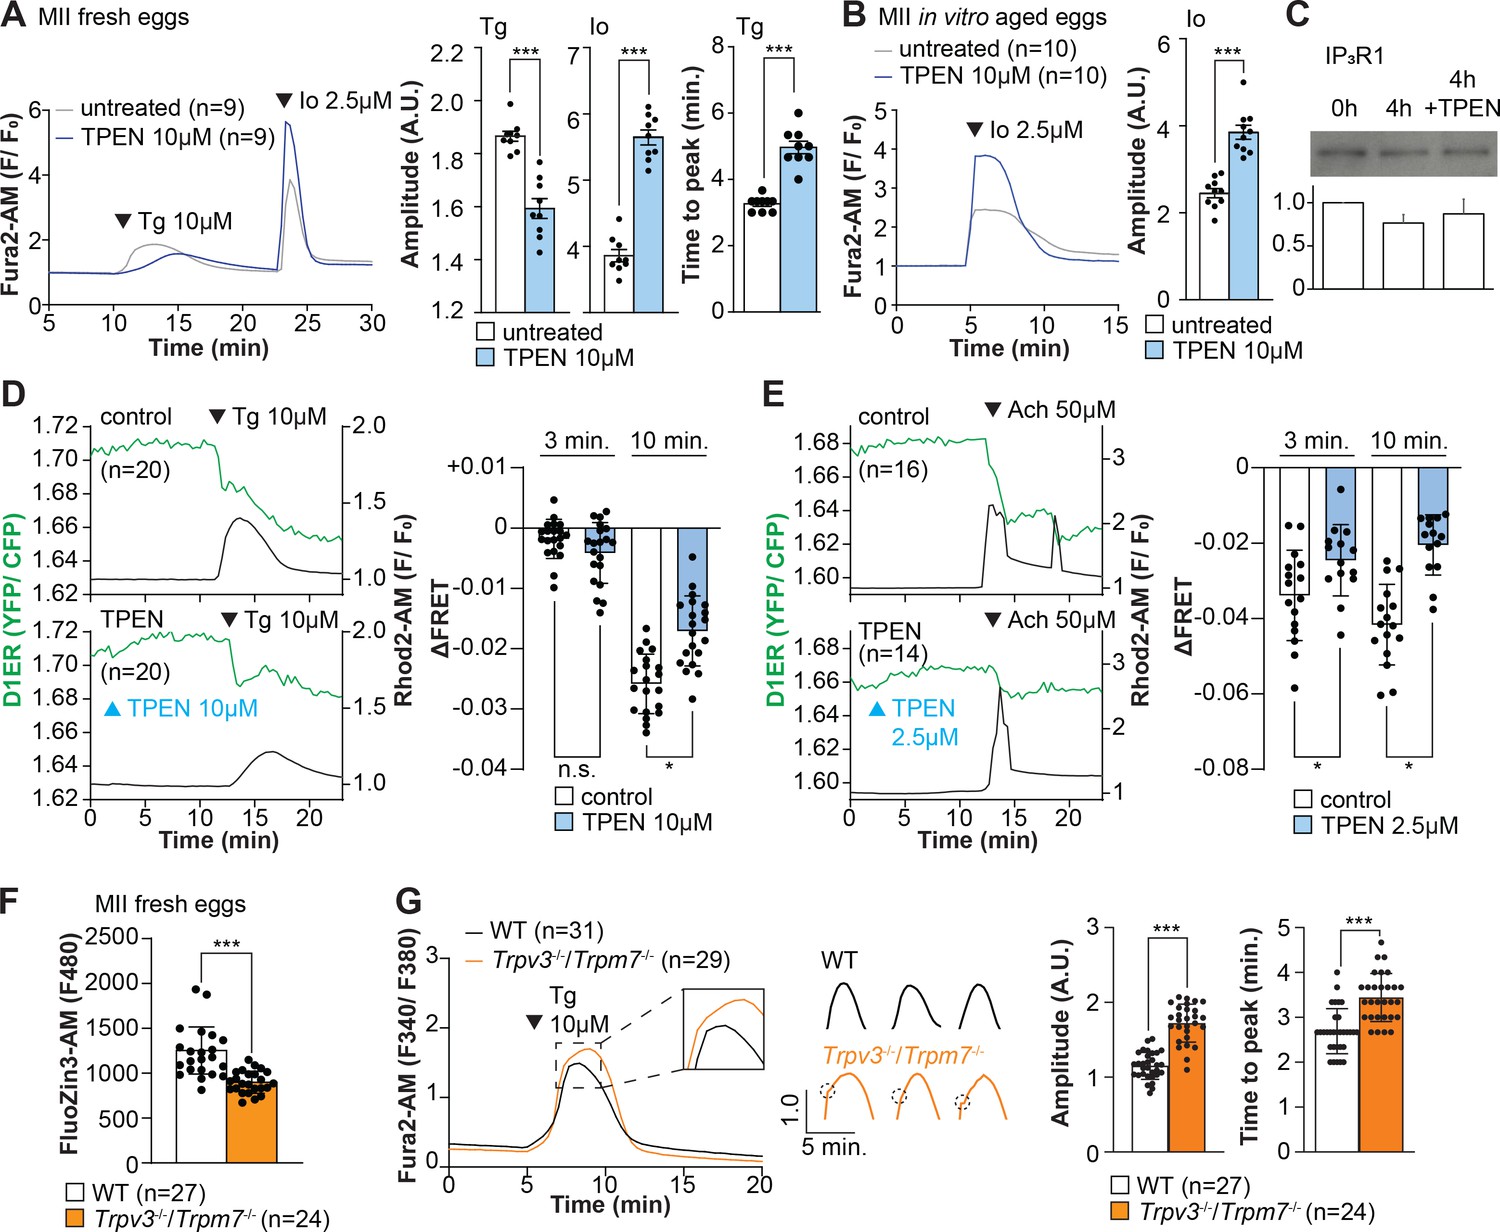
Zn2+ depletion alters Ca2+ homeostasis and increases Ca2+ store content independent of IP3R1 mass.
(A, B) Representative Ca2+ traces of MII eggs after the addition of Tg and Io in the presence or absence of TPEN. Blue trace recordings represent TPEN-treated eggs, whereas gray traces represent control, untreated eggs. (A) Io was added to fresh MII eggs once Ca2+ returned to baseline after treatment with Tg. Comparisons of mean peak amplitudes after Tg and Io are shown in the bar graphs in the right panel (p<0.001). (B) MII eggs were aged by 2 hr. incubation supplemented or not with TPEN followed by Io addition and Ca2+ monitoring (p<0.001). (C) Western blot showing the intensities of IP3R1 bands in MII eggs freshly collected, aged by 4 hr. incubation without TPEN, and with TPEN. Thirty eggs per lane in all cases. This experiment was repeated three times. (D, E) Left panels: representative traces of Ca2+ values in eggs loaded with the Ca2+-sensitive dye Rhod-2 AM and the ER Ca2+reporter, D1ER (1 µg/µl mRNA). TPEN was added into the media followed 10 min later by (D) 10 µM Tg and (E) 50 µM Ach. Right panel: bars represent the difference of FRET value between at the time of Tg/ Ach addition and at 3 and 5 min later of the addition (p<0.05). Experiments were repeated two different times for each treatment. Black and green traces represent cytosolic Ca2+ and Ca2+-ER, respectively. Blue and black arrowheads indicate the time of addition of TPEN and Tg/Ach, respectively. (F) Basal Zn2+ level comparison in WT (open bar) and Trpv3-/-/Trpm7-/- (dKO, orange bar) MII eggs. Each plot represents the Fluozin3 measurement at 5 min after starting monitoring. (G) Left panel: representative Ca2+ traces of WT (black trace) and dKO (orange trace) MII eggs after adding Tg. Insets represent the magnified traces at the peak of Ca2+ spike from different sets of eggs. Middle panel: individual traces of WT and dKO eggs after Tg addition. Dashed circles represent the flection point in dKO traces. Right panel: comparisons of mean peak amplitudes after Tg and the time between Tg addition and the Ca2+ peak are shown in the bar graphs in the right panel (p<0.001).
-
Figure 4—source data 1
IP3R1 and TPEN western blotting.
- https://cdn.elifesciences.org/articles/88082/elife-88082-fig4-data1-v1.zip
Figure 5
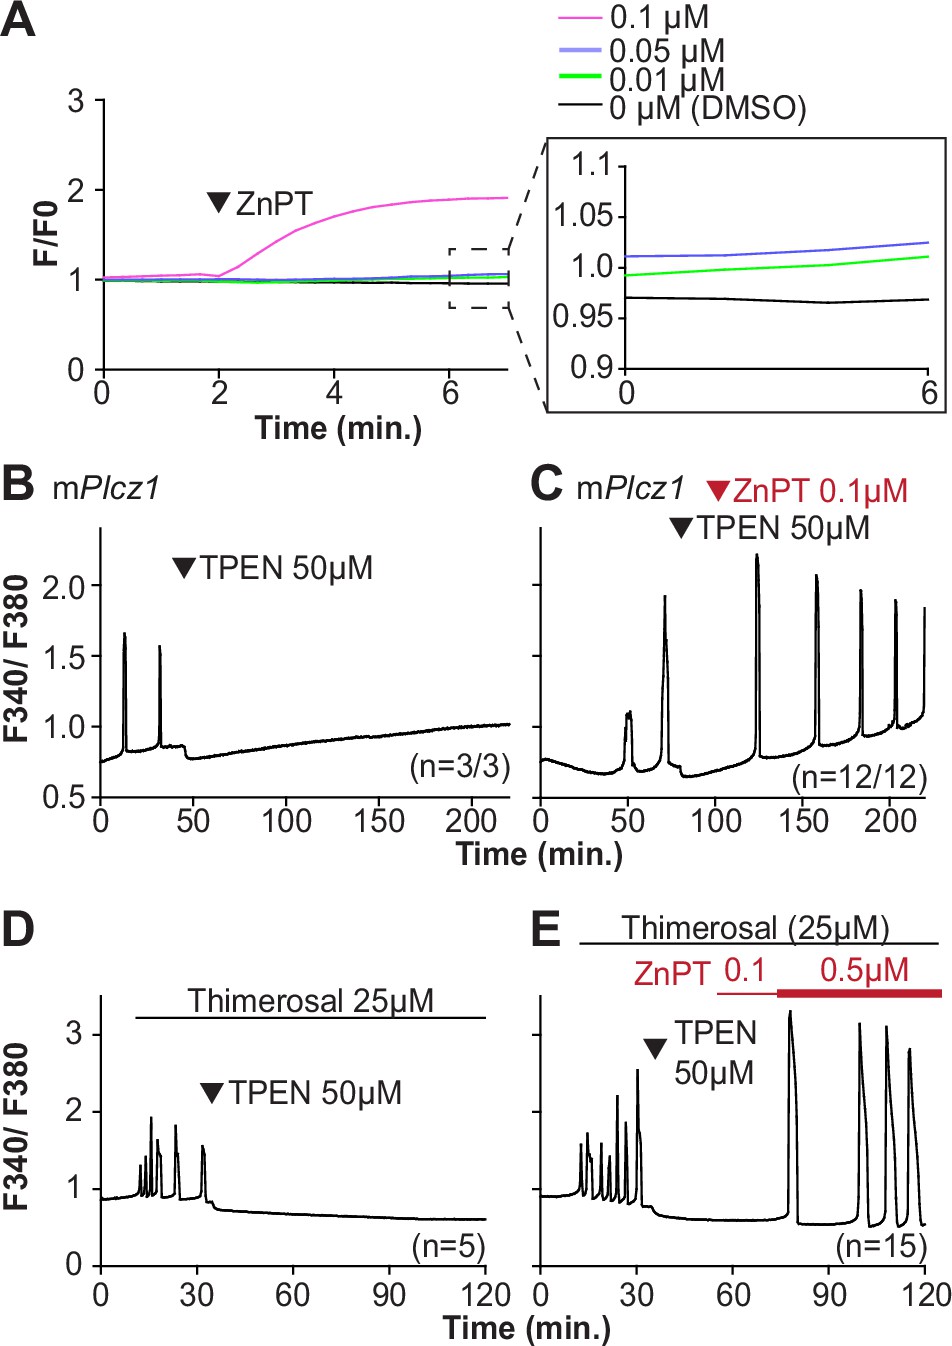
Restoring Zn2+ levels with ZnPT rescues oscillations interrupted by TPEN-induced Zn2+ deficiency.
(A) Representative traces of Zn2+ in MII eggs following the addition of 0.01–0.1 µM concentrations of ZnPT. The broken rectangular area is amplified in the next panel to appreciate the subtle increase in basal Zn2+ caused by the addition of ZnPT. (B, C) mPlcz1 mRNA (0.01 µg/µl)-induced oscillations followed by the addition of TPEN (black arrowhead) (B), or after the addition of TPEN followed by ZnPT (red arrowhead) (C). (D, E) Thimerosal (25 µM) induced oscillations using the same sequence of TPEN (D) and ZnPT (E), but higher concentrations of ZnPT were required to rescue thimerosal-initiated oscillations (E). These experiments were repeated at least two different times.
Figure 6 with 1 supplement
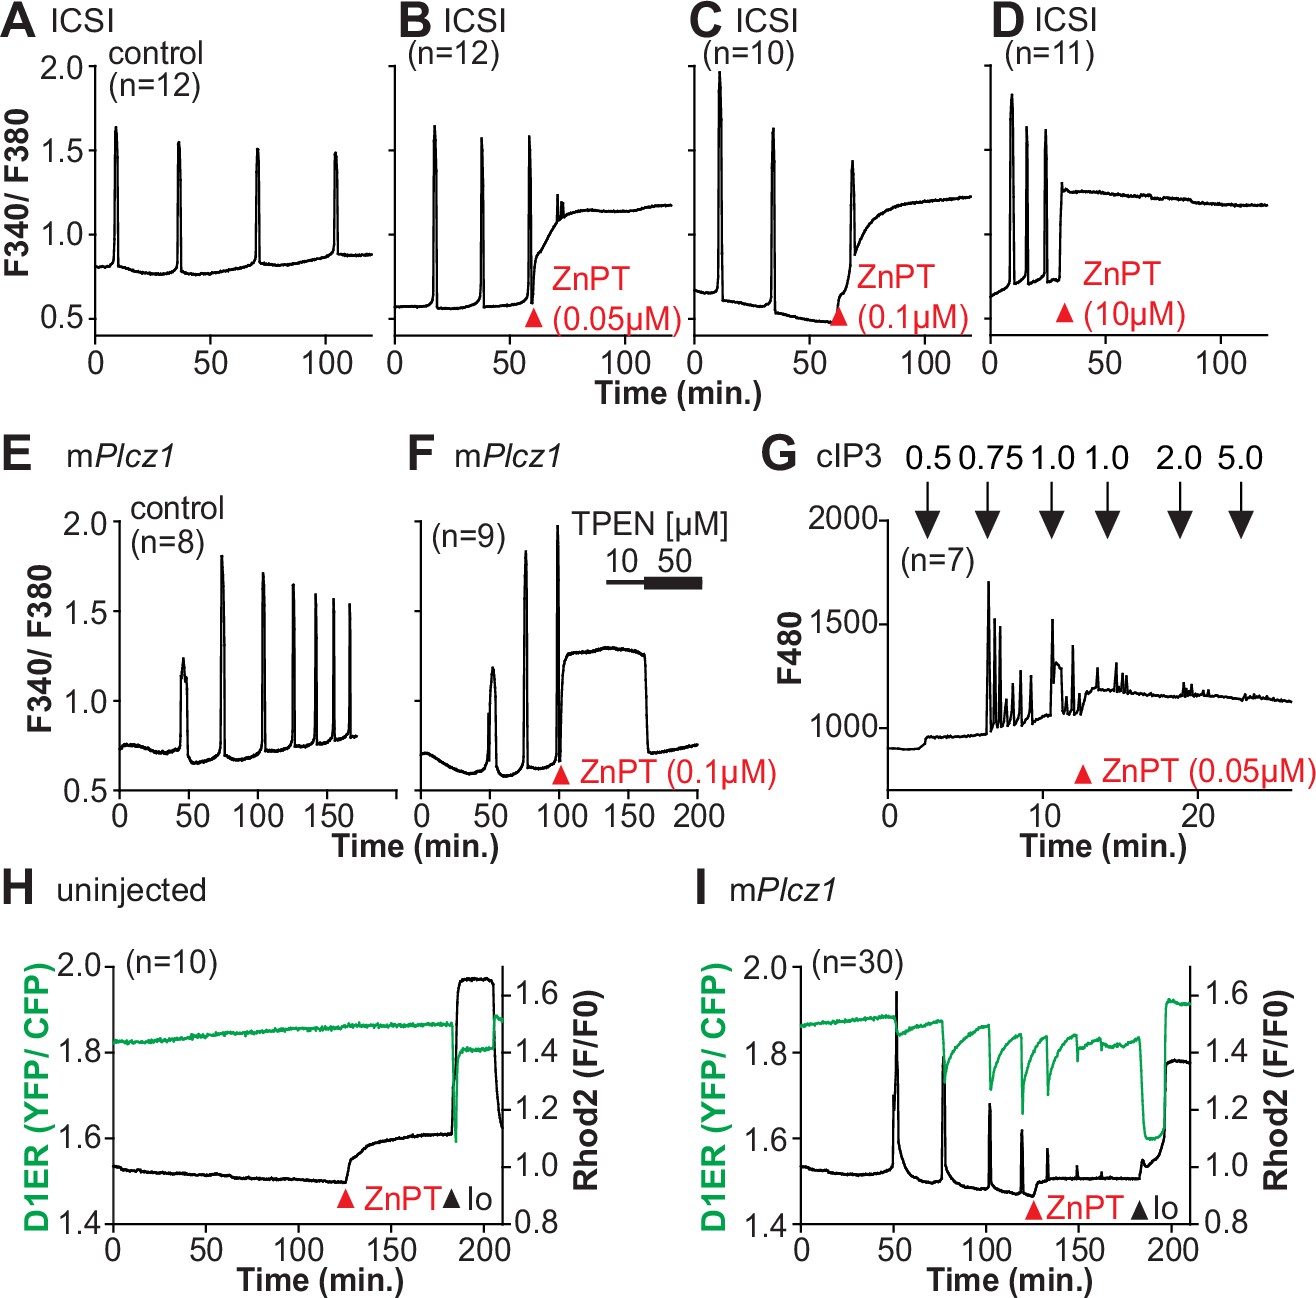
Excess Zn2+ hinders Ca2+ oscillations.
(A–D) Intracytoplasmic sperm injection (ICSI)-initiated Ca2+ response without (A) or following the addition of ZnPT (B, C) (the time of ZnPT addition and concentration are denoted above the tracing). (E, F) Representative Ca2+ responses induced by injection of 0.01 µg/µl mPlcz1 mRNA in untreated eggs (E) or in eggs treated with 0.1 µM ZnPT followed by 10 µM TPEN first and then 50 µM (F). (G) cIP3-induced Ca2+ release as expected when the UV pulses in the absence but not in the presence of 0.05 µM ZnPT (the time of addition is denoted by a bar above the tracing). (H, I) Representative traces of Ca2+ values in eggs loaded with the Ca2+-sensitive dye Rhod-2 AM and the ER Ca2+reporter, D1ER (1 µg/µl mRNA). Uninjected and 0.01 µg/µl mPlcz1 mRNA-injected eggs were monitored. After initiation and establishment of the oscillations, 0.1 µM ZnPT was added into the media followed 30 min later by 2.5 µM Io. Experiments were repeated two different times. Red and black arrowheads indicate the time of addition of ZnPT and Io, respectively.
Figure 6—figure supplement 1
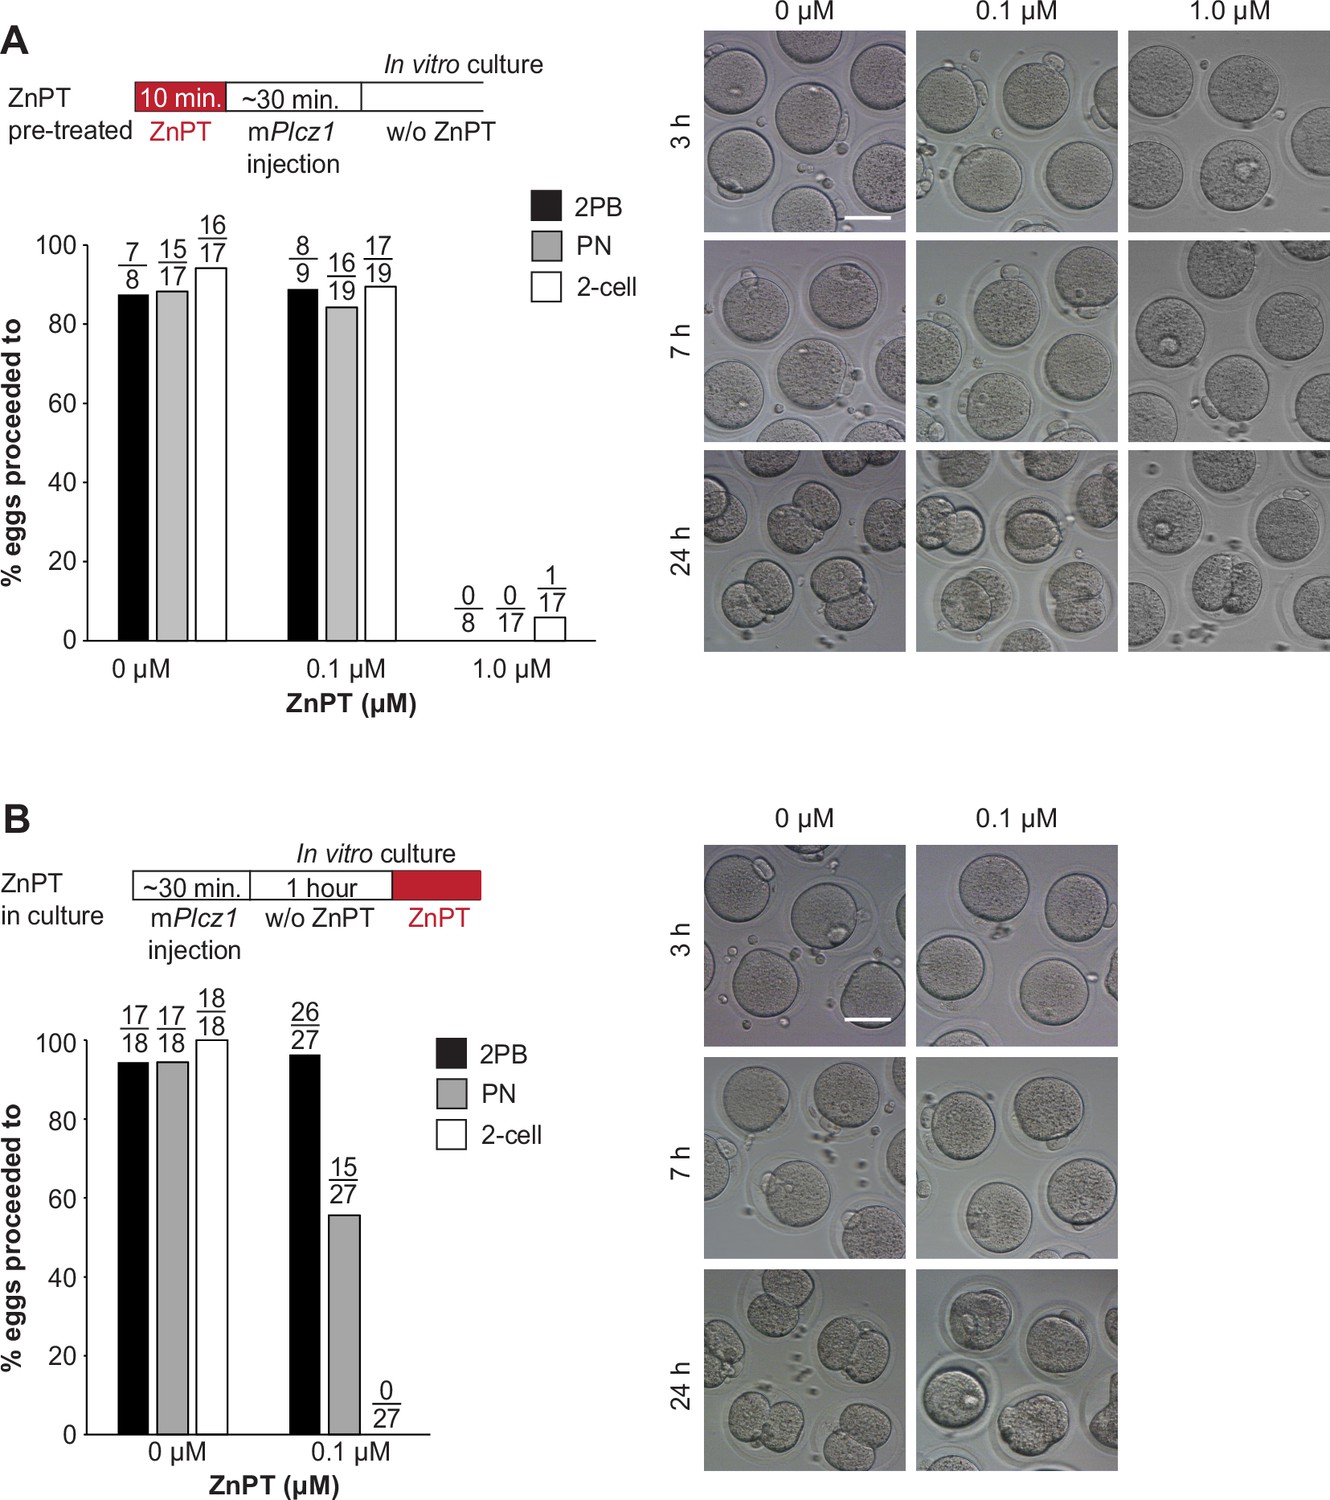
Elevated Zn2+ impairs egg activation and the subsequent embryo development.
(A) MII eggs were incubated in TL-HEPES containing 0, 0.1, or 1.0 µM ZnPT at room temperature for 10 min and washed several times with fresh TL-HEPES and injected with mPlcz1 mRNA. After it, eggs and zygotes were cultured in KSOM for 24 hr. PN formation and two-cell development were checked at 7 and 24 hr post-microinjection. Bars represent the percentages of injected eggs that reached the PN and the two-cell stage. Scale bar: 50 μm. (B) MII eggs injected with mPlcz1 mRNA were incubated in KSOM without ZnPT for an hour and then incubated in KSOM with 0 or 0.1 μM ZnPT for 24 hr. The second polar body extrusion, PN formation, and two-cell development were checked at 2.5, 7, and 24 hr. post-microinjection. Bars represent the percentages of injected eggs that reached the PN and the two-cell stage. Scale bar: 50 μm.
Figure 7
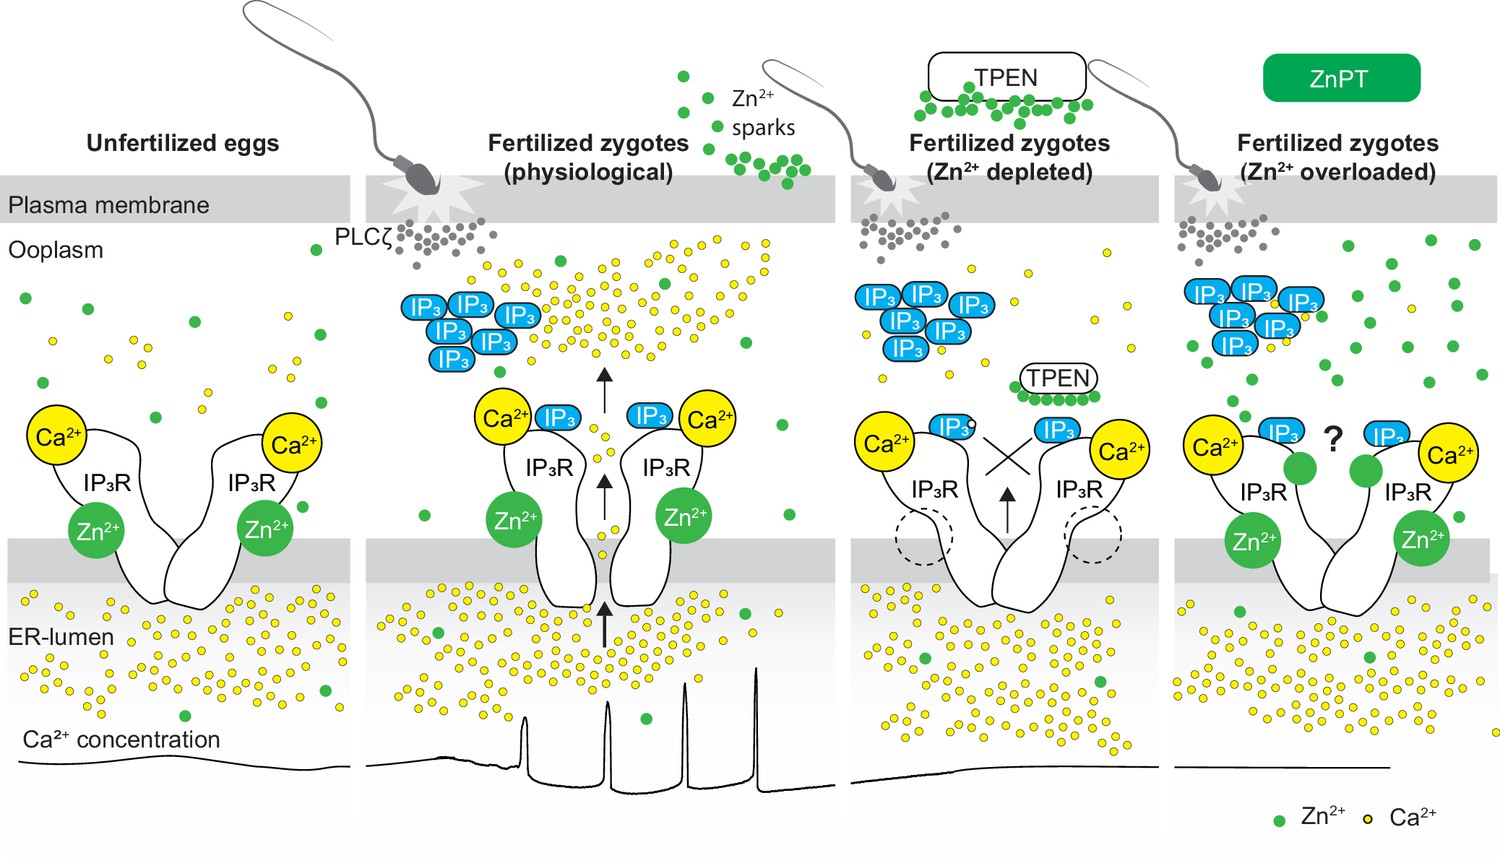
Schematic of proposed regulation of IP3R1 function by Zn2+ in eggs and fertilized zygotes.
In MII eggs, left panel, IP3R1s are in a Ca2+-release permissive state with optimal levels of cytoplasmic Ca2+ and Zn2+ and maximum endoplasmic reticulum (ER) content, but Ca2+ is maintained at resting levels by the combined actions of pumps, ER Ca2+ leak, and reduced influx. Once fertilization takes place, left center panel, robust IP3 production induced by the sperm-borne PLCζ leads to Ca2+ release through ligand-induced gating of IP3R1. Continuous IP3 production and refilling of the stores via Ca2+ influx ensure the persistence of the oscillations. Zn2+ release occurs in association with first few Ca2+ rises and cortical granule exocytosis, Zn2+ sparks, lowering Zn2+ levels but not sufficiently to inhibit IP3R1 function. Zn2+ deficiency caused by TPEN or other permeable Zn2+ chelators, right center panel, dose-dependently impairs IP3R1 function and limits Ca2+ release. We propose this is accomplished by stripping the Zn2+ bound to the residues of the zinc-finger motif in the LNK domain of IP3R1 that prevents the allosteric modulation of the gating process induced by IP3 or other agonists. We propose that excess Zn2+, right panel, also inhibits IP3R1-mediate Ca2+ release, possibly by non-specific binding of thiol groups present in cysteine residues throughout the receptor (denoted by a?). We submit that optimal Ca2+ oscillations in mouse eggs unfold in the presence of a permissive range of Zn2+ concentration.
Author response image 1

Cell-impermeable chelators effectively reduce Zn2+ levels in external media but do prevent initiation or continuation of Ca2+ oscillations.
(A) A representative trace of FluoZin3 fluorescence in replete monitoring media (TL-HEPES). The media was supplemented with cell-impermeable FluoZin-3, and after initiation of monitoring, the addition of EDTA (100 μM) occurred at the designated point (triangle). (B) The left black trace represents Ca2+ oscillations initiation by injection of mPlcζ mRNA (0.01 μg/μl). The oscillations were monitored in Ca2+ and Mg2+-free media and in the presence of EDTA (110 μM) to chelate residual divalent cations derived from the water source or reagents used to make the media. The right red trace represents the initiation of oscillations as above, but after a period indicated by the black and green bars, Ca2+ and Mg2+ were sequentially added back.
Tables
Table 1
Addition of TPEN after intracytoplasmic sperm injection (ICSI) does not prevent extrusion of the second polar body but precludes pronuclear (PN) formation.
| Group* | No. of zygotes | Second polar body (2.5 hr) | PN | |
|---|---|---|---|---|
| 4 hr | 7 hr | |||
| Untreated | 26 | 25 (96.1%) | 23 (88.5%) | 23 (88.5%) |
| TPEN (10 µM) | 27 | 24 (88.9%) | 1 (3.7%)*** | 2 (7.4%)*** |
-
***p<0.001.
-
*
Data from three different replicates for each group.
Key resources table
| Reagent type (species) or resource | Designation | Source or reference | Identifiers | Additional information |
|---|---|---|---|---|
| Genetic reagent (Mus musculus) | CD1 | Charles River | 022 | |
| Genetic reagent (M. musculus) | C57BL/6J | JAX | JAX: 000664 | |
| Genetic reagent (M. musculus) | Trpm7-floxed | A generous gift from Dr. Carmen P. Williams (NIEHS) (PMID:30322909) | C57BL6/J and 129s4/SvJae mixed background | |
| Genetic reagent (M. musculus) | Gdf9-cre | JAX | JAX: 011062 | |
| Genetic reagent (M. musculus) | Trpv3−/− | A generous gift from Dr H. Xu (PMID:20403327) | C57BL/6J and 129/SvEv mixed background | |
| Biological sample (mouse oocyte) | Mus musculus | This paper | Eggs at the metaphase of the second meiosis | |
| Biological sample (mouse sperm) | Mus musculus | This paper | Matured sperm from cauda epididymis | |
| Recombinant DNA reagent | pcDNA6-mouse Plcz1-venus (plasmid used as a template for mRNA synthesis) | Published in previous Fissore lab paper PMID: 34313315 Mouse Plcz1 sequence was a generous gift from Dr. Kiyoko Fukami (PMID:18028898) | Mouse Plcz1 mRNA was fused with Venus and inserted in pcDNA6 vector | |
| Recombinant DNA reagent | pcDNA6-CALR-D1ER-KDEL (plasmid used as a template for mRNA synthesis) | Published in previous Fissore lab paper PMID:24101727 Original D1ER vector was a generous gift from Dr. Roger Y Tsien (PMID:15585581) | FRET construct D1ER was inserted between ER-targeting sequence of calreticulin and KDEL ER retention signal in pcDNA6 vector | |
| Recombinant DNA reagent | pcDNA6-human ERP44-HA (plasmid used as a template for mRNA synthesis) | This paper Original human ERp44 sequence was a generous gift from Dr. Roberto Sitia (PMID:11847130) | Human ERP44 mRNA fused with HA in pcDNA6/Myc His B vector | |
| Antibody | Monoclonal HA (mouse monoclonal) | Roche | 11581816001 | Dilution: 1:200 |
| Antibody | Polyclonal IP3R1 (rabbit polyclonal) | Parys et al., 1995 | Dilution: 1:1000 | |
| Antibody | Monoclonal α-tubulin (mouse monoclonal) | Sigma-Aldrich | T-9026 | Dilution: 1:1000 |
| Antibody | Alexa Fluor 488 (goat polyclonal) | Invitrogen | Invitrogen: A32723 | Dilution: 1:400 |
| Commercial assay or kit | T7 mMESSAGE mMACHINE Kit | Invitrogen | Invitrogen: AM1344 | Used for in vitro mRNA synthesis |
| Commercial assay or kit | Poly(A) Tailing Kit | Invitrogen | Invitrogen: AM1350 | Used for poly (A) tailing of synthesized mRNA |
| Chemical compound, drug | Hyaluronidase from bovine testes | Sigma-Aldrich | H3506 | |
| Chemical compound, drug | 3-Isobutyl-1-methylxanthine (IBMX) | Sigma-Aldrich | I5879 | |
| Chemical compound, drug | Polyvinylpyrrolidone (PVP) (average molecular weight: 360,000) | Sigma-Aldrich | PVP360 | Used for mRNA microinjection and ICSI |
| Chemical compound, drug | N,N, N′,N′-Tetrakis (2-pyridylmethyl) ethylenediamine (TPEN) | Sigma-Aldrich | P4413 | Prepared in DMSO and kept at –20°C until use |
| Chemical compound, drug | Zinc pyrithione (ZnPT) | Sigma-Aldrich | PHR1401 | Prepared in DMSO and kept at –20°C until use |
| Chemical compound, drug | Strontium chloride hexahydrate (SrCl2) | Sigma-Aldrich | 255521 | Freshly dissolved in water on the day of experiment |
| Chemical compound, drug | Calcium chloride dihydrate (CaCl2) | Sigma-Aldrich | C3881 | Freshly dissolved in water on the day of experiment |
| Chemical compound, drug | Magnesium chloride hexahydrate (MgCl2) | Sigma-Aldrich | M2393 | Freshly dissolved in water on the day of experiment |
| Chemical compound, drug | Zinc sulfate monohydrate (ZnSO4) | Acros Organics | 389802500 | Freshly dissolved in water on the day of experiment |
| Chemical compound, drug | Ethylenediaminetetraacetic acid sodium dihydrate (EDTA) | LabChem | LC137501 | Prepared as 0.5 M aqueous solution with pH 8.0 adjusted by NaOH |
| Chemical compound, drug | Diethylenetriaminepentaacetic acid (DTPA) | Sigma-Aldrich | D6518 | |
| Chemical compound, drug | Tris (2-pyridylmethyl) amine (TPA) | Santa Cruz | sc-477037 | |
| Chemical compound, drug | Dimethyl sulfoxide (DMSO) | Sigma-Aldrich | D8418 | Used as a solvent |
| Chemical compound, drug | Acetylcholine chloride | Sigma-Aldrich | A6625 | |
| Chemical compound, drug | Thimerosal | Sigma-Aldrich | T5125 | Freshly dissolved in water on the day of experiment and kept on ice until use |
| Chemical compound, drug | Ionomycin calcium salt | Tocris | 1704 | Working concentration: 2.5 µM |
| Chemical compound, drug | Thapsigargin | Calbiochem | #586500 | Working concentration: 10 µM |
| Other | Pluronic F-127 (20% solution in DMSO) (pluronic acid) | Invitrogen | P3000MP | Added to dye dilutions to facilitate the solubilization |
| Other | Fura-2 AM | Invitrogen | F1221 | Ratiometric fluorescent Ca2+ indicator Used at 1.25 µM in TL-HEPES containing 0.02% pluronic acid |
| Other | FluoZin-3 AM | Invitrogen | F24195 | Fluorescent Zn2+ indicator Used at 1.25 µM in TL-HEPES containing 0.02% pluronic acid |
| Other | Fluo-4 AM | Invitrogen | F14201 | Fluorescent Ca2+ indicator Used at 1.25 µM in TL-HEPES containing 0.02% pluronic acid |
| Other | Rhod2-AM | Invitrogen | R1244 | Fluorescent Ca2+ indicator Used at 2.2 µM in TL-HEPES containing 0.02% pluronic acid. |
| Other | ci-IP3/PM | Tocris | 6210 | Photo-activatable IP3. Dissolved in DMSO and kept at –20°C Before use, the stock was diluted with water to make a final concentration of 0.25 mM |
| Other | Pme1 | New England BioLabs | R0560S | Used to linearize pcDNA6 vectors for mRNA synthesis |
| Software, algorithm | Prism | GraphPad Software | Version 5.01 |
Additional files
Download links
A two-part list of links to download the article, or parts of the article, in various formats.
Downloads (link to download the article as PDF)
Open citations (links to open the citations from this article in various online reference manager services)
Cite this article (links to download the citations from this article in formats compatible with various reference manager tools)
Zn2+ is essential for Ca2+ oscillations in mouse eggs
eLife 12:RP88082.
https://doi.org/10.7554/eLife.88082.3


